










Network monitoring tools have become essential as infrastructure grows more distributed across cloud providers, on-premises data centers, and hybrid environments. According to the CNCF Annual Survey 2024, 71% of organizations now run production workloads across multiple cloud providers, making visibility into network performance, bandwidth usage, and device health critical to preventing downtime and maintaining SLAs.
This guide compares 10 network monitoring tools across open source platforms, SaaS solutions, and self-hosted options. Each is assessed on total cost of ownership, deployment model, protocol support (SNMP, NetFlow, sFlow, IPFIX), and ease of setup. Pricing figures include real cost scenarios for small, midsize, and enterprise teams.
Quick Comparison: 10 Network Monitoring Tools at a Glance
| Tool | Best For | Pricing Model | Self Hosted? | Protocol Support |
|---|---|---|---|---|
| CubeAPM | Unified infra + network monitoring | $0.2/GB ingestion | ✓ Yes | SNMP, NetFlow, sFlow, IPFIX |
| Zabbix | Enterprise network monitoring | Free open source | ✓ Yes | SNMP, IPMI, JMX, custom agents |
| PRTG Network Monitor | Windows environments, all-in-one monitoring | Free up to 100 sensors, paid from $1,750 | ✓ Yes | SNMP, WMI, NetFlow, packet sniffing |
| Nagios Core | Traditional infra monitoring, alerting | Free open source | ✓ Yes | SNMP, NRPE, SSH, custom plugins |
| ManageEngine OpManager | Mid market IT teams, multi vendor networks | Free up to 10 devices, paid from $245/year | ✓ Yes | SNMP, WMI, CLI, Telnet, SSH |
| SolarWinds Network Performance Monitor | Large enterprises, deep network diagnostics | Custom pricing, starts ~$3,000 | ✓ Yes | SNMP, NetFlow, sFlow, IPFIX, J-Flow |
| Prometheus + Grafana | Cloud native monitoring, Kubernetes | Free open source | ✓ Yes | PromQL exporters, SNMP exporter available |
| Datadog Network Performance Monitoring | Multi-cloud SaaS teams | $5/host/month + base platform cost | ✗ SaaS only | Flow data, DNS, TCP/UDP metrics |
| Auvik | MSPs, multi-client network management | Custom pricing, starts ~$120/month per network | ✗ SaaS only | SNMP, WMI, NetFlow, sFlow |
| LibreNMS | Community-driven open source monitoring | Free open source | ✓ Yes | SNMP, automatic discovery, alerting |
Cost estimates are directional based on public pricing as of early 2026. Actual costs vary by device count, data volume, retention period, support level, and enterprise discounts.
1. CubeAPM
CubeAPM is a self-hosted, OpenTelemetry native observability platform that covers network monitoring, infrastructure monitoring, APM, logs, and Kubernetes monitoring in one unified view. It runs inside your cloud or on-premises, giving teams full data control with no SaaS egress fees or external dependencies during incidents.
Key Features:
- Unified network metrics, infrastructure metrics, traces, and logs in one platform
- Native SNMP, NetFlow, sFlow, and IPFIX support for network flow analysis
- Bandwidth monitoring, latency tracking, and device health dashboards
- Self-hosted deployment with managed upgrades and vendor support
- Unlimited data retention with predictable ingestion-based pricing
Pricing: $0.20/GB for data ingestion, with no per-device, per-host, or per-user fees. A team monitoring 100 network devices generating 500 GB/month of telemetry data pays $100/month.
Pros:
- Single platform for network, infrastructure, APM, and logs eliminates tool sprawl
- No data leaves your infrastructure; compliant by design for regulated industries
- Predictable pricing; no surprise bills from device count increases or traffic spikes
- Native OpenTelemetry support makes integration with existing stacks simple
Cons:
- Requires BYOC or on-premises deployment; your team manages the infrastructure
- SSO and RBAC features less mature than enterprise SaaS incumbents
- No autonomous anomaly detection for network baselines
Best for: DevOps and platform teams that want unified network and application monitoring inside their own cloud without SaaS data egress, pricing sprawl, or DIY self-hosting overhead.
2. Zabbix
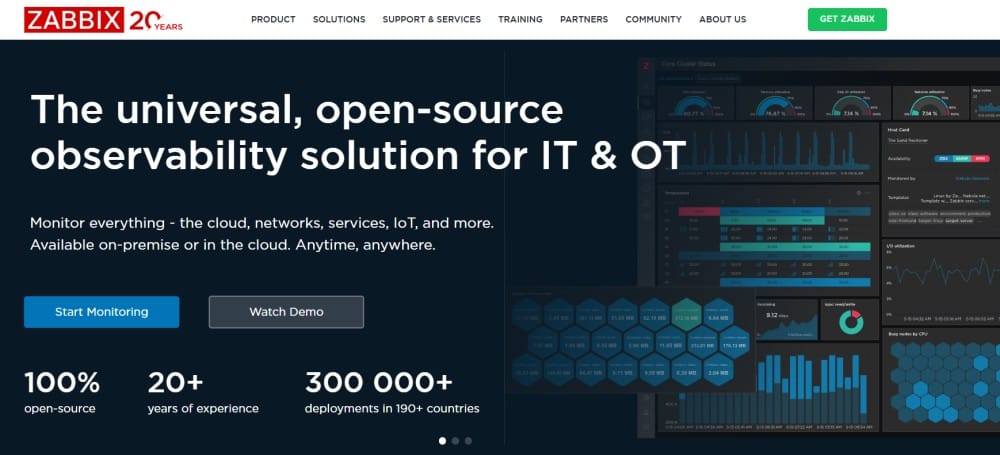
Zabbix is a mature open source network monitoring platform widely used in enterprise environments. It monitors servers, networks, applications, and services with deep customization options and no licensing costs.
Key Features:
- Agentless SNMP monitoring and agent-based monitoring for Linux, Windows, and network devices
- Customizable dashboards, maps, and network topology visualization
- Flexible alerting with escalation, dependencies, and maintenance windows
- Template-based configuration for common devices and services
- Active community with pre-built templates for popular network gear
Pricing: Free open source software. Infrastructure costs depend on deployment size. A 200 device deployment typically needs 4 vCPUs and 8 GB RAM, costing $50 to $100/month on AWS or Azure. Zabbix LLC offers commercial support starting at $1,200/year per 100 monitored devices.
Pros:
- No licensing fees; unlimited devices and users
- Extremely flexible and customizable for complex environments
- Strong SNMP support with automatic discovery of network devices
- Active development and large community for troubleshooting
Cons:
- Steep learning curve; setup and configuration require significant time investment
- UI feels dated compared to modern SaaS tools
- Scaling to thousands of devices requires careful database tuning and partitioning
Best for: Enterprise IT teams with in-house expertise who need deep customization and control over their network monitoring stack without recurring licensing costs.
3. PRTG Network Monitor

PRTG Network Monitor from Paessler is an all-in-one monitoring solution popular in Windows-heavy environments. It uses a sensor-based licensing model where each monitored data point counts as one sensor.
Key Features:
- Monitors network devices, servers, applications, bandwidth, and traffic via SNMP, WMI, NetFlow, and packet sniffing
- Auto discovery scans your network and creates sensors automatically
- Pre-configured sensors for common devices, services, and applications
- Web-based interface with customizable maps and dashboards
- Mobile apps for iOS and Android
Pricing: Free for up to 100 sensors. Paid licenses start at $1,750 for 500 sensors, $3,500 for 1,000 sensors, $7,200 for 2,500 sensors, $14,500 for 5,000 sensors. Pricing is perpetual with annual maintenance optional. Verify current rates at the PRTG pricing page.
Pros:
- Simple setup with auto discovery and pre-built sensors
- Strong Windows integration via WMI
- One-time license fee; no recurring monthly charges
- Comprehensive monitoring in one tool
Cons:
- Sensor count can grow fast; a switch with 48 ports monitored individually uses 48 sensors
- Windows-only installation limits deployment flexibility
- Scaling beyond 5,000 sensors requires multiple PRTG instances
Best for: Small to midsize IT teams in Windows-heavy environments who want simple setup and prefer one-time licensing over subscription pricing.
4. Nagios Core
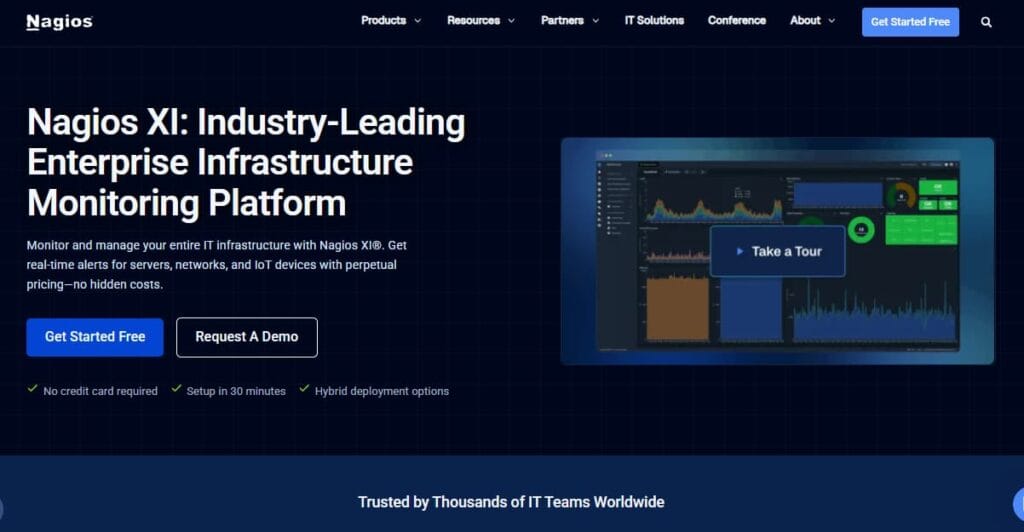
Nagios Core is one of the oldest and most widely deployed open source monitoring tools. It monitors network services, host resources, and server components with a plugin-based architecture.
Key Features:
- Monitors network devices, servers, applications, and services via SNMP, NRPE, SSH, and custom plugins
- Flexible alerting with escalations and notifications via email, SMS, or custom scripts
- Large plugin ecosystem covering thousands of services and devices
- Web-based interface with status dashboards and reports
- Active-passive check capabilities for distributed monitoring
Pricing: Free open source software. Commercial version (Nagios XI) starts at $2,995 for 100 nodes. Infrastructure costs for self-hosting Nagios Core are minimal; a single VM with 2 vCPUs and 4 GB RAM handles 500+ devices, costing $25 to $50/month.
Pros:
- Battle-tested and reliable – used by thousands of organizations for decades
- Highly extensible with plugins for almost any monitoring need
- No licensing costs for Nagios Core
- Strong community support and documentation
Cons:
- Configuration is text file-based; no GUI for setup in open source version
- Interface looks dated compared to modern tools
- Scaling to thousands of devices requires distributed Nagios setups
- Plugin quality varies; community plugins may lack maintenance
Best for: Traditional IT teams with Linux expertise who need proven, extensible monitoring and prefer configuration as code over GUI-based setup.
5. ManageEngine OpManager
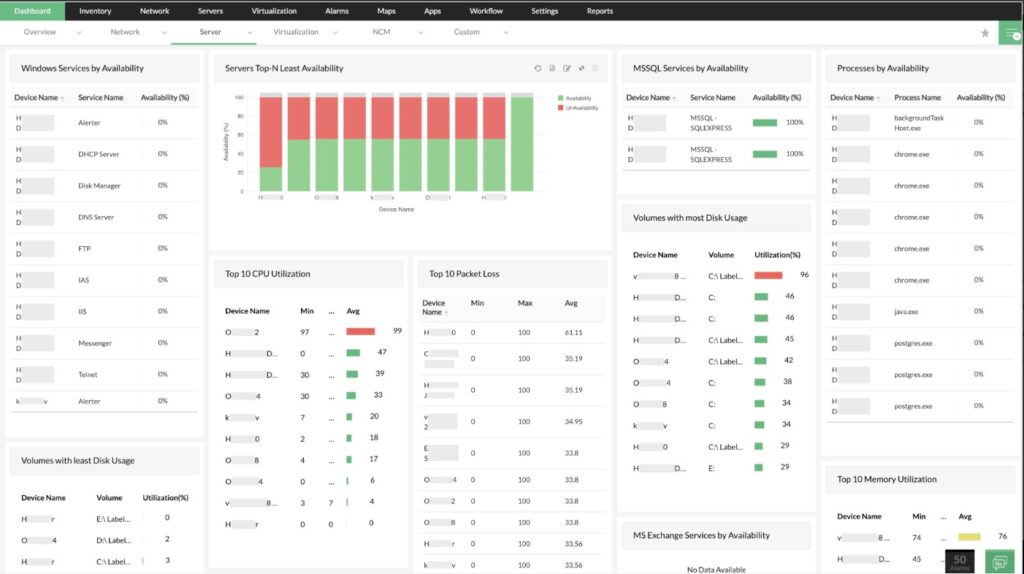
OpManager from ManageEngine is a network monitoring tool designed for mid-market IT teams managing multi-vendor network infrastructure. It provides fault and performance monitoring with pre-built templates for popular network devices.
Key Features:
- Auto discovery and monitoring of network devices via SNMP, WMI, CLI, Telnet, and SSH
- Pre-built monitor templates for Cisco, Juniper, HP, Dell, and other vendors
- Network maps with real-time status visualization
- Bandwidth monitoring with NetFlow, sFlow, J-Flow, and IPFIX support
- Built-in alerting and workflows for incident response
Pricing: Free edition monitors up to 10 devices. Paid editions start at $245/year for 25 devices (Essential), $715/year for 100 devices (Professional), $8,995/year for 500 devices (Enterprise). Verify current rates at the ManageEngine OpManager pricing page.
Pros:
- Simple setup with auto discovery and vendor-specific templates
- Affordable pricing for small to midsize deployments
- Windows and Linux installation options
- Good documentation and vendor support
Cons:
- Free tier limited to 10 devices; not viable for growing networks
- UI feels less modern than SaaS competitors
- Advanced features like NCM (network configuration management) sold separately
Best for: Mid-market IT teams managing 50 to 500 network devices who want vendor-supported monitoring without enterprise tool complexity.
6. SolarWinds Network Performance Monitor
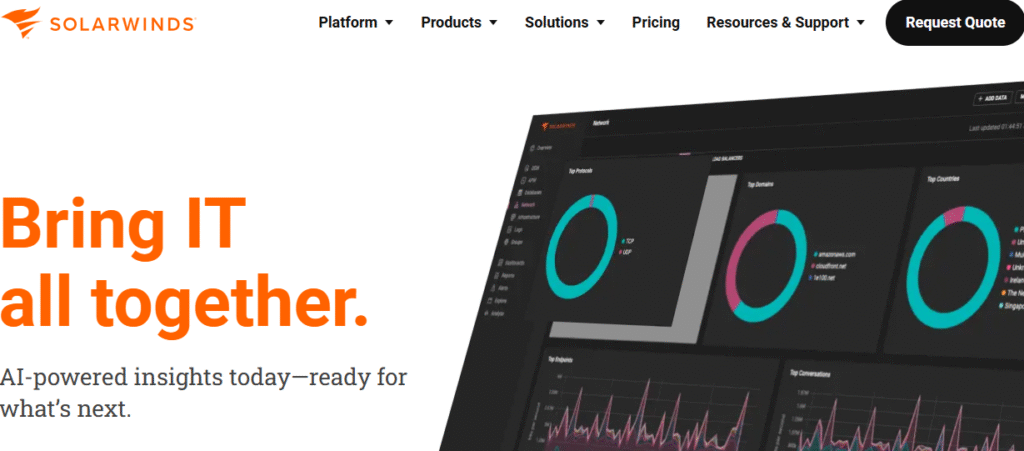
SolarWinds Network Performance Monitor (NPM) is a comprehensive network monitoring platform widely used in large enterprises. It provides deep visibility into network performance, fault detection, and capacity planning.
Key Features:
- Monitors routers, switches, firewalls, load balancers, and wireless controllers via SNMP
- NetFlow, sFlow, J-Flow, and IPFIX support for traffic analysis and bandwidth monitoring
- Intelligent network maps with Layer 2 and Layer 3 topology discovery
- PerfStack for correlating network metrics with application and infrastructure data
- Built-in alerting with customizable thresholds and suppression during maintenance windows
Pricing: Custom pricing based on the number of elements monitored. Entry-level deployments start around $3,000 for 100 elements. Enterprise deployments monitoring 1,000+ elements typically cost $15,000 to $30,000+. Contact SolarWinds for exact pricing on the SolarWinds NPM pricing page.
Pros:
- Industry-leading network performance monitoring with deep protocol support
- Excellent vendor support and professional services
- Strong integration with other SolarWinds modules (Server & Application Monitor, Database Performance Analyzer)
- Mature product with extensive documentation
Cons:
- High upfront cost and ongoing maintenance fees
- Windows-only installation
- Licensing based on element count can get expensive as networks grow
- SolarWinds brand reputation damaged by 2020 supply chain attack
Best for: Large enterprises with complex multi-vendor networks who need deep network diagnostics and can afford enterprise pricing.
7. Prometheus + Grafana
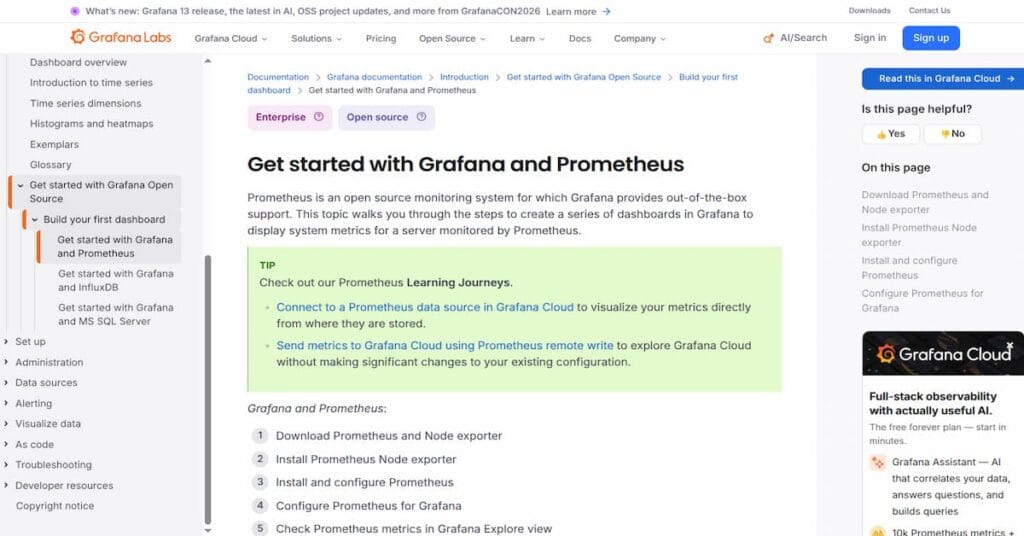
Prometheus is an open source monitoring system originally built at SoundCloud, now a CNCF graduated project. It collects time series metrics and stores them locally. Grafana provides visualization and dashboards. Together they form a popular stack for cloud native monitoring.
Key Features:
- Pull-based metric collection from exporters running on monitored systems
- SNMP exporter available for monitoring network devices
- Powerful PromQL query language for analyzing time series data
- Service discovery for dynamic environments like Kubernetes
- Alertmanager handles alert routing and grouping
Pricing: Free open source software. Infrastructure costs depend on data volume and retention. A deployment monitoring 100 devices with 7-day retention typically needs 4 vCPUs and 16 GB RAM, costing $100 to $150/month on cloud providers. Managed Prometheus options like Grafana Cloud start at $0.50/GB ingested.
Pros:
- Native Kubernetes and cloud native monitoring
- No vendor lock-in – widely adopted in modern infrastructure
- Flexible querying with PromQL
- Large ecosystem of exporters for monitoring almost anything
Cons:
- SNMP monitoring requires additional exporter setup, not as turnkey as traditional tools
- Long-term storage requires external systems like Thanos or Cortex
- No built-in UI; depends on Grafana for visualization
- Alerting configuration can be complex for network-specific use cases
Best for: Cloud native teams already using Prometheus for application monitoring who want to extend it to network monitoring with SNMP exporters.
8. Datadog Network Performance Monitoring
Datadog NPM is a SaaS add-on to the Datadog platform that provides network flow monitoring across cloud and hybrid environments. It tracks network traffic between services, containers, and availability zones.
Key Features:
- Real-time network flow monitoring with DNS, TCP, and UDP metrics
- Service-to-service network maps showing traffic patterns and latency
- Cloud native integration with AWS, Azure, and GCP networking
- Correlates network metrics with APM traces and infrastructure metrics
- No agents required on network devices; uses flow data from cloud providers
Pricing: $5/host/month for Network Performance Monitoring, added to base Datadog Infrastructure Monitoring ($15/host/month). A 50-host deployment costs $1,000/month ($20/host × 50). Verify current rates at the Datadog pricing page.
Pros:
- Seamless integration with existing Datadog APM and infrastructure monitoring
- Cloud native; designed for AWS VPC Flow Logs, Azure NSG Flow Logs, and GCP VPC Flow Logs
- No additional agents or exporters needed
- Fast setup; enable in Datadog console and start seeing network flows immediately
Cons:
- SaaS only; no on-premises deployment option
- Per-host pricing scales linearly with infrastructure growth
- Limited traditional SNMP monitoring for physical network devices
- High cost compared to open source alternatives at scale
Best for: Teams already using Datadog for APM and infrastructure monitoring who want to add network visibility without deploying separate tools.
9. Auvik

Auvik is a SaaS network monitoring platform designed for managed service providers (MSPs) managing multiple client networks. It provides automatic discovery, monitoring, and documentation of network infrastructure.
Key Features:
- Automatic network discovery and topology mapping
- Real-time monitoring of network devices via SNMP, WMI, NetFlow, and sFlow
- Network documentation automatically generated and kept up to date
- Multi-tenant architecture for MSPs managing multiple client networks
- Mobile app for monitoring on the go
Pricing: Custom pricing based on number of networks and billable devices. Starts around $120/month per network for essential monitoring. Enterprise features and larger deployments require custom quotes. Contact Auvik for pricing on the Auvik pricing page.
Pros:
- Automatic network discovery saves hours of manual configuration
- Clean, modern UI designed for ease of use
- Strong MSP features with multi-client management
- Good vendor support and onboarding
Cons:
- SaaS only; no on-premises option for data-sensitive environments
- Pricing can get expensive for large networks
- Limited customization compared to open source tools
- Dependent on internet connectivity for access during outages
Best for: Managed service providers and IT teams managing multiple networks who want automatic discovery and SaaS convenience.
10. LibreNMS
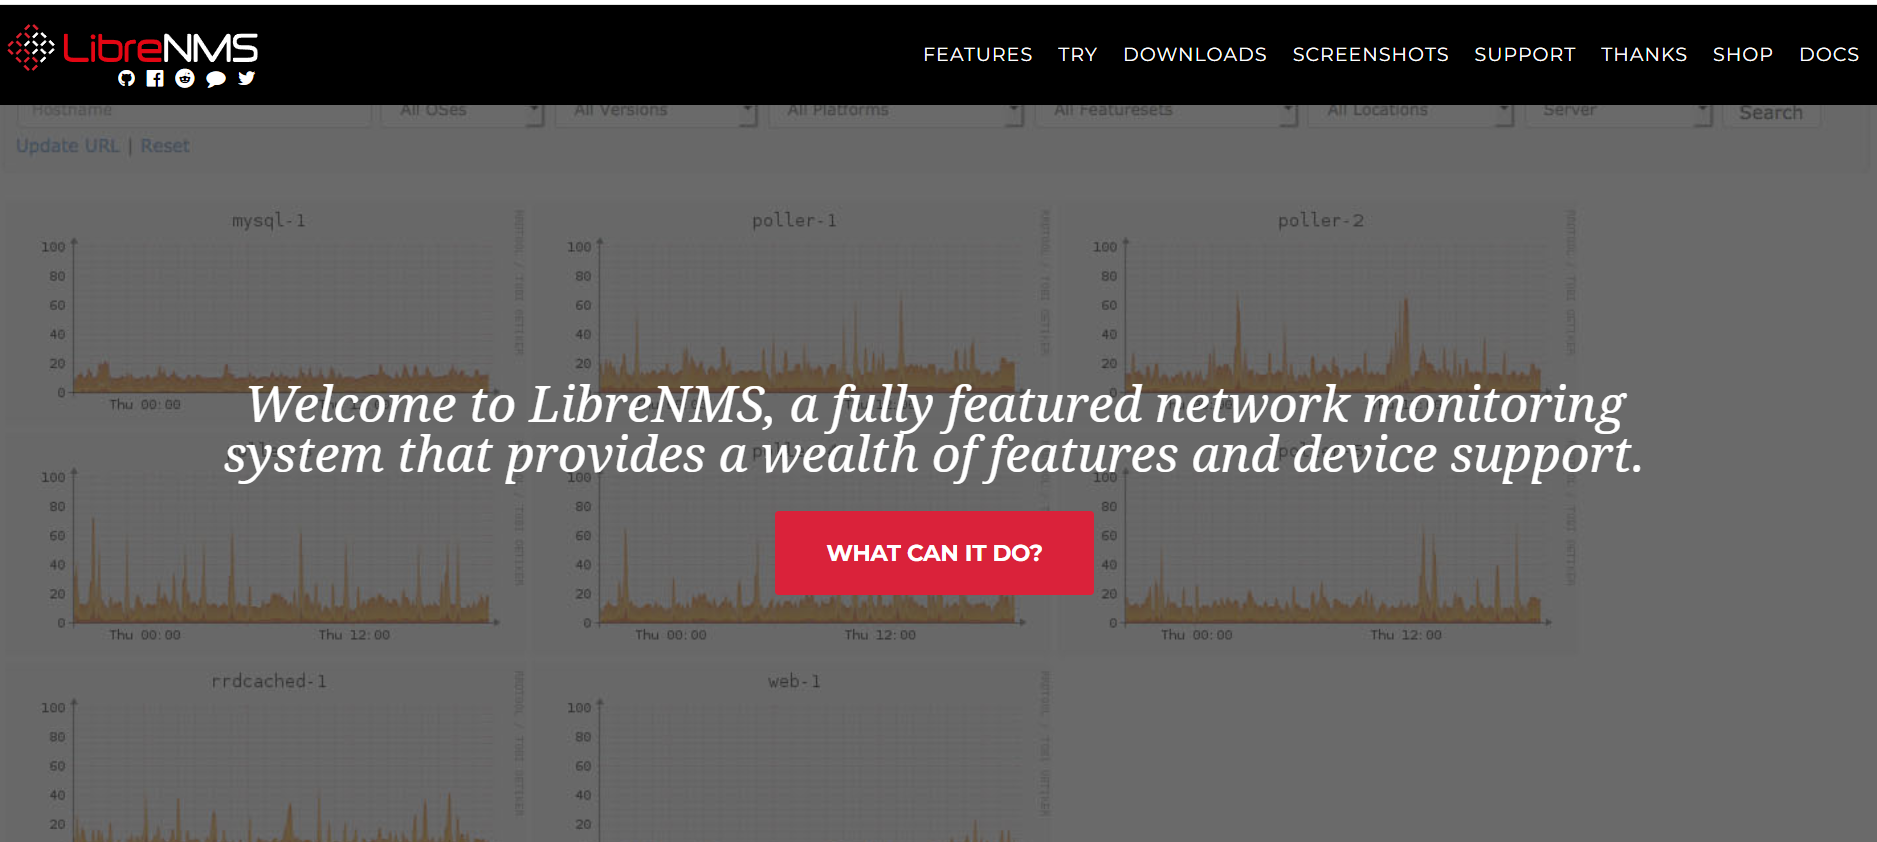
LibreNMS is a community-driven open source network monitoring system forked from Observium. It provides automatic discovery, alerting, and graphing for network devices with an active development community.
Key Features:
- Automatic discovery of network devices via SNMP, ARP, and CDP/LLDP
- Supports thousands of device types with automatic OS detection
- Flexible alerting with rules, transports (email, Slack, webhooks), and templates
- API for automation and integration with other tools
- Active community with regular updates and new features
Pricing: Free open source software. Infrastructure costs depend on deployment size. A 100-device deployment needs 2 vCPUs and 4 GB RAM, costing $25 to $50/month on cloud providers or running on existing hardware.
Pros:
- Free and actively maintained by a strong community
- Automatic discovery makes onboarding new devices fast
- Modern web interface compared to older open source tools
- API enables automation and custom integrations
Cons:
- Less mature than Zabbix or Nagios; fewer enterprise deployments
- Documentation can be sparse for advanced configurations
- Scaling to thousands of devices requires MySQL tuning
- Community support only; no commercial vendor backing
Best for: Teams who want a modern open source alternative to Nagios and Zabbix with automatic discovery and active community development.
How to Choose the Right Network Monitoring Tool
The right network monitoring tool depends on five factors: deployment model (SaaS vs self-hosted), protocol support for your devices, pricing structure that fits your budget, integration with existing observability tools, and team expertise.
Start with deployment model. If you have data residency requirements, work in regulated industries, or want to avoid SaaS egress fees, self-hosted options like CubeAPM, Zabbix, or PRTG make sense. Teams comfortable with SaaS and willing to send telemetry outside their infrastructure can consider Datadog or Auvik.
Match protocol support to your devices. Traditional network devices need SNMP monitoring. Cloud native environments benefit from flow data (NetFlow, sFlow, IPFIX). Mixed environments need both. Verify the tool supports your specific device vendors, Cisco, Juniper, HP, Dell, Aruba, and has pre-built templates or automatic discovery.
Understand the pricing model. Per device pricing (PRTG sensors, ManageEngine devices, SolarWinds elements) works well for stable environments but scales poorly during infrastructure growth. Per host SaaS pricing (Datadog) is predictable but expensive at scale. Ingestion-based pricing (CubeAPM) gives the most predictable costs for growing teams. Open source tools (Zabbix, Nagios, LibreNMS) have no licensing fees but require self-hosting infrastructure and staff time.
Evaluate integration needs. If you already use specific tools for infrastructure monitoring, APM, or logs, choose a network monitoring tool that integrates cleanly. CubeAPM unifies network, infrastructure, APM, and logs in one platform. Prometheus + Grafana fits well with Kubernetes stacks. Datadog NPM works best if you are already on Datadog.
Match complexity to team expertise. Open source tools like Zabbix and Nagios require Linux expertise and time investment for setup and maintenance. SaaS tools like Auvik and Datadog offer faster time to value but less control. Hybrid options like CubeAPM provide managed updates on self-hosted infrastructure.
For most teams, the decision comes down to control vs convenience. If data control, compliance, and cost predictability matter most, self-hosted tools win. If speed to deployment and vendor support matter most, SaaS tools win. For teams that want both, CubeAPM provides self-hosted deployment with vendor-managed updates and support.
Network monitoring tools have evolved from SNMP-based device polling to flow analysis, cloud native metrics, and unified observability platforms. The right tool depends on your infrastructure type, team expertise, and whether you prioritize control or convenience.
For teams managing traditional network devices, PRTG, Zabbix, and SolarWinds NPM provide deep SNMP support and mature features. For cloud native environments, Prometheus + Grafana or Datadog NPM fit better. For teams that want unified network, infrastructure, and application monitoring without SaaS data egress, CubeAPM offers the best combination of control and managed simplicity.
Disclaimer: The information in this article reflects the latest details available at the time of publication and may change as technologies and products evolve. Features, pricing, and plan limits can change over time. Always verify the latest information directly with the vendor before making purchasing or deployment decisions.
Frequently Asked Questions
Which tool is best for network monitoring?
The best network monitoring tool depends on your deployment model and infrastructure type. For self hosted unified monitoring, CubeAPM covers network, infrastructure, APM, and logs in one platform. For traditional network devices, Zabbix and PRTG provide deep SNMP support. For cloud native environments, Prometheus + Grafana or Datadog NPM work well.
What is better than Wireshark for network monitoring?
Wireshark is a packet analyzer for troubleshooting, not continuous network monitoring. For production monitoring, use tools like CubeAPM, Zabbix, or PRTG that provide real time dashboards, alerting, and historical trending. Wireshark complements these by providing deep packet inspection when troubleshooting specific issues.
Is Zabbix really free?
Yes, Zabbix is free open source software with no licensing fees. You pay only for infrastructure to run it and optional commercial support. A 200 device deployment typically needs $50 to $100/month in server costs. Zabbix LLC offers paid support starting at $1,200/year per 100 monitored devices.
What are the top monitoring tools?
The top network monitoring tools in 2026 are CubeAPM for unified self hosted monitoring, Zabbix for enterprise open source, PRTG for Windows environments, Nagios for traditional monitoring, SolarWinds NPM for large enterprises, Prometheus + Grafana for cloud native, Datadog NPM for multi cloud SaaS, and Auvik for MSPs.
How much does network monitoring cost?
Network monitoring costs range from free open source tools like Zabbix and LibreNMS (plus infrastructure costs) to $1,750+ for PRTG perpetual licenses, $245 to $8,995/year for ManageEngine OpManager, $1,000+/month for Datadog NPM, and $3,000+ for SolarWinds NPM. CubeAPM costs $0.20/GB ingestion – a 100-device deployment generating 500 GB/month costs $100/month.
Can I monitor network devices with Prometheus?
Yes, Prometheus can monitor network devices using the SNMP exporter. However, this requires additional setup compared to traditional network monitoring tools with native SNMP support. Prometheus works best for cloud native infrastructure and Kubernetes environments.
What protocols do network monitoring tools support?
Most network monitoring tools support SNMP for device monitoring. Advanced tools add NetFlow, sFlow, IPFIX, and J-Flow for traffic analysis. Enterprise tools like SolarWinds NPM and CubeAPM support all major protocols. Cloud native tools like Datadog NPM use cloud provider flow logs instead of traditional protocols.