Full-Stack Observability, inside your cloud
Managed APM, infra and logs with unlimited retention — fast & affordable.


Why Teams Choose CubeAPM
Most teams face a trade-off in observability — CubeAPM removes that compromise.
Cloud SaaS (Like Datadog)
✅ Fully managed
❌ Sends private data out
❌ Unpredictable cost
Self-Hosted (Like ELK)
✅ Keeps data local
❌ DIY: Heavy ops burden
❌ High cardinality pain

✅ Hosted inside your cloud
✅ Managed by CubeAPM
✅ Quick support
✅ Predictable pricing
✅ Unlimited retention
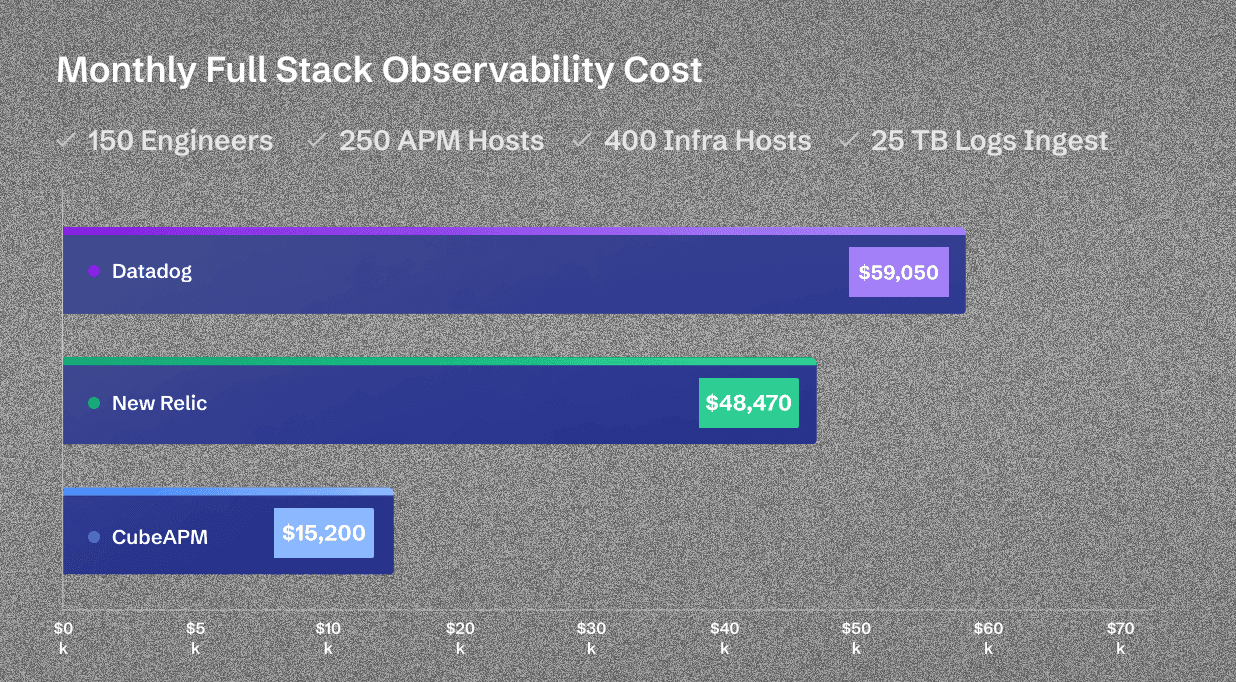
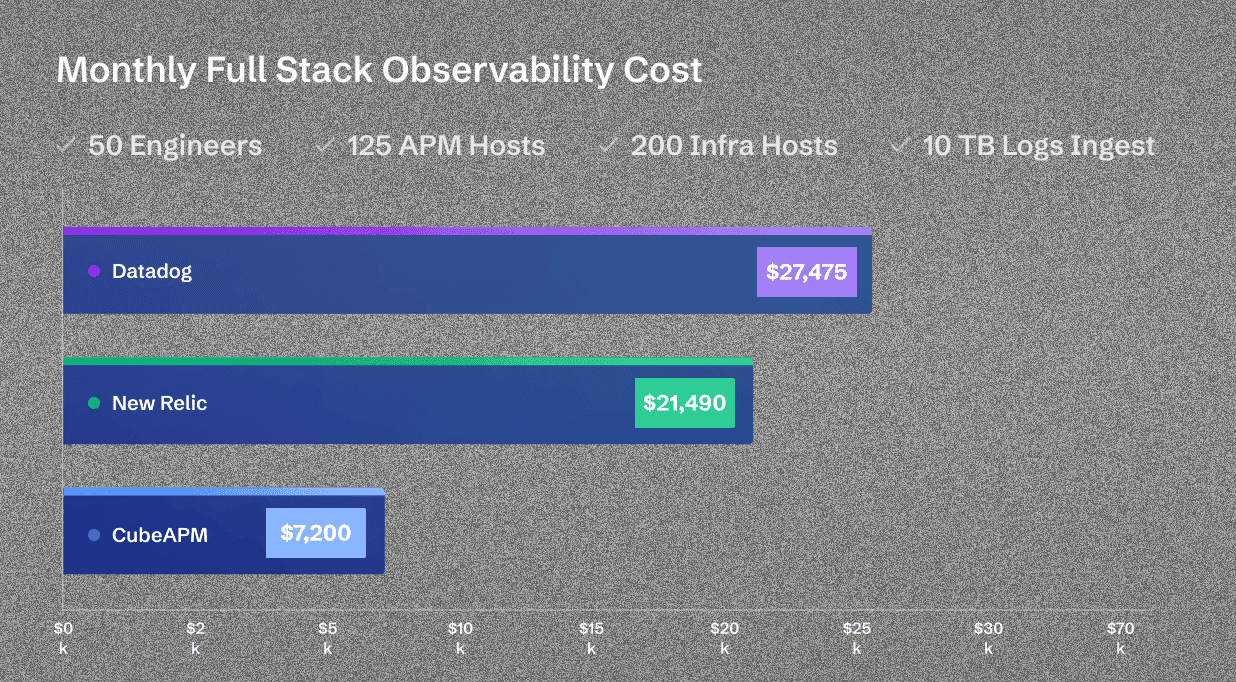
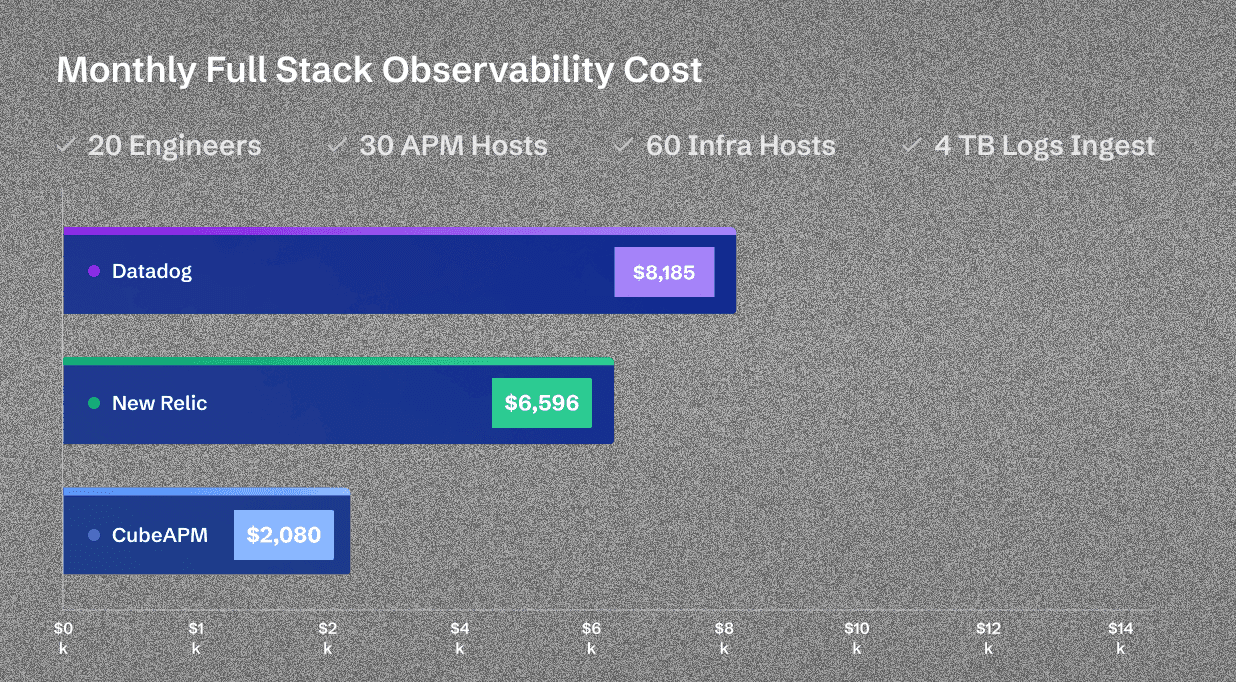
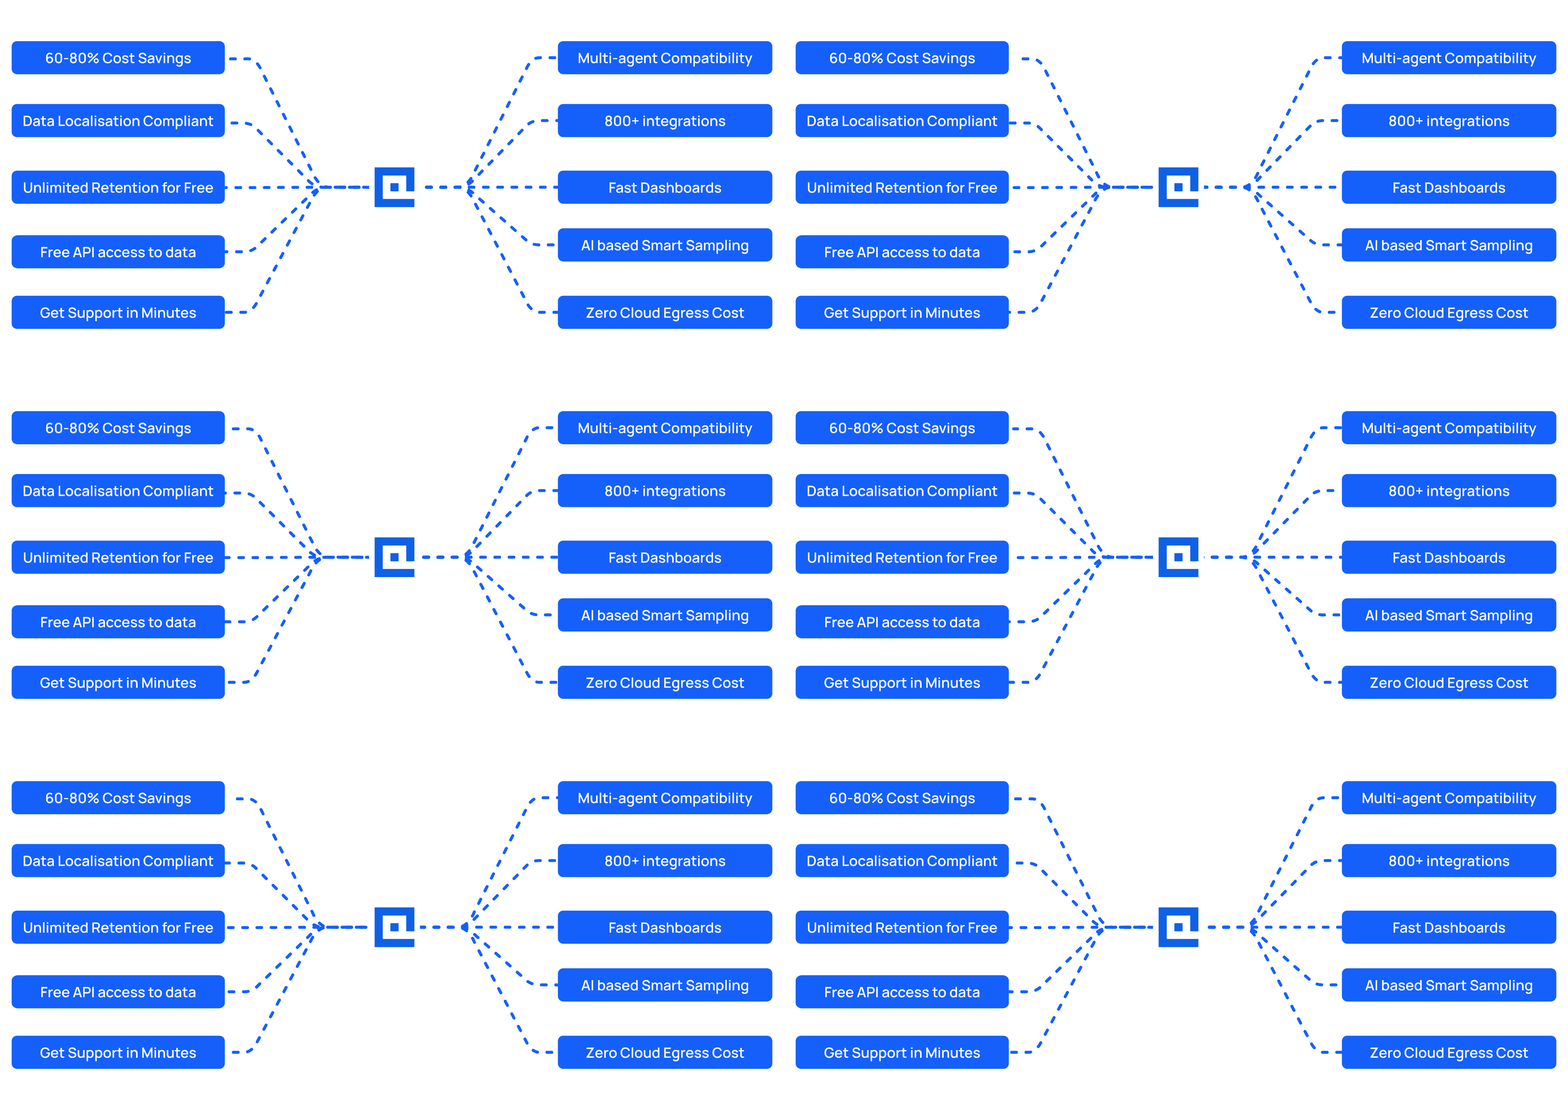
Get up to 5x the value with CubeAPM
Large Engineering Teams
Midsize Engineering Teams
Small Engineering Teams
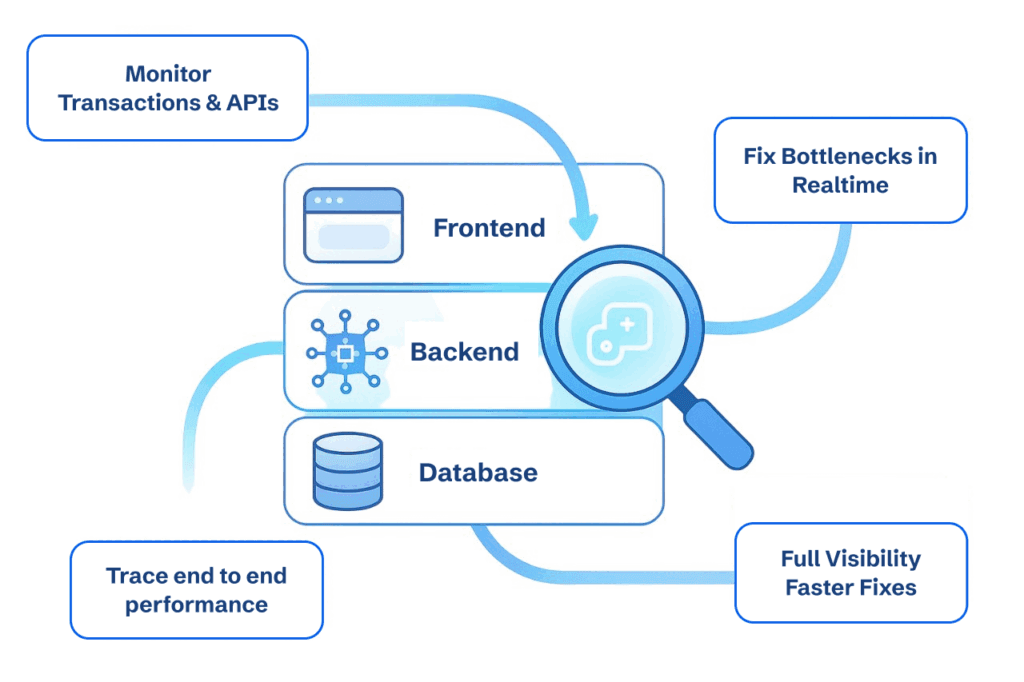
End-to-End Application Performance Monitoring
Monitor transactions, APIs, and services in real time with full visibility, faster troubleshooting, and reliable application performance.
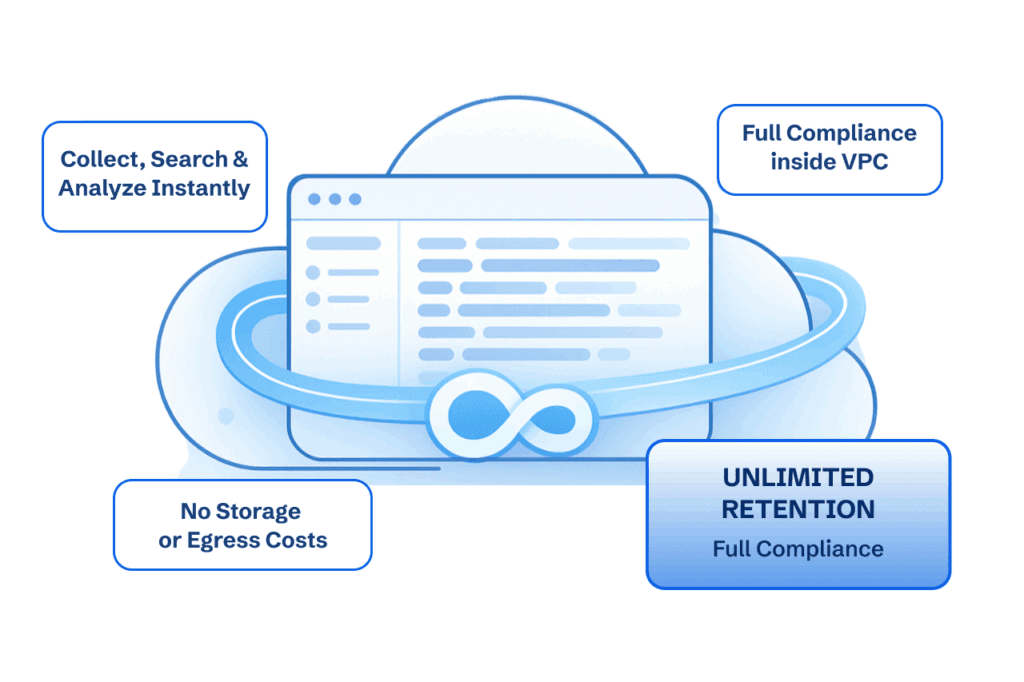
Log Management with Unlimited Retention
Collect, search, and analyze logs instantly — with unlimited retention and full compliance inside your VPC.
“Our decision to use Cubeapm for monitoring proved to be a good one. The on-prem deployment saves us the worry of data localisation compliance and makes data-out cost zero.”

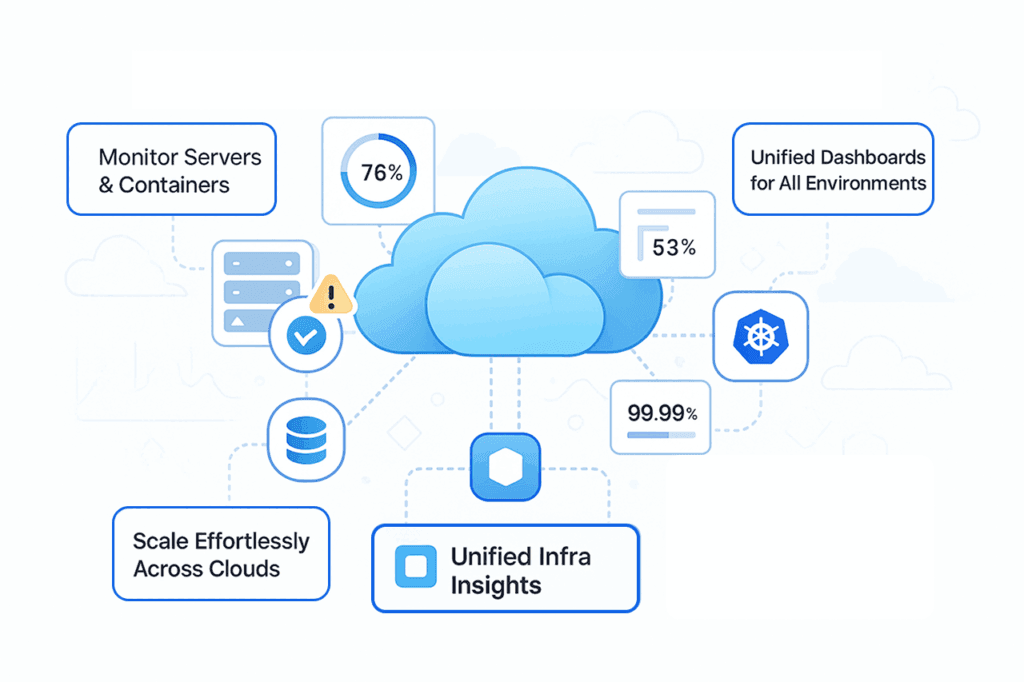
Cloud-Native Infrastructure Monitoring
Monitor servers, containers, and kubernetes clusters in real time with instant alerts, unified dashboards, and effortless scalability.
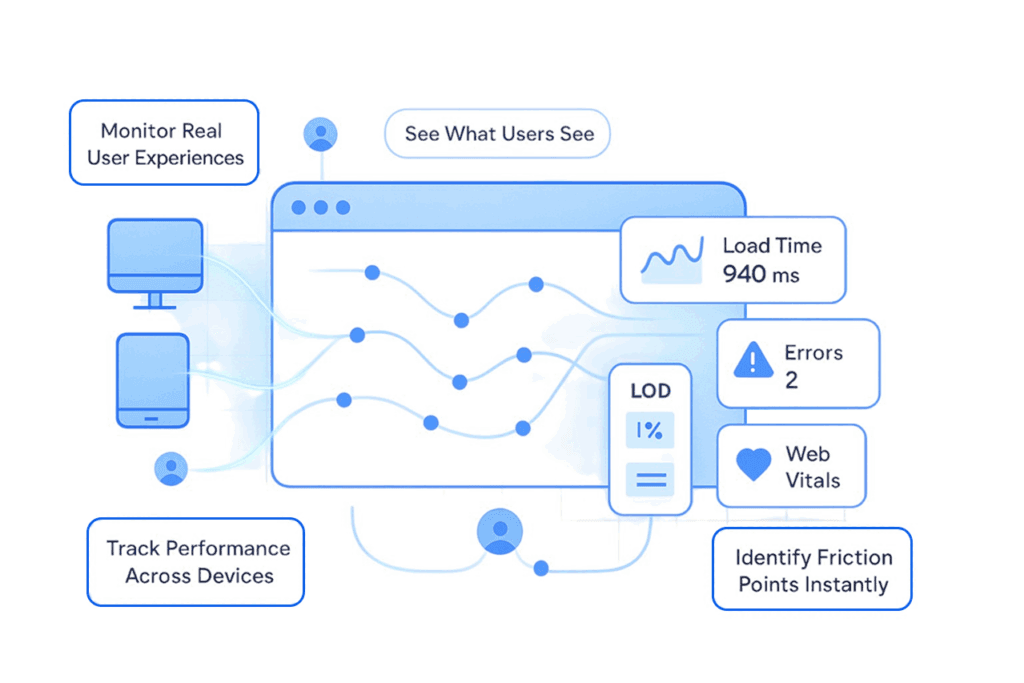
Real User Monitoring
See exactly what users experience — monitor load times, errors, and performance in real time across applications.

How CubeAPM reduced Delhivery’s Observability Costs by 75%
Delhivery achieved faster root-cause detection, unified observability across services, and 75% lower monitoring costs after switching from Datadog to CubeAPM
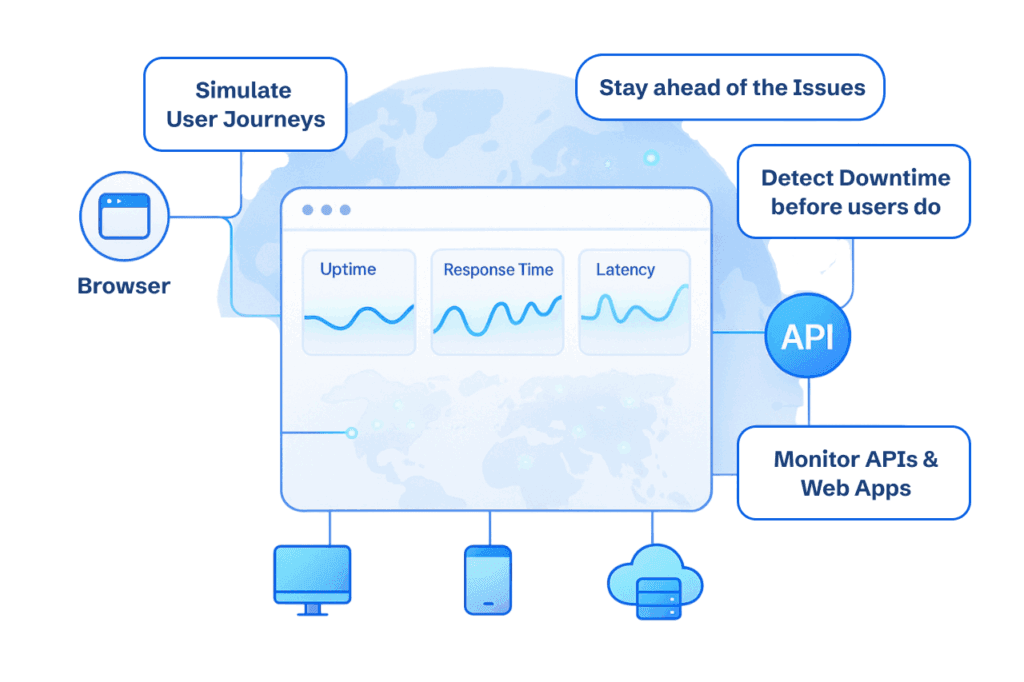
Synthetic Monitoring
Simulate user journeys with automated checks to detect downtime, latency, or errors before they impact real customers.
Intelligent Error Tracking
Track errors in real time with intelligent grouping and clear context, reducing alert fatigue and speeding up fixes.
Moving from New Relic to CubeAPM has been a game changer for us. The dashboards are astonishingly fast compared to New Relic. The migration process was also super smooth.

Why Choose CubeAPM?
Identify app performance issues quickly with ease of use, speed, and efficiency.
Audits & Certifications
CubeAPM adheres to industry-leading compliance standards, including SOC 2 and ISO 27001, ensuring your data remains secure, private, and audit-ready.
Zero Vendor Lock-In & Opentelemetry compatible
Frequently asked Questions
How is CubeAPM different from tools like Datadog or New Relic?
How much scale can CubeAPM handle?
Does CubeAPM support compliance requirements like SOC 2 or ISO?
What does “self-hosted but managed” mean?
How is CubeAPM Priced?
Can I retain data long-term?
How quickly can we migrate from existing tools to CubeAPM?
Most teams switch to CubeAPM in under 60 minutes. We support agents from New Relic, Datadog, OpenTelemetry, and more — so you can plug in without changing your instrumentation or workflows.


