










The Prometheus and Grafana stack has become the default open-source monitoring choice for Kubernetes and cloud native infrastructure. But the operational reality often diverges from the promise. Running Prometheus, Loki, Tempo, and Grafana at scale means managing four separate tools, each with its own query language (PromQL, LogQL, TraceQL), storage backend, and scaling limitations. Teams frequently discover this complexity only after the initial deployment, when the first scaling bottleneck appears or when cross-signal correlation becomes a manual exercise in switching tabs.
Beyond operational overhead, cost becomes a problem at scale. A 100-node Kubernetes cluster auto-scaling to 200 during peak traffic doubles infrastructure costs for Prometheus and triples storage requirements for Loki, often without warning. AWS egress fees add approximately $0.10 per GB when sending metrics to external SaaS platforms, a line item many teams only notice after the first full month of production traffic.
This guide compares 9 alternatives across open source platforms, unified SaaS tools, and self-hosted solutions. Each is evaluated on total cost of ownership, operational complexity, query language consistency, and signal unification (metrics, logs, traces in one platform). If you are currently running Prometheus and Grafana and want to understand what operational overhead looks like at your scale before committing to an alternative, start with understanding what each tool actually requires to run in production.
What Is the Prometheus Grafana Stack and Why Teams Seek Alternatives
The Prometheus Grafana stack refers to a collection of open-source tools deployed together to achieve full stack observability. Prometheus collects and stores metrics with a pull-based model. Loki aggregates logs. Tempo handles distributed tracing. Grafana provides the visualization layer that queries all three backends and renders dashboards.
This architecture works well for small clusters and proof-of-concept deployments. Problems surface at scale and in production environments where uptime and cross-signal visibility become critical.
The Four Core Problems Driving Teams to Alternatives
Multi-tool operational burden: Each component requires separate deployment, configuration, scaling strategy, and upgrade cycle. A single Kubernetes cluster monitoring stack often means managing 12+ separate deployments (Prometheus server, Alertmanager, Pushgateway, Loki distributor, ingester, querier, compactor, Tempo distributor, ingester, querier, compactor, Grafana).
Query language fragmentation: Debugging a single incident requires switching between PromQL for metrics, LogQL for logs, and TraceQL for traces. Each has different syntax, capabilities, and mental models. Engineers report spending more time translating between query languages than analyzing the actual problem.
High cardinality limitations: Loki explicitly discourages high cardinality labels. The Grafana Loki documentation warns against indexing fields like user IDs, request IDs, or session tokens. Production systems frequently need exactly these dimensions to debug real user issues. Teams hit this limitation after deployment, not during evaluation.
Scaling complexity and cost: Prometheus stores all data locally by default. Long-term storage requires Thanos or Cortex, adding another layer of operational complexity. Loki storage costs scale linearly with log volume. A Reddit user documented their Loki bill increasing from $400 to $3,200 monthly as log volume grew from 500GB to 2TB, with no change in retention policy.
What Drives the Search for Alternatives
Engineering teams typically start evaluating alternatives when they hit one of three thresholds: the operational team spends more than 20% of their time maintaining the monitoring stack itself, query performance degrades to the point where dashboards time out during incidents, or infrastructure costs for the monitoring stack exceed 15% of total cloud spend.
The search centers on three outcomes: reducing the number of tools to manage, unifying query syntax across all signals, and controlling costs as data volume grows.
Top 9 Prometheus Grafana Alternatives in 2026
1. CubeAPM

CubeAPM is a unified observability platform that replaces the entire Prometheus Grafana stack with a single self-hosted deployment. It runs inside your VPC or on-premises infrastructure, ingests metrics, logs, and traces through OpenTelemetry, and provides SQL-based querying across all signals.
Pricing: $0.20/GB ingested, unlimited users, unlimited retention. A 100-node Kubernetes cluster generating 20TB monthly (15TB logs, 3TB metrics, 2TB traces) costs $4,000/month. No separate fees for indexing, querying, or users.
Pros:
- Single platform replaces Prometheus, Loki, Tempo, and Grafana with one deployment
- SQL queries work across metrics, logs, and traces without learning PromQL, LogQL, or TraceQL
- Self-hosted deployment keeps all telemetry data inside your infrastructure with zero egress costs
- Native high cardinality support handles user IDs, request IDs, and session tokens without performance penalties
- Unlimited retention at flat cost eliminates storage tier decisions
- OpenTelemetry native from day one, compatible with Prometheus remote write for incremental migration
Cons:
- Requires infrastructure capacity for self-hosted deployment (CubeAPM manages the platform but you provide compute and storage)
- Smaller integration ecosystem compared to Grafana’s 200+ data source plugins
- Newer platform with community integrations still expanding
Best for: Teams that want unified observability without managing four separate tools, regulated industries requiring data residency, and organizations where monitoring costs are growing faster than infrastructure.
Migration path: CubeAPM supports Prometheus remote write, allowing incremental migration. Existing Prometheus instances continue running while CubeAPM ingests a copy of metrics. Once validated, Loki and Tempo send data via OpenTelemetry. Grafana dashboards can query CubeAPM as a data source during transition. Full migration typically completes in under two weeks for most Kubernetes environments.
For detailed deployment and migration guidance, see the infrastructure monitoring documentation.
2. VictoriaMetrics
VictoriaMetrics is a Prometheus-compatible time series database designed for high-performance metrics storage at scale. It uses less RAM and disk than Prometheus while supporting the same query language and remote write protocol.
Pricing: Open-source single-node deployment is free. VictoriaMetrics Cloud starts at $0.10/GB for metrics storage. A 100-node cluster generating 3TB of metrics monthly costs approximately $300/month for metrics only (logs and traces require separate tools).
Pros:
- Drop-in Prometheus replacement with full PromQL compatibility
- Significantly lower resource consumption (10x less RAM for same cardinality according to VictoriaMetrics benchmarks)
- Better compression reduces storage costs by 7x compared to Prometheus
- Handles high cardinality metrics that cause Prometheus to crash
Cons:
- Metrics only; requires separate tools for logs and traces (still managing multiple components)
- Advanced features (multi-tenancy, downsampling) require an enterprise license
- Smaller community and plugin ecosystem than Prometheus
Best for: Teams already invested in Prometheus who need better metrics performance but are not ready to replace their entire stack.
3. Mimir
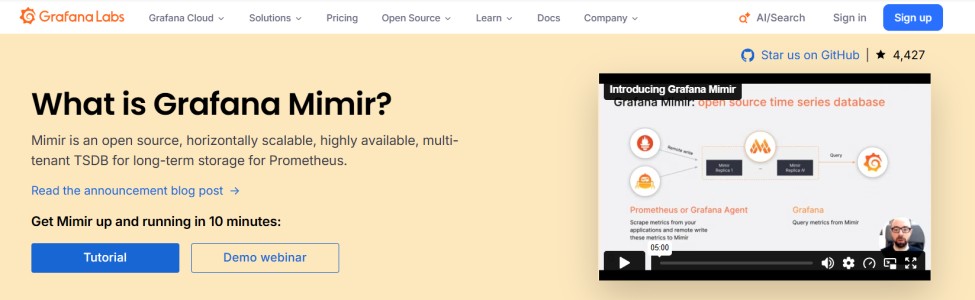
Grafana Mimir is a horizontally scalable Prometheus-compatible metrics backend designed for multi-tenant environments. It provides long-term storage for Prometheus without requiring Thanos.
Pricing: Open source. Grafana Cloud Metrics (Mimir backend) pricing starts at $0.30 per 1000 active series. A cluster with 500,000 active series costs approximately $150/month for metrics storage alone.
Pros:
- Native Grafana integration with Prometheus compatibility
- Horizontal scaling handles metric volumes that break single Prometheus instances
- Multi-tenancy support for platform teams serving multiple product teams
Cons:
- Requires significant operational expertise to deploy and scale correctly
- Metrics only; still requires Loki and Tempo for full-stack observability
- Complex architecture (distributor, ingester, querier, compactor, store gateway components)
Best for: Large organizations already standardized on Grafana who need scalable Prometheus storage and have dedicated platform engineering teams.
4. Thanos
Thanos extends Prometheus with long-term storage, global querying across multiple Prometheus instances, and downsampling for reduced storage costs. It is designed for organizations running Prometheus at scale across multiple clusters.
Pricing: Open source. Infrastructure costs vary significantly based on the object storage provider. S3 storage for 1 year retention of 3TB monthly metrics costs approximately $450/month. Thanos components (sidecar, store, query, compactor) add compute costs estimated at $200 to $400/month depending on scale.
Pros:
- Solves Prometheus long-term storage and cross-cluster querying without replacing existing Prometheus deployments
- Downsampling reduces storage costs for historical data
- Active community and broad production adoption
Cons:
- Adds architectural complexity on top of already complex Prometheus deployments (6+ new components)
- Query performance degrades with long time ranges spanning downsampled and raw data
- Still requires Loki and Tempo for logs and traces
- Operational overhead increases rather than decreases
Best for: Organizations committed to Prometheus who need multi-cluster global querying and cannot migrate to a unified platform.
5. Datadog
Datadog is a comprehensive SaaS observability platform covering metrics, logs, traces, RUM, synthetics, and security monitoring in one vendor-managed service.
Pricing: Infrastructure monitoring starts at $15/host/month for a 5-host minimum. APM costs $31/host/month. Log management charges $0.10/GB ingested plus $1.70 per million log events indexed. A 100-node cluster with 20TB monthly telemetry costs approximately $8,500/month ($1,500 infrastructure + $3,100 APM + $2,000 log ingestion + $1,900 log indexing).
This estimate models a production deployment with standard retention. Actual costs vary based on host count, active metrics, log indexing ratio, and trace sampling rate. Enterprise contracts may include volume discounts.
Pros:
- Zero operational overhead, fully managed SaaS
- 700+ integrations cover nearly every infrastructure component and cloud service
- Unified query language across all telemetry signals
- Advanced APM features including profiling and security monitoring
Cons:
- Costs scale unpredictably with traffic, not linearly with infrastructure
- Per-host pricing means auto-scaling infrastructure directly increases monitoring bill
- SaaS only, no option for on-premises deployment
- AWS egress fees add approximately $0.10/GB for data leaving your VPC (AWS data transfer pricing)
Best for: Enterprises prioritizing breadth of integrations and willing to pay premium pricing for fully managed service.
For detailed Datadog cost modeling including hidden fees, see the Datadog pricing calculator.
6. New Relic

New Relic provides cloud-based observability with metrics, logs, traces, and RUM in one platform. It uses a consumption based pricing model tied to data ingested and user seats.
Pricing: Standard plan costs $0.40/GB beyond the first 100GB free monthly plus $99/user/month for full platform access. A 100 node cluster with 20TB monthly costs approximately $8,050/month (20,000GB at $0.40/GB after free tier + $99 x 5 users).
This estimate assumes 5 full platform users and standard data ingestion. Actual costs vary based on data volume, user count, and feature usage.
Pros:
- Fully managed SaaS eliminates operational burden
- Strong RUM and synthetic monitoring capabilities
- Generous free tier for small teams (100GB monthly, 1 free user)
Cons:
- Per-user seat fees create a rationing dynamic where only senior engineers get full platform access
- NRQL query language creates lock-in; dashboards are not portable to other tools
- SaaS only deployment rules out data residency requirements
- Costs become unpredictable as data volume grows
Best for: Mid-market teams wanting managed observability with strong RUM capabilities and comfortable with per-user pricing.
For cost scenarios at different team sizes, see the best New Relic self-hosted alternatives.
7. Elastic Observability
Elastic Observability leverages the Elastic Stack (Elasticsearch, Logstash, Kibana) with added APM capabilities for metrics and traces. It offers both self-hosted and cloud-managed deployments.
Pricing: Self-hosted is free under the Elastic License. Elastic Cloud starts at $95/month for an 8GB RAM deployment. Production-scale deployments (100 nodes, 20TB monthly) require custom enterprise pricing, typically $6,000 to $10,000/month based on community-reported figures.
Pros:
- Powerful log search and analytics if already using ELK stack
- Self-hosted option provides data control
- Mature ecosystem for log management
Cons:
- Resource intensive, requires significant RAM and CPU at scale
- Complex to operate; most teams underestimate operational burden
- APM capabilities weaker than purpose-built tools
- Query performance degrades with high cardinality data
Best for: Organizations already running Elastic Stack who want to add metrics and traces without introducing new vendors.
8. Honeycomb
Honeycomb is an observability platform designed for high-cardinality debugging of distributed systems. It uses events as the core data primitive instead of separate metrics, logs, and traces.
Pricing: Free tier includes 20GB monthly. Pro plan starts at $130/month for 100GB, then $1.30/GB. A 100-node cluster with 20TB monthly costs approximately $26,000/month.
Pros:
- Handles high cardinality data that breaks traditional metrics systems
- Fast arbitrary dimension queries enable exploratory debugging
- Strong distributed tracing capabilities
- Event-based model unifies logs and traces naturally
Cons:
- Expensive at high data volumes compared to alternatives
- SaaS only, no self-hosted option
- Requires rethinking instrumentation patterns (events vs metrics)
- Smaller integration ecosystem than established vendors
Best for: Teams debugging complex distributed systems where high cardinality exploration justifies premium pricing.
9. SigNoz
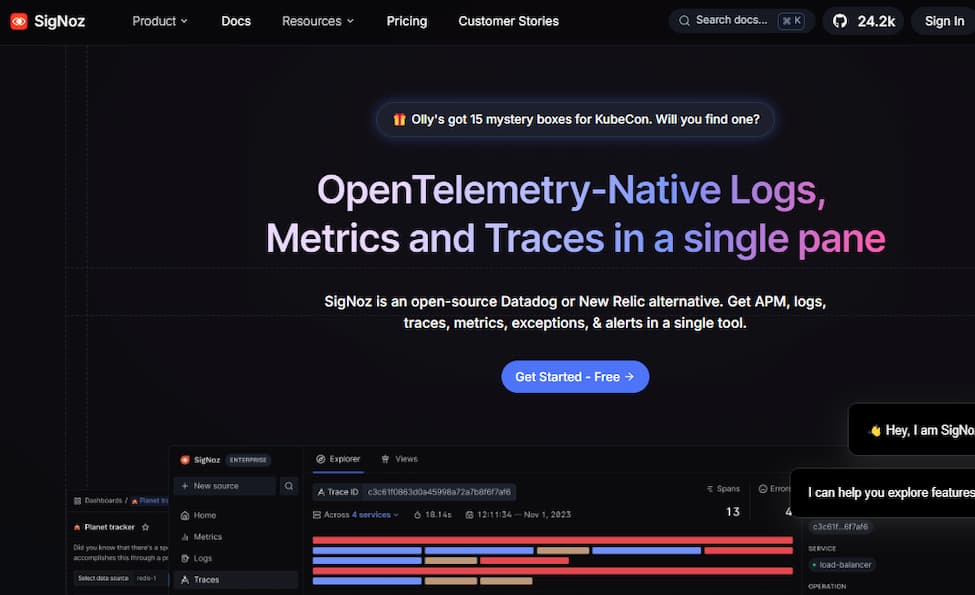
SigNoz is an open-source observability platform built natively on OpenTelemetry. It provides metrics, logs, and traces in one self-hosted deployment with a UI similar to Datadog.
Pricing: Open-source self-hosted is free. SigNoz Cloud starts at $0.30/GB with a $49/month minimum. A 100-node cluster with 20TB monthly costs approximately $6,000/month on SigNoz Cloud or approximately $1,200/month for infrastructure when self-hosted.
Pros:
- Open source with active community development
- OpenTelemetry native from inception, no vendor lock-in
- Self-hosted option provides data control
- Unified UI for all signals reduces context switching
Cons:
- Smaller feature set compared to commercial alternatives
- Self-hosted deployments require ClickHouse operational expertise
- Less mature integrations ecosystem
- Query performance can degrade with high cardinality
Best for: Teams committed to open source who want unified observability with OpenTelemetry and have expertise to self-host.
Prometheus Grafana Alternatives: Detailed Comparison Table
| Feature | CubeAPM | VictoriaMetrics | Mimir | Thanos | Datadog | New Relic | Elastic | Honeycomb | SigNoz |
|---|---|---|---|---|---|---|---|---|---|
| Deployment | Self-hosted managed | Self-hosted + cloud | Self-hosted + cloud | Self hosted | SaaS only | SaaS only | Both | SaaS only | Both |
| Pricing model | $0.20/GB all in | $0.10/GB metrics | $0.30/1K series | OSS + infra | Host + feature | $0.40/GB + seats | Custom | $1.30/GB | $0.30/GB cloud |
| Query language | SQL | PromQL | PromQL | PromQL | Proprietary | NRQL | KQL | Proprietary | ClickHouse SQL |
| Signals unified | Yes | Metrics only | Metrics only | Metrics only | Yes | Yes | Yes | Events model | Yes |
| High cardinality | Native support | Strong | Strong | Limited | Strong | Strong | Struggles | Excellent | Good |
| Data residency | Yes | Yes | Yes | Yes | No | No | Yes | No | Yes |
| OTel native | Yes | Partial | Partial | No | Partial | Partial | Partial | Yes | Yes |
| Est. monthly: 100 nodes, 20 TB | $4,000 | $300 metrics only | $2,500 metrics only | $800 OSS + infra | $8,500 | $8,050 | $8,000 | $26,000 | $6,000 |
Pricing estimates based on a 100-node cluster, 20TB monthly telemetry (15TB logs, 3TB metrics, 2TB traces), 30-day retention. Actual costs vary by exact usage patterns and vendor discounts.
How to Choose the Right Prometheus Grafana Alternative
Selecting an alternative depends on five factors: your operational capacity, budget constraints, data residency requirements, existing tooling investments, and team size.
Decision Framework
If operational simplicity is the priority: Choose a fully managed SaaS platform (Datadog, New Relic, Honeycomb) or a self-hosted managed platform (CubeAPM). Managed options eliminate the multi-tool burden but differ significantly in cost and data control.
If cost control is the priority: Compare total cost of ownership, not just headline pricing. Include infrastructure costs for self-hosted tools, egress fees for SaaS platforms sending data externally, and the operational team time required to maintain the stack. CubeAPM and VictoriaMetrics typically deliver the lowest TCO for high-volume environments.
If data residency is required: Eliminate SaaS only platforms. Remaining options are CubeAPM, VictoriaMetrics, Mimir, Thanos, Elastic self-hosted, and SigNoz self-hosted. Among these, CubeAPM and SigNoz provide unified signals while others require combining multiple tools.
If Prometheus compatibility is required: VictoriaMetrics, Mimir, and Thanos maintain full PromQL compatibility, enabling incremental migration. CubeAPM supports Prometheus remote write but uses SQL for querying, requiring dashboard migration.
If high cardinality is a blocker: Honeycomb and CubeAPM handle high cardinality natively without performance degradation. VictoriaMetrics and Mimir handle it better than Prometheus but with higher resource requirements.
Migration Complexity Assessment
Migration difficulty varies by alternative chosen and current deployment scale.
Lowest friction migrations: VictoriaMetrics (Prometheus drop-in replacement), Datadog (agent-based, gradual service rollout), CubeAPM (Prometheus remote write compatibility allows parallel operation).
Medium friction migrations: Mimir and Thanos (architectural changes but Prometheus compatible), SigNoz (requires OpenTelemetry instrumentation changes).
Highest friction migrations: Honeycomb (event model requires instrumentation rethinking), New Relic (proprietary agents and query language).
Migrating from Prometheus Grafana to a Unified Platform
Migration paths differ based on whether you choose a Prometheus-compatible alternative or move to a unified platform with different query semantics.
Migration to Prometheus-Compatible Alternatives (VictoriaMetrics, Mimir, Thanos)
Week 1: Deploy alternative in parallel with existing Prometheus using remote write. Both systems ingest identical data.
Week 2-3: Validate metric accuracy and query performance. Migrate non-critical dashboards and alerts.
Week 4: Migrate production alerts with dual alerting (both systems firing) for validation period.
Week 5-6: Complete Grafana data source migration, deprecate old Prometheus instances.
Migration to Unified Platforms (CubeAPM, Datadog, New Relic)
Week 1-2: Deploy agents/collectors to a subset of services (typically 10-20% of infrastructure). Validate data ingestion and basic queries.
Week 3-4: Instrument remaining services while existing Prometheus/Grafana continues operating. Both systems run in parallel.
Week 5-6: Migrate dashboards to new platform. SQL-based platforms (CubeAPM) require dashboard rebuilding; proprietary platforms (Datadog, New Relic) provide migration tools.
Week 7-8: Migrate alerts with a dual-firing period for validation.
Week 9+: Deprecate Prometheus, Loki, Tempo after 2-4 weeks of stable operation on new platform.
Most teams complete migration in 6 to 12 weeks depending on dashboard count and alert complexity. The parallel operation period is critical for validating that the new platform captures all necessary signals before decommissioning the old stack.
Disclaimer: The information in this article reflects the latest details available at the time of publication and may change as technologies and products evolve. Features, pricing, and plan limits can change over time. Always verify the latest information directly with the vendor before making purchasing or deployment decisions.
Frequently Asked Questions
What is the main difference between Prometheus Grafana and unified observability platforms?
Prometheus Grafana is a collection of separate tools (Prometheus for metrics, Loki for logs, Tempo for traces, Grafana for visualization) that you deploy and manage independently. Unified platforms like CubeAPM, Datadog, or New Relic combine metrics, logs, and traces in one system with consistent querying and no separate backends to manage.
Why do teams look for Prometheus Grafana alternatives?
The three main reasons are operational overhead from managing four separate tools, query language fragmentation requiring PromQL, LogQL, and TraceQL knowledge, and scaling costs as infrastructure grows. Teams typically start evaluating alternatives when operational maintenance exceeds 20% of team time or monitoring costs exceed 15% of cloud spend.
Can I migrate from Prometheus Grafana without downtime?
Yes, most alternatives support parallel operation during migration. Prometheus-compatible options like VictoriaMetrics use remote write to ingest data simultaneously. Unified platforms run agents alongside existing Prometheus exporters until validation completes. Typical migration takes 6 to 12 weeks with zero downtime.
What is the cheapest Prometheus Grafana alternative?
For metrics only, VictoriaMetrics delivers the lowest cost at approximately $0.10/GB. For unified observability including logs and traces, CubeAPM at $0.20/GB provides the lowest total cost of ownership when factoring infrastructure and operational time. Free open source options (Mimir, Thanos, SigNoz self-hosted) have lower licensing costs but higher operational overhead.
Do Prometheus Grafana alternatives support OpenTelemetry?
CubeAPM and SigNoz are built natively on OpenTelemetry with first-class support. Datadog, New Relic, and Elastic provide OpenTelemetry compatibility but with some limitations. VictoriaMetrics, Mimir, and Thanos focus on the Prometheus protocol and require OpenTelemetry Collector translation.
Which alternative is best for Kubernetes monitoring?
CubeAPM provides native Kubernetes visibility with pod, node, and cluster metrics without separate configuration. Datadog offers comprehensive Kubernetes monitoring but at a higher per-host cost. VictoriaMetrics works well for Kubernetes metrics if you keep Loki and Tempo for logs and traces. For detailed Kubernetes monitoring capabilities, see Kubernetes monitoring platforms.
Can I keep using Grafana with a Prometheus alternative?
Yes, Grafana can query most alternatives as data sources. VictoriaMetrics, Mimir, and Thanos work as drop-in Prometheus replacements. CubeAPM, Datadog, and New Relic provide Grafana data source plugins. However, using Grafana with these platforms means you do not benefit from their native visualization layers.