










Ask any team that has rolled out OpenTelemetry across a real production stack, and instrumentation strategy is where most of the pain lives. Not the collector config. Not the backend choice. The decision of what to auto-instrument and what to write by hand.
OpenTelemetry just proved it is not a passing trend. In May 2026, the CNCF graduated the project to its highest maturity level, backed by over 12,000 contributors from more than 2,800 companies. The question teams face today is not whether to adopt OpenTelemetry. It is how to instrument their systems with it.
That choice comes down to two paths. Auto-instrumentation gets you moving in minutes, using agents that intercept your code without touching it. Manual instrumentation asks you to write the spans yourself, trading speed for precision. Most teams eventually need both, but knowing when to reach for which one separates instrumentation that actually helps during an incident from instrumentation that just generates noise.
This guide walks through how each approach works, where each one breaks down, and how experienced platform teams combine them without drowning in maintenance work.
Auto-Instrumentation vs Manual Instrumentation: What Are They?
What Is Auto-Instrumentation?
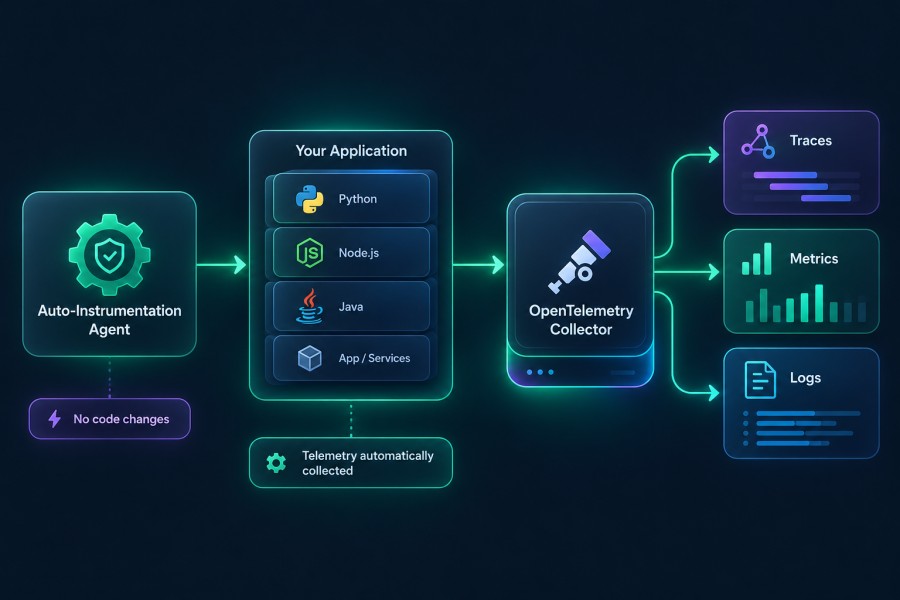
Auto-instrumentation adds observability to your application without you touching the application code. An agent or a language-specific tool hooks into your runtime, intercepts calls to known libraries and frameworks, and generates spans automatically. It works by recognizing patterns, not by understanding what your application actually does.
Picture a Java service running Spring Boot. Attach the OpenTelemetry Java agent at startup, and it starts producing spans for every incoming HTTP request and every outgoing database call, without a single line of code changed in your service. The agent knows what a Spring MVC controller looks like and what a JDBC call looks like. It has no idea what your business is trying to accomplish inside either one.
What Is Manual Instrumentation?
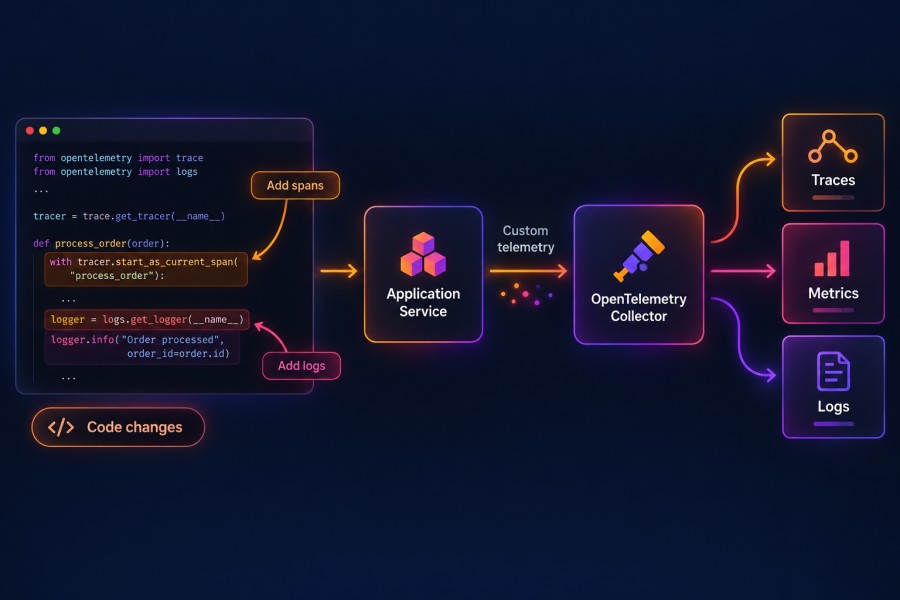
Manual instrumentation means you write the instrumentation yourself, using the OpenTelemetry SDK directly inside your code. You decide what counts as a span, what attributes to attach to it, and when to start and stop tracking it.
Take a checkout flow in an e-commerce service. You want to know how long inventory validation takes as its own step, separate from payment processing. Auto-instrumentation has no way to know that distinction matters to your business, since inventory validation and payment processing might both just look like function calls inside the same request. You write a span around that exact block of code, name it, and tag it with whatever context, like the SKU count or the warehouse region, helps you later.
Auto-Instrumentation vs Manual Instrumentation in OpenTelemetry: How They Work
How Auto-Instrumentation Works
The mechanism behind auto-instrumentation changes by language, but the goal stays the same. Generate spans without asking developers to write tracing code.
- Java uses an agent that performs bytecode manipulation at class load time. It rewrites method calls for supported libraries on the fly, injecting tracing logic directly into the compiled class before your application logic ever runs. This happens at the JVM level, through Java’s instrumentation API, so no application code changes and no rebuild is required.
- Python takes a zero-code approach. Running opentelemetry-instrument alongside your app patches known libraries at import time, wrapping their functions with tracing logic through monkey patching. Each supported library, like requests or Django, ships its own instrumentation package that the agent loads automatically.
- .NET and Node.js follow similar patterns to Python, patching known modules at startup rather than rewriting compiled code, though .NET can also use profiler-based instrumentation similar in spirit to Java’s bytecode approach.
- Kubernetes environments often use the OpenTelemetry Operator. It injects an instrumentation agent into your pods through a mutating admission webhook, typically as an init container, so auto-instrumentation applies at deployment time rather than inside your build. This decouples instrumentation from your CI pipeline entirely.
What you get out of the box covers the paths that follow well-known patterns. HTTP requests, database queries, message queue calls, and framework-level operations for supported libraries all get spans automatically, with no manual setup beyond attaching the agent. What you do not get is any awareness of what those calls mean to your business, or what happens once execution moves outside a library the agent recognizes.
How Manual Instrumentation Works
Manual instrumentation runs through the OpenTelemetry SDK and API, called directly from your application code. You create a tracer, start a span, attach whatever attributes matter, and close the span when the operation finishes. Nothing happens automatically. Every span exists because a developer decided it should.
This is where custom business logic gets visibility that auto-instrumentation cannot generate on its own. A span around a pricing calculation. An attribute recording which discount rule fired. A counter tracking how often a fallback path gets triggered. None of that exists inside a standard library, so no agent can find it automatically. Someone has to decide it matters and write it in.
Manual instrumentation also gives you direct control over context propagation, meaning you decide exactly how a trace ID carries across a function boundary, a queue message, or an async callback. That control matters most in places auto-instrumentation cannot reach on its own, which the next section covers in more detail.
The tradeoff is ownership. Every span you add is a span your team maintains. Refactor the code around it, and the instrumentation needs updating too.
Data Volume, Signal Quality, and Cost
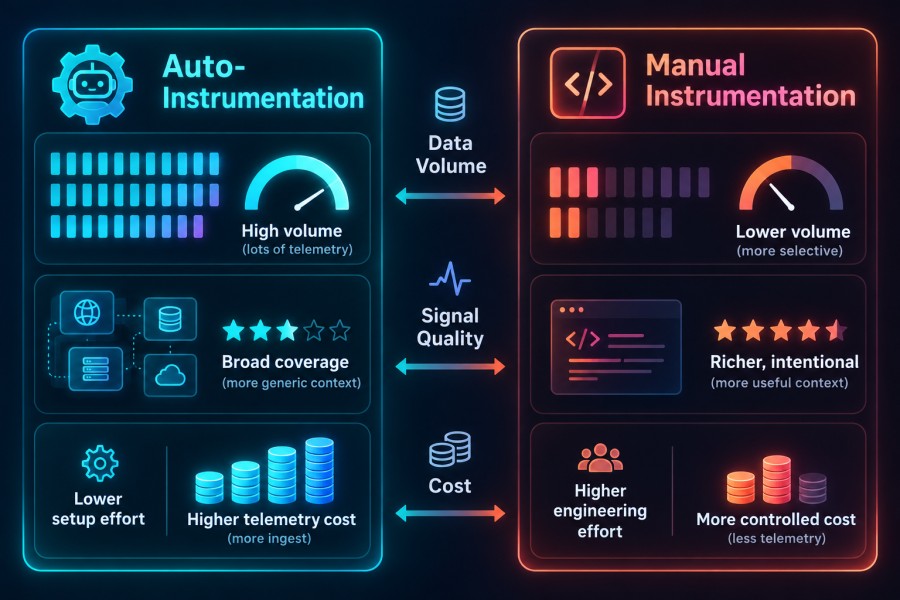
Auto-instrumentation solves the coverage problem, then quietly creates a cost problem. Because it instruments every call inside a supported library, not just the calls that matter, it tends to generate far more telemetry than a team actually needs.
One recent industry analysis found that OpenTelemetry auto-instrumentation can increase telemetry volume by 3 to 5 times compared to manually written tracing. That gap comes from how auto-instrumentation works. It cannot tell the difference between a span someone will query during an incident and a span nobody will ever look at.
How Auto-Instrumentation Affects Volume
A single HTTP request handled by a fully auto-instrumented service can commonly generate dozens of spans, since DNS lookups, TCP connection setup, TLS handshakes, internal health checks, and connection pool operations all get traced by default alongside the handful of spans that actually explain what happened. In practice, only a small fraction of that total, usually the HTTP server span, the database query, and a downstream service call, carries real debugging value.
This tradeoff shows up directly on the bill. Most observability backends price by data volume, whether that is per GB ingested or per span indexed. A service producing 5x more spans than necessary is not just harder to read during an incident. It is also paying 5x more to store noise.
How Manual Instrumentation Affects Volume
Manual instrumentation avoids this by construction. A developer writing a span by hand has no reason to trace a DNS lookup, because nobody asked for that visibility. The spans that exist are the spans someone decided were worth the cost of collecting, storing, and querying later. Volume stays close to what the team actually intended to measure, since nothing gets added without a deliberate decision to add it.
The tradeoff runs the other way here. Keeping volume low takes ongoing discipline, since every new code path needs someone to decide whether it deserves a span.
Keeping Auto-Instrumentation Volume Under Control
Teams that lean heavily on auto-instrumentation usually need to manage volume deliberately, rather than let it run unchecked. Common mitigations include:
- Disabling specific instrumentors: Most language SDKs let you turn off instrumentation for known-noisy libraries, like internal health checks or connection pooling, through environment variables or configuration.
- Filtering at the collector: The OpenTelemetry Collector’s filter and attribute processors can drop or trim spans before they ever reach a backend, based on span name, duration, or attribute values.
- Sampling deliberately: Tail-based sampling can keep all error traces while sampling only a small percentage of successful, low-signal requests, which controls volume without losing the traces that matter most during an incident.
None of this means auto-instrumentation is the wrong choice. It means the coverage it gives you by default is a starting point to tune, not a final state to leave running unmanaged.
Context Propagation: Where Traces Actually Break
A trace is only useful if it stays connected end to end. The moment a request crosses a boundary the tracing system does not understand, the trace splits, and what should have been one story about a request becomes two or three disconnected fragments.
Where Auto-Instrumentation Holds Up
Auto-instrumentation propagates context reliably across the boundaries it was built to recognize. Standard HTTP calls, common RPC frameworks, and well-supported messaging libraries all carry trace context forward automatically, because the instrumentation library knows exactly where to inject and extract the trace headers.
Where Auto-Instrumentation Breaks
That reliability stops at anything the agent was not built to recognize. Custom protocols, proprietary internal messaging formats, and background jobs picked up by a scheduler often do not carry trace context forward, because nothing tells the agent where to look for it. Async handoffs are a common failure point too. A request that hands off work to a thread pool, a background worker, or a queue consumer can lose its trace context at that exact handoff, even when both sides of the handoff are otherwise fully auto-instrumented.
The practical result is a trace that ends abruptly, right where a responder needs it most, usually at the point where a request left the main request path and entered async processing.
Where Manual Instrumentation Takes Over
Manual instrumentation is often the only reliable fix for these gaps. A developer who knows a job gets picked up by a custom queue consumer can explicitly extract the trace context from the message, inject it back into the new execution context, and continue the trace across that boundary. This is not something an agent can infer on its own, since it requires knowing the internal shape of a system that no public library describes.
Teams running background processing, custom protocols, or heavy async workloads should expect to need manual instrumentation specifically for context propagation, even if auto-instrumentation handles everything else in the request path well.
Testing and CI/CD: How Each Approach Gets Validated
Instrumentation that nobody tests tends to quietly break, and nobody notices until an incident shows up with gaps in the trace.
How Auto-Instrumentation Gets Validated
Auto-instrumentation is validated mostly at the pipeline level, not the code level. Since no application code changes, there is nothing for a developer to unit test directly. What matters instead is pinning the agent version, since a minor version bump can change which libraries get instrumented or how spans get named.
Most teams handle this by treating the agent version like any other dependency. It gets pinned in the build, bumped deliberately, and rolled out through the same CI pipeline as everything else, often with a staging environment check to confirm spans still look correct before a version change reaches production. Kubernetes environments using the OpenTelemetry Operator add another layer here, since the injected agent version is controlled centrally rather than per service, which makes upgrades easier to coordinate but also means a single operator update can affect every instrumented pod at once.
How Manual Instrumentation Gets Validated
Manual instrumentation gets tested the same way application code does, because it is application code. A span added around a pricing calculation lives in the same file, gets reviewed in the same pull request, and can be covered by the same test suite as the logic it wraps.
This is where manual instrumentation earns back some of the ownership cost it carries elsewhere. Teams that treat instrumentation as a first-class part of the codebase catch broken spans the same way they catch broken logic, through code review and CI, rather than discovering the gap during an incident. Teams that treat it as an afterthought tend to accumulate stale spans that no longer match the code around them, since nothing in a normal test suite forces a span’s attributes to stay accurate after a refactor.
The Practical Difference
Auto-instrumentation validation is a pipeline concern, focused on version control and staged rollout. Manual instrumentation validation is a code quality concern, folded into the same review and test process as everything else a team ships. Teams running both need both disciplines in place, since a broken agent upgrade and a stale manual span fail in different ways and get caught by different processes.
Strengths and Limitations at a Glance
| Dimension | Auto-instrumentation | Manual instrumentation |
| Setup time | Minutes, attach an agent and go | Hours to days, written span by span |
| Library coverage | Broad for popular frameworks and libraries | Limited to what you explicitly write |
| Custom business context | Cannot capture it | Built for exactly this |
| Data volume | 3 to 5x higher, includes low-value spans | Stays close to what is intentionally measured |
| Context propagation | Reliable across supported libraries only | Can be extended to any custom boundary |
| Validation approach | Pipeline concern, agent version pinning and staged rollout | Code quality concern, covered by review and test suites |
| Maintenance burden | Low, updates ship with agent versions | Ongoing, tied to every code change |
| Performance overhead | Slightly higher in some runtimes | Typically lower, since you control what gets traced |
| Portability across backends | High, output is standard OTLP | High, output is standard OTLP |
Neither column wins outright. Auto-instrumentation gets you visibility fast and keeps working as libraries update. Manual instrumentation gets you the detail that actually explains why something broke, at the cost of someone owning that code and its tests long term.
Choosing an Approach: The Hybrid Pattern Most Teams Land On
Most production teams do not pick one approach and stop there. They start broad with auto-instrumentation, then layer in manual spans where the business actually needs the detail, and where context propagation actually breaks.
Where Most Teams Start
That starting point covers more ground than most teams expect. The OpenTelemetry Java agent alone ships with over 240 built-in auto-instrumentations, spanning frameworks, drivers, and messaging libraries. For a team standing up observability from scratch, that single agent can cover most of a typical service without a single manual span, at least for the paths that follow standard patterns.
What auto-instrumentation cannot cover is your custom code. Internal frameworks, proprietary business logic, and anything that does not sit on top of a known library stay invisible until someone writes a span for it.
How the Right Mix Shifts With Team Maturity
The right mix is not static. It shifts as a team’s systems and organization mature.
- Early-stage teams get the most value from auto-instrumentation first. Coverage matters more than precision when nothing is instrumented yet, and the fastest path to a working trace is attaching an agent and moving on.
- Growing platform teams start feeling gaps once services multiply. This is usually when context propagation breaks in async workers or custom queues become visible for the first time, since nobody built manual spans to bridge those boundaries early on.
- Mature platform teams running dozens or hundreds of services usually settle into a deliberate split. Auto-instrumentation stays on by default for every new service, while manual spans get added specifically around the handful of business-critical paths that decide whether an incident gets resolved in minutes or hours.
- Teams built on custom internal frameworks lean manual by necessity, since no public agent knows what an internal framework does. This is common in larger enterprises with homegrown RPC layers or internal service meshes built before OpenTelemetry existed.
- Performance-sensitive paths often call for manual instrumentation too, since it lets a team control exactly what gets traced instead of accepting whatever the agent decides matters, which also keeps volume and cost predictable in the highest-traffic parts of a system.
Instrumentation Strategy and Backend Choice Stay Separate
One thing stays constant across every stage of that maturity curve. Instrumentation output, whether it comes from an agent or from code a developer wrote, lands on the wire as standard OTLP. The backend receiving that data does not need to know which method produced it. That is the whole point of the standard. Teams can start with an agent, add manual spans over time, and switch backends without touching instrumentation at all.
CubeAPM, as one example of an OpenTelemetry-native backend, ingests OTLP data the same way regardless of whether it came from an auto-instrumented agent or hand-written spans, which keeps the instrumentation decision separate from the backend decision.
Best Practices for an Instrumentation Strategy
- Start with auto-instrumentation, always: It gets baseline visibility running in minutes, and there is no reason to write spans by hand for paths an agent already covers well.
- Reserve manual spans for business-critical logic: Add them where a failure actually costs money or time, not everywhere code runs.
- Name spans for the business event, not the function: A span called checkout.validate_inventory tells a responder more during an incident than a span called doValidation.
- Keep attribute cardinality in check: Avoid attaching values like raw user IDs or full request bodies to span attributes, since that inflates cost and slows queries later.
- Version instrumentation alongside application code: Treat manual spans as part of the codebase, reviewed and updated in the same pull request as the logic they wrap.
- Audit agent coverage periodically: New libraries get added to auto-instrumentation agents regularly, and teams that never revisit their agent version miss coverage they are already paying for.
- Standardize semantic conventions across teams: Use OpenTelemetry’s semantic conventions for span and attribute names, so traces from different services stay consistent enough to correlate during an incident.
Conclusion
Auto-instrumentation and manual instrumentation solve different problems. Auto-instrumentation gets a system observable in minutes and keeps working as libraries evolve. Manual instrumentation captures the business context an agent cannot infer.
The teams that get real value from OpenTelemetry start broad with auto-instrumentation, then add manual spans deliberately around the paths that decide how fast an incident gets resolved. What gets traced, and how well it explains a failure, decides whether that data helps during an outage or just sits in a dashboard.
Once instrumentation is in place, the next decision is where that OTLP data lands. CubeAPM ingests OpenTelemetry data natively, whether it comes from an auto-instrumented agent or hand-written spans, with flat per-GB pricing and no per-host or per-user fees. Teams evaluating a self-hosted, OTel-native backend can see how it fits their setup at cubeapm.com.
Frequently Asked Questions (FAQs)
Is auto-instrumentation enough on its own?
For basic visibility, often yes. For understanding business-critical failures, no. Auto-instrumentation covers standard library calls well, but it cannot capture custom logic or business context that only manual spans provide.
Does auto-instrumentation slow down applications?
The overhead is small for most services, typically low single-digit percentages in CPU or latency. It can matter more in performance-sensitive paths, which is often a reason to switch those specific paths to manual instrumentation.
Can you combine both approaches in the same service?
Yes, and most production teams do. Auto-instrumentation handles the standard paths, while manual spans get added around the business logic that needs closer tracking.
How does the OpenTelemetry Operator handle auto-instrumentation in Kubernetes?
It injects an instrumentation agent into pods through a sidecar or init container at deployment time, so auto-instrumentation gets applied without changing the application image or build process.
Which languages support OpenTelemetry auto-instrumentation?
Java, Python, .NET, and Node.js all support runtime auto-instrumentation, where an agent patches or intercepts code as the application starts, with no rebuild required. Go works differently, since it compiles to a static binary with no runtime to hook into. Go auto-instrumentation instead relies on eBPF-based tooling or a separate compile-time instrumentation approach that reached its first stable release only recently. Teams on Go should expect a different setup process than teams on Java or Python.
Disclaimer: Statistics, product details, and version information referenced in this article reflect publicly available sources as of July 2026 and may change. Verify current details on the official OpenTelemetry documentation before making implementation decisions.