










The CNCF Annual Survey found that 82% of organizations using containers now run Kubernetes in production, up sharply from prior years. That adoption curve changes what monitoring has to do.
A cluster is not one system to watch. It is a control plane, a fleet of nodes, a constantly shifting set of pods, and the applications running inside those pods, each with its own failure modes and its own metrics.
- Pods now live for minutes, not months.
- Autoscalers resize node pools and replica counts on their own, often several times an hour.
- Every namespace, label, and service adds new dimensions to your metrics, which means higher cardinality, irrespective of the traffic.
Traditional monitoring assumes a stable target: a named server you can watch build a history over weeks. Kubernetes breaks that assumption at the infrastructure level. A pod-based architecture demands telemetry that keeps up with churn, correlates across metrics, logs, and traces, and still holds up when the topology looks completely different from one hour to the next.
This guide covers what platform engineers actually need to watch across every layer, which metrics carry real signal, and how to keep cost and cardinality under control as the cluster scales.
What Is Kubernetes Monitoring?
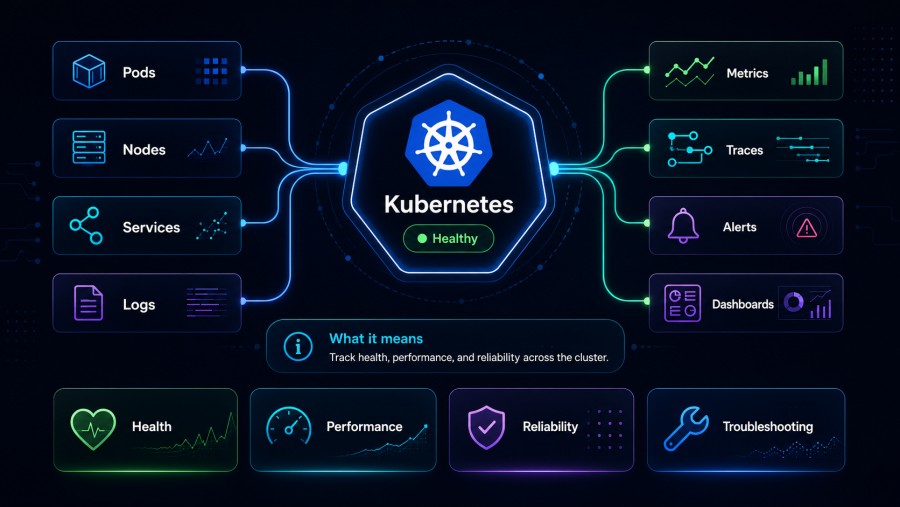
Kubernetes monitoring is the practice of collecting metrics, logs, traces, and events across every layer of a cluster, then using that data to judge cluster health, workload performance, and application reliability.
For teams already running Kubernetes, the real work is in the layering. A cluster has four distinct surfaces that all need separate visibility:
- Control plane: The API server, etcd, scheduler, and controller manager. These can degrade quietly while every pod still shows as running.
- Nodes: The machines running your workloads. CPU, memory, and disk pressure here decide whether pods get scheduled at all.
- Workloads: Pods, deployments, and replica sets. This is where restarts, evictions, and resource mismatches show up.
- Applications: The services running inside those pods. Latency and error rate live here, and this is what users actually feel.
Traditional monitoring treats a server as one long-lived unit. Kubernetes breaks that unit into four moving layers, and a gap in any one of them hides a different class of failure.
Why Kubernetes Monitoring Is Uniquely Hard
Kubernetes does not fail the way a server does. Anyone who has run production clusters for a few years knows the Kubernetes failure modes are different, and the monitoring has to be different too.
Workloads live for minutes, not months
A traditional server sticks around. You give it a name, you watch it, you know its history. A Kubernetes pod does not offer that luxury. Deployments roll pods constantly, autoscalers spin them up and tear them down within minutes, and self-healing controllers replace failed pods before a human even notices.
Host-based monitoring assumes a stable, named target that exists long enough to build a baseline. In Kubernetes, most of what you are watching will not exist an hour from now. If your monitoring stack cannot handle short-lived, constantly changing targets, it will miss most of what actually happens in the cluster.
Cardinality grows faster than most teams expect
Every pod, namespace, and label adds a new combination to your metrics. A service with ten pods and five labels can generate thousands of unique time series without anyone intending it. Multiply that across hundreds of services and the number gets large fast.
This is not a theoretical problem. Cardinality growth is one of the most common reasons Kubernetes monitoring bills spiral out of control, and it is also why queries that ran fine six months ago start timing out. Platform teams that do not actively manage cardinality end up paying for data nobody queries.
The control plane and the workloads fail independently
Etcd can be healthy while pods crash-loop across half the cluster. The scheduler can be under pressure while every running pod looks fine on the surface. These two layers, the control plane and the workloads sitting on top of it, do not share a single health signal.
A platform engineer who only watches pod status can miss a degrading API server for hours, because pods keep running until the moment they do not. Watching both layers separately catches problems earlier and makes root cause analysis much faster during an incident.
Autoscalers reshape the cluster while you are asleep
The Horizontal Pod Autoscaler, Vertical Pod Autoscaler, and Cluster Autoscaler all change the shape of your infrastructure continuously. Node counts shift. Pod counts shift. Resource allocations shift. None of this needs a human to approve it.
Dashboards and alert thresholds built around a fixed node count or a fixed pod count go stale within days. What looked like healthy utilization last week can look completely different this week, not because anything broke, but because the cluster resized itself in response to load.
None of this makes Kubernetes harder to run well. It means the monitoring strategy has to treat constant change as the normal state, not an edge case to handle later.
The Kubernetes Monitoring Stack: What to Observe
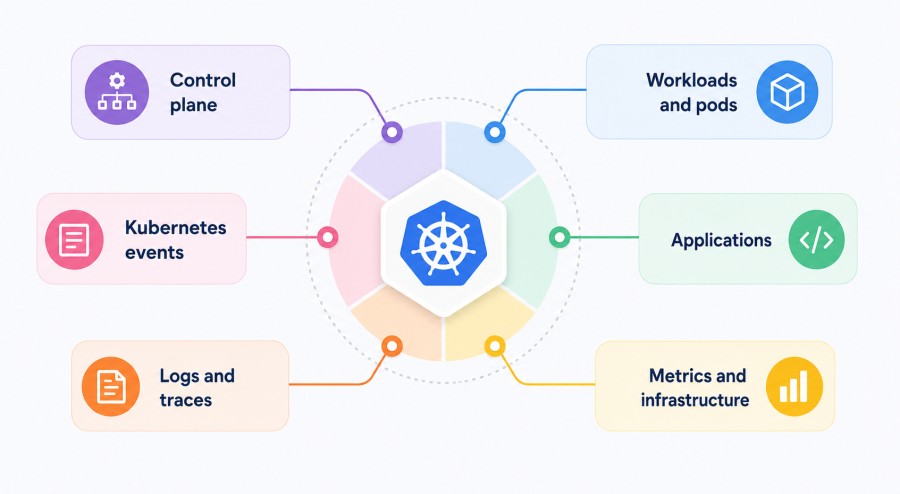
A complete monitoring strategy covers seven surfaces. Skip one, and you get a blind spot that shows up during an incident, not before it.
Control plane
The control plane is the nervous system of the cluster. If it degrades, everything downstream feels it eventually, even if pods look fine right now.
Watch these:
- API server request latency and error rate
- Etcd disk write latency
- Scheduler and controller manager queue depth
A slow API server does not crash anything immediately. It just makes every action in the cluster, from deployments to autoscaling, quietly slower until someone notices.
Nodes
Nodes are where resource pressure actually lives. Most scheduling failures and pod evictions trace back to a node running out of headroom.
Watch these:
- CPU, memory, and disk utilization per node
- Disk pressure and memory pressure conditions
- Kubelet health
A node under memory pressure will start evicting pods to protect itself. If you are not watching node-level pressure directly, the first sign of trouble is often a pod disappearing.
Workloads and pods
This is where the gap between what you asked for and what you are actually getting becomes visible.
Watch these:
- Pod restarts and OOMKilled events
- CrashLoopBackOff states
- Actual resource usage against configured requests and limits
That last point matters more than most teams treat it. A pod requesting 2 CPU but using 200m is wasting cluster capacity. A pod with no limits set can starve its neighbors. Comparing requests to actual usage is what tells you workloads are sized correctly, not just running.
Applications
Infrastructure metrics tell you the cluster is healthy. They do not tell you whether users are having a good experience. That is what application metrics are for.
Watch these using the RED method:
- Rate: how many requests are coming in
- Errors: how many are failing
- Duration: how long they take
Teams that monitor Kubernetes without application-level metrics end up with a green dashboard during a real outage, because nothing at the infrastructure layer looked wrong.
Kubernetes events
Events are often the earliest warning you get, arriving before a problem shows up in any metric.
Watch these:
- Scheduling failures
- Image pull errors
- Evictions and admission controller rejections
A pod stuck in a pending state for ten minutes will not move a single metric. The event stream is where you would see it happening in real time.
Logs and traces
- Metrics tell you something is wrong.
- Logs and traces tell you why.
Centralized logs, container output, node logs, and audit logs give you the detail to trace a problem back to its cause. Distributed tracing follows a single request across every service it touches, which matters more in Kubernetes than almost anywhere else, since a single request might cross five or six pods before it finishes.
The practical habit that pays off here is consistency. Use the same labels and trace identifiers across metrics, logs, and traces from the start. Adding that consistency after the fact takes far more work than building it in during initial rollout.
Kubernetes-Native Monitoring Building Blocks
Before comparing full platforms, it helps to know what most Kubernetes monitoring setups are actually built on underneath.
Metrics tooling
- Metrics server exposes CPU and memory usage through the Kubernetes Metrics API. It exists mainly to feed the Horizontal Pod Autoscaler, not to power dashboards.
- Kube-state-metrics converts the state of Kubernetes objects into metrics. This is the difference between knowing a pod is using CPU and knowing a deployment is under-replicated. Most cluster health dashboards rely on this data, not on resource usage alone.
- Cadvisor sits inside the kubelet and reports per-container resource usage at the source. It is the earliest layer where container metrics originate before anything else scrapes them.
- Prometheus remains the de facto standard for collecting all of this. It pulls metrics on a schedule, discovers targets automatically as pods come and go, and PromQL is what most Kubernetes alerting rules and dashboards are written against, regardless of which backend stores the data.
Logs and traces tooling
- Loki indexes only metadata rather than full text, which keeps storage costs down and pairs naturally with the same labels Prometheus already uses.
- Fluent Bit and Fluentd typically run as a DaemonSet, shipping container logs off every node as they are written.
- Jaeger and Tempo store and query distributed traces, usually fed by OpenTelemetry or Jaeger client instrumentation.
The unifying layer
OpenTelemetry has become the standard that ties all of this together. Its Collector receives metrics, logs, and traces once, then routes them to whichever backend you choose. That matters more than it sounds. Standardizing on OpenTelemetry keeps your instrumentation portable, so switching backends later does not mean re-instrumenting every service from scratch.
Choosing a Kubernetes Monitoring Approach
Most platform teams land on one of four approaches. None of them is universally right. The correct choice of Kubernetes monitoring tools depends on team size, operational capacity, and how predictable you need your monitoring bill to be.
| Approach | Examples | Best for | Tradeoff |
| Self-managed OSS stack | Prometheus, Grafana, Loki, Tempo | Teams with strong platform engineering capacity who want full control | You own scaling, storage, and upgrades |
| Commercial SaaS | Datadog, New Relic, Dynatrace | Teams that want broad coverage out of the box | Per-host pricing can scale unpredictably as clusters autoscale |
| Managed Prometheus | Grafana Cloud, cloud provider managed options | Teams that want PromQL without running the storage layer | Still largely metrics-first, logs and traces often need separate tools |
| Self-hosted, OTel-native | CubeAPM, SigNoz | Teams that want data control with predictable, usage-based pricing | Requires hosting the platform yourself |
Within the self-hosted, OTel-native category, CubeAPM is worth noting for Kubernetes-heavy environments. It ingests standard OpenTelemetry data natively, without a proprietary agent, and it prices ingestion per GB, with no separate per-host, per-user, or per-series charges. That pricing model matters most for platforms where pod count and cardinality grow faster than headcount, since teams are not penalized for instrumenting more.
As with any tool, weigh it against Datadog or SigNoz using your own scale, compliance needs, and team capacity.
Alerting and SLOs for Platform Teams
Alerting in Kubernetes works best when it targets symptoms, not causes, and routes to the team that owns the service.
Alert on what users feel first
Start with latency and error rate. These tell you something is actually wrong for someone. Drill into infrastructure metrics afterward to find the cause. Alerting on every individual infrastructure metric buries the signal that matters under noise nobody has time to read.
Use burn rate alerts, not static thresholds
A single latency spike that resolves itself in ten seconds should not page anyone. Multi-window, multiple burn-rate alerting checks error budget consumption across different time windows before it fires, which filters out blips that fix themselves.
Keep a baseline set of Kubernetes alert rules
A few rules catch most real problems early:
- CrashLoopBackOff on any workload
- Node stuck in a NotReady state
- PersistentVolumeClaim nearing capacity
- HPA sustained at maximum replicas for an extended period
Define SLOs per service
Pick a Service Level Indicator that reflects what users actually care about, set a target, and track the error budget against it. This turns reliability work into something you can prioritize with data, instead of a debate based on gut feeling during a postmortem.
Cost Management and Observability Tool Sprawl
Cost is where most Kubernetes monitoring strategies quietly fail over time, long after the initial setup looked fine.
Tool sprawl adds up faster than teams notice
A CNCF survey reported by APMdigest found that 72% of teams run as many as nine separate observability tools, and over a fifth run between ten and fifteen.
Each tool brings its own bill, its own retention policy, and its own context switch during an incident. The costs compound rather than simply add up.
Cardinality drives the bill more than cluster size
Every namespace, pod, and label combination multiplies the number of active time series. A cluster with twice as many nodes does not necessarily cost twice as much to monitor. A cluster with sloppy labeling practices often costs far more, regardless of size.
Practices that keep cost under control
- Set retention tiers deliberately. Keep high-resolution data for recent windows and downsample older data for trend analysis.
- Audit label cardinality regularly. Avoid attaching high cardinality values, like raw user IDs, directly to metric labels.
- Consolidate tools where coverage overlaps instead of adding a new one for every new use case.
- Compare pricing models directly. Per-host pricing punishes autoscaling. Flat per-GB pricing scales with actual data volume instead.
Best Practices for Platform Engineers
These are the habits that separate teams who catch problems early from teams who find out during an outage.
- Instrument with OpenTelemetry from day one: Retrofitting instrumentation later means touching every service again, while standardizing early keeps a backend change from turning into a re-instrumentation project.
- Separate control plane dashboards from workload dashboards: Mixing the two hides which layer is actually degrading, and a slow API server needs a different response than a crash-looping pod.
- Set resource requests and limits, then monitor actual usage against them: A pod with no limits can starve its neighbors, and a pod with limits nobody checks can waste capacity for months without anyone noticing.
- Keep labels and trace context consistent across metrics, logs, and traces: When identifiers match everywhere, moving between them during an incident takes seconds instead of guesswork.
- Build dashboards around golden signals, not around tools: Organizing by service, latency, errors, and saturation is more useful during an incident than organizing by which product collected the data.
- Route alerts by service ownership: An alert that pages the wrong team gets ignored eventually, so tagging alerts with ownership gets them to someone who can act.
- Review tool sprawl and retention costs on a schedule: Waiting for the bill to spike means the waste already happened, and a quarterly review catches it earlier.
A Practical Example: When Cardinality Outgrows the Budget
Picture a platform team running Kubernetes across 40 nodes, with autoscalers adding and removing pods hundreds of times a day. Their metrics volume was never the problem. The label sprawl was, since every new microservice added its own set of labels.
The problem
Within a year, their time series count had grown far faster than their cluster had. Their monitoring bill followed the same curve, because it was priced per host. Autoscaling meant paying more not because traffic grew, but because the cluster kept resizing itself. Every new service they instrumented added cost, so instrumentation coverage started lagging behind actual deployment, which is exactly the outcome cost pressure should not create.
The solution
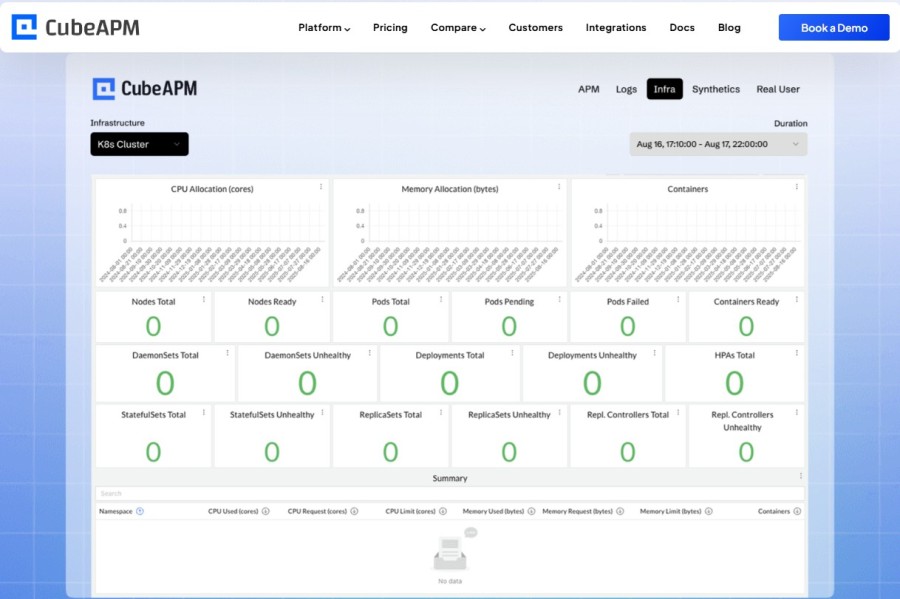
This is the specific problem a self-hosted, OpenTelemetry-native platform is built to solve. CubeAPM is one example. Because it ingests OpenTelemetry data natively, the team did not need to rip out existing instrumentation or add a proprietary agent to every pod. Because it is self-hosted, the data stayed inside their own infrastructure, which mattered for their compliance requirements. And because pricing is per GB of data ingested, with no per-host or per-series charges, their bill stopped moving every time the cluster autoscaled.
The result was not a magic fix. It was a pricing and architecture model that matched how their cluster actually behaved, so instrumenting more services became a decision based on value, not a cost tradeoff. That is the kind of fit worth testing for any team feeling the same squeeze between cardinality growth and monitoring spend. More detail on setup is in the CubeAPM docs.
Conclusion
Kubernetes monitoring is not a tool decision. It is an architecture decision that spans the control plane, nodes, workloads, applications, and the cost structure sitting underneath all of it.
As Kubernetes adoption approaches saturation across production environments, the teams that stay ahead are the ones treating every layer as equally important, not just the layer that is easiest to watch. Consistent instrumentation, symptom-based alerting, and disciplined cost management matter more than which logo sits on the dashboard.
Whether that means running Prometheus and Grafana, a commercial SaaS platform, or a self-hosted, OpenTelemetry-native option, the principles in this guide hold regardless of what sits underneath. Get the architecture right first, and the tool choice becomes a much easier decision.
Disclaimer: Pricing, features, and product details referenced in this article reflect publicly available information as of July 2026 and may change. Verify current details on the vendor’s official website before making a purchasing decision.
FAQs
What is the best tool for Kubernetes monitoring?
It depends on team size and priorities. Prometheus and Grafana remain the standard for open source metrics. Datadog and New Relic offer broad coverage out of the box. Self-hosted, OpenTelemetry-native platforms like CubeAPM fit teams that want control and predictable pricing.
Is Prometheus enough for Kubernetes monitoring?
Not on its own. Prometheus handles metrics well but does not natively cover logs or traces. Most teams pair it with a tool like Loki for logs and Tempo or Jaeger for traces.
What is the difference between monitoring and observability?
Monitoring watches known metrics for expected problems. Observability lets you investigate unknown failure modes by correlating metrics, logs, and traces together, which matters more as cluster topology keeps changing.
How do you monitor the Kubernetes control plane?
Track API server latency and error rate, etcd disk write latency, and scheduler queue depth. These are exposed as standard metrics regardless of which backend you use.
What are the Kubernetes golden signals?
Latency, traffic, errors, and saturation. They apply to individual services through the RED method and to cluster resources like nodes and the control plane.
Should you self-host or use a SaaS platform?
Self-hosting gives full control over data and cost structure but needs operational capacity to run it. SaaS platforms reduce that overhead but shift cost and data control to the vendor. The right call depends on team size and compliance needs.