










Every engineering team eventually confronts the same instrumentation decision: standardize on a vendor’s proprietary agent, tied to that vendor’s SDK, dashboards, and query language, or adopt an open, vendor-neutral standard that works with any backend.
The tradeoff rarely surfaces during initial rollout. It surfaces later, when a renewal invoice spikes, a vendor gets acquired, or a product gets sunset, and switching backends turns out to mean re-instrumenting the entire fleet by hand, because the old agent’s data never spoke a format anything else could read.
OpenTelemetry exists to remove that dependency. It decouples telemetry collection from the backend that stores and analyzes it, so a vendor decision stops being a multi-month re-instrumentation project. Adoption already reflects that shift. OTel’s production adoption jumped from 6 percent in 2025 to 11 percent in 2026, while teams experimenting with it grew from 31 to 36 percent over the same period, according to Elastic’s report.
This guide breaks down OpenTelemetry vs proprietary agents in practical terms, what actually changes under the hood, why teams migrate, and the complete migration path from inventory to cutover.
OpenTelemetry vs Proprietary Agents: What Actually Changes
How proprietary agents work
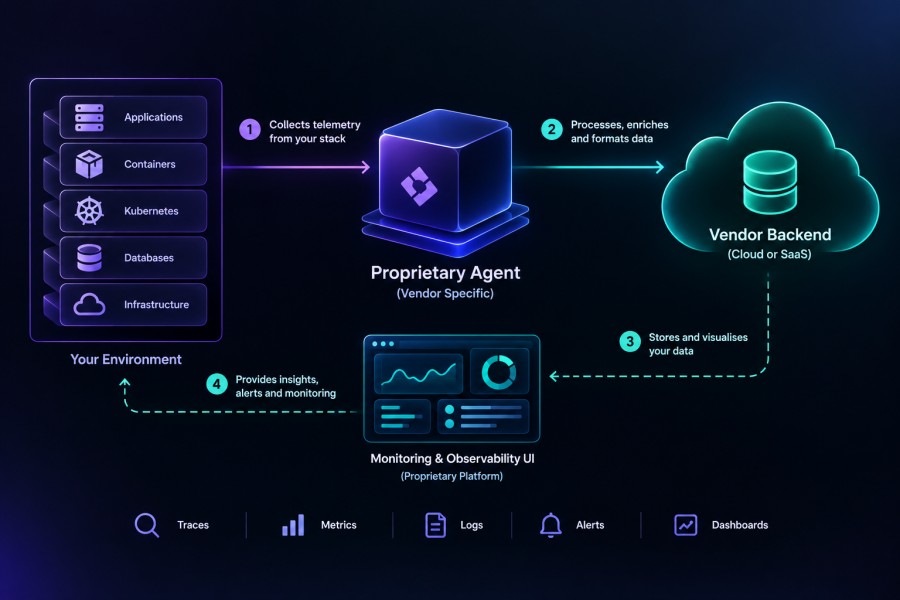
A proprietary agent installs at the host or application level and handles instrumentation on the vendor’s terms. It auto-discovers processes, injects tracing logic, and ships everything straight to that vendor’s backend.
- The SDK and the backend are the same product, built to work together and nothing else
- Auto-instrumentation is often genuinely strong, since the vendor controls both ends of the pipeline
- Span attributes, query languages, and dashboard logic are all proprietary: DQL for Dynatrace, NRQL for New Relic, and so on
- None of that data translates cleanly to a different backend without a conversion layer built specifically for it
How OpenTelemetry works
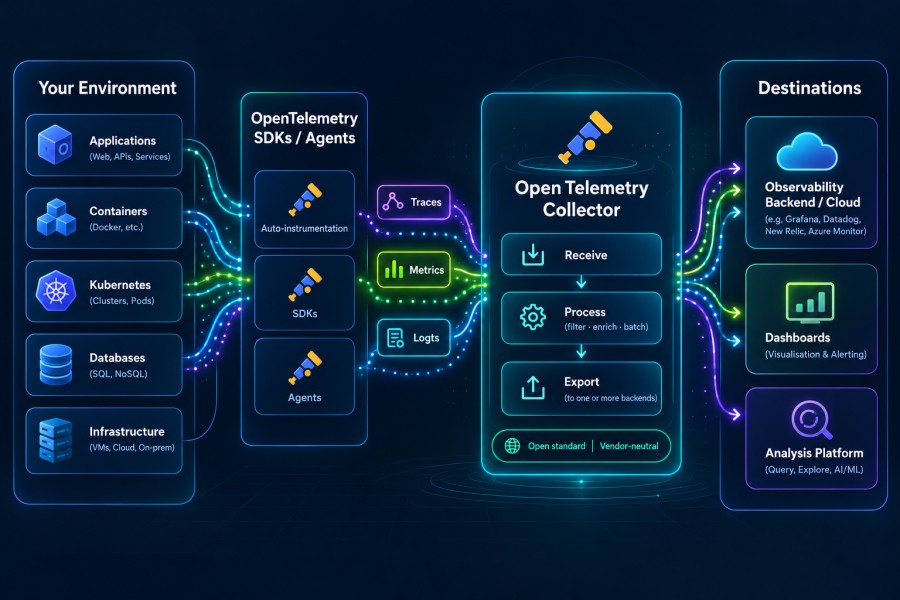
OpenTelemetry splits instrumentation from storage entirely. Applications emit telemetry through a vendor-neutral SDK, and a Collector routes that data to whichever backend the team chooses, today or a year from now.
- OTLP is the shared protocol every OTel component speaks, regardless of vendor
- Semantic conventions standardize attribute names across services, instead of each vendor inventing its own
- Backends can be swapped by changing an exporter configuration, not by touching application code
- The Collector can enrich, filter, or route telemetry centrally, work that used to live inside a proprietary agent
The tradeoff nobody skips past
Proprietary agents still win on convenience. Zero config auto-discovery, mature instrumentation for niche frameworks, and a single vendor to call when something breaks are real advantages that OTel does not fully replicate yet.
There are situations where staying on a proprietary agent is the right call.
- A 10-service architecture with modest telemetry volume rarely justifies a migration; the engineering time spent re-instrumenting will outweigh anything saved on the bill.
- A team that relies heavily on a vendor’s proprietary analysis, like Dynatrace’s automated root cause detection or a real user monitoring feature with no OTel equivalent yet, may find the proprietary agent’s built-in intelligence genuinely irreplaceable for now.
Migrating in those cases trades a working advantage for portability the team may never end up needing. What OTel wins, when the tradeoff does favor it, is durability. Instrument once, and the next backend decision becomes a configuration change. For a team planning to run the same stack for a year, that difference barely registers. For a team that has already lived through one forced migration, or is staring at a hundred-plus services and a growing observability bill, it is the entire point.
Why Do Teams Migrate From OTel to Proprietary Agents?
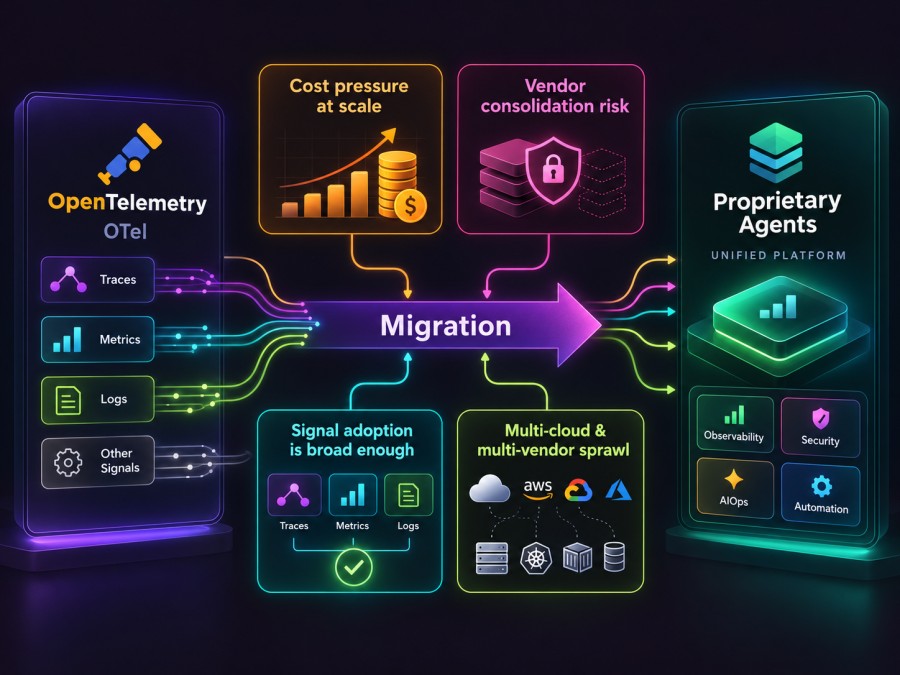
Cost pressure at scale
Telemetry volume rarely grows in a straight line. A team that budgeted for steady growth often finds itself paying for a step change instead, once a new service ships or traffic spikes during a launch. Proprietary agent pricing typically scales with that volume directly, per host, per GB, or per custom metric, which means the bill grows exactly as fast as the system does.
Teams feel this most acutely during budget season, when finance asks why observability spend doubled and the honest answer is that nobody modeled what happens past a certain scale.
Vendor consolidation risk
Vendor lock-in used to be a theoretical argument. It stopped being theoretical for a lot of teams recently. ServiceNow’s Cloud Observability, formerly Lightstep, is reaching end of life on March 1, 2026, or the contract term end date, whichever is later, confirmed directly in Lightstep’s own EOL notice. ServiceNow has stated plainly that no replacement product is planned.
- Teams on proprietary agents tied to a sunsetting product face a full re-instrumentation under a deadline, not on their own schedule
- Teams already instrumented with OpenTelemetry, even if sending data to that same vendor, can point the Collector at a new backend without touching application code
- This is precisely the scenario OTel was built to avoid, and it is no longer hypothetical
Signal adoption is already broad enough to act on
A common hesitation is whether OTel actually covers what a team needs today, not just traces. It does, broadly. Among organizations already using OpenTelemetry, 57 percent use it for metrics, roughly half for traces, and 48 percent for logs, according to Grafana’s 2026 survey.
That level of adoption across all three signals means a team is not choosing an immature standard for two pillars while waiting on the third. The coverage is already there.
Multi-cloud and multi-vendor sprawl
Few organizations run a single cloud, a single vendor, and a single stack anymore. A proprietary agent built for one environment often needs a second, different integration for another cloud, another Kubernetes distribution, or another team’s tooling choice.
That fragmentation compounds over time, until the observability stack has as many special cases as the infrastructure it is meant to monitor. OTel’s Collector handles this by standardizing ingestion regardless of where the data originates, which removes the need to maintain parallel integrations for every environment a company happens to run.
Before You Migrate: What to Inventory First
Most teams underestimate the actual surface area of their existing instrumentation. A migration plan built without a real inventory tends to discover its biggest risks mid-cutover, which is the worst possible time to find them.
Vendor SDK footprint: Every service that imports a vendor SDK needs to be identified individually, not estimated. Search the codebase for Datadog’s dd-trace, New Relic’s agent, Dynatrace’s OneAgent, or whichever proprietary SDK is in use, and record the version and configuration for each service separately. Versions drift across a fleet more often than teams expect, and a migration plan based on one assumed version will miss the services running something older.
Custom spans and API calls: Auto-instrumentation covers the common cases, but most production systems have custom spans and vendor-specific calls layered on top. Those need manual conversion, not an automated swap. The shape of the change is usually straightforward once identified:
# Proprietary SDK (Datadog example)

from ddtrace import tracer
with tracer.trace("checkout.process_payment") as span:
    span.set_tag("customer.tier", customer.tier)
    process_payment(order)

# OpenTelemetry equivalent

from opentelemetry import trace
tracer = trace.get_tracer("checkout")
with tracer.start_as_current_span("checkout.process_payment") as span:
    span.set_attribute("customer.tier", customer.tier)
process_payment(order)The logic does not change. The API surface does, and every custom span like this one needs to be found and converted individually, since auto-instrumentation will not catch it.
Dashboards and alerts: Anything built on vendor-specific attributes or query languages, DQL, NRQL, or a proprietary equivalent, will silently stop working once that vendor’s data stops flowing in. These need to be mapped to OpenTelemetry’s semantic conventions before cutover, not after. A dashboard that breaks quietly is far more dangerous than one that breaks loudly, because nobody notices until the data it was supposed to catch already slipped past.
This inventory is audit work only. It does not involve deploying a Collector or touching production traffic yet. That work starts in the next section, once the actual scope of the migration is fully known rather than estimated.
The Phased Migration Path
To keep this concrete, picture a mid-sized team running roughly 40 services, currently instrumented with the Datadog Agent, migrating to an OTel native backend. The phases below apply regardless of which proprietary agent you’re leaving, but following one example end to end makes each phase easier to picture than five isolated abstractions.
Phase 1: Deploy the OpenTelemetry Collector alongside the existing agent
The first move is not removing anything. It is standing up the OpenTelemetry Collector next to the Datadog Agent that is already running, so both operate in parallel without touching production traffic yet.
A quick distinction worth settling first, since it trips up a lot of migration plans. An agent runs locally, close to the application, and forwards data onward. The Collector can run in that same local mode, or centrally as a gateway that aggregates data from many sources before exporting it. Most production migrations use both, agents at the edge feeding a centralized Collector layer.
For the team in this example, that means deploying the Collector as a sidecar or daemonset alongside the existing Datadog Agent, with a pipeline that exports to both destinations at once.
exporters:
  otlp/datadog:
    endpoint: "datadog-otlp-endpoint:4317"
  otlp/new_backend:
    endpoint: "new-backend-endpoint:4317"

service:
  pipelines:
    traces:
      receivers: [otlp]
exporters: [otlp/datadog, otlp/new_backend]This single pipeline change sends every trace to both backends simultaneously. Nothing about the existing Datadog Agent or dashboards changes yet. The team is simply building a second, parallel path that can be validated before anything gets removed.
Phase 2: Pilot on two or three non-critical services
Resist the urge to migrate everything at once, and resist the equally common mistake of picking the most complex, highest traffic service first to prove the concept quickly. Neither instinct serves the migration well.
- Choose two or three services that are low risk if something goes briefly wrong, not the ones carrying the most production traffic
- Prioritize services with a mix of instrumentation types, some auto-instrumented, some with custom spans, so the pilot actually tests real complexity
- Treat this phase as the place to find configuration mistakes, missing semantic conventions, and Collector tuning issues, cheaply
In the example team’s case, a good pilot set might be an internal admin service, a low-traffic notifications worker, and one moderately complex service with a handful of custom Datadog spans already identified during the inventory phase. That mix tells them far more than piloting on the checkout service ever would.
Phase 3: Dual run and validate
With the pilot services sending data to both backends, the real validation work begins. This is the phase most migration guides move through too quickly, and it is where most production incidents during a migration actually originate.
- Compare trace counts, span durations, and error rates between the old and new backend for the same time window
- Recreate existing dashboards on the new backend using OTel semantic conventions, and confirm they show the same numbers, not just similar-looking charts
- Validate that alerts fire correctly from the new pipeline before disabling anything on the old one
- Give this phase real time, days or weeks depending on traffic patterns, not a single afternoon
For the pilot services in this example, that means running both pipelines for at least one full weekly traffic cycle, since a two day validation window would miss the Monday morning spike that tends to expose the issues that matter most.
Skipping or rushing this step is the single most common reason migrations quietly lose data without anyone noticing until much later.
Phase 4: Cutover service by service
Once validation passes for a specific service, and only then, remove that service’s proprietary agent. Cutting over service by service, rather than in one large release, keeps the blast radius small if something was missed during validation.
- Remove the vendor SDK and agent for one service at a time
- Keep a documented rollback plan specific to that service, not a single generic plan for the whole migration
- Monitor closely for the first few days after each cutover, since some issues only surface under real production load, not synthetic validation traffic
Once the three pilot services in this example clear validation, the team removes the Datadog Agent from each of them individually, over separate releases, rather than all three in one deploy. The remaining 37 services follow the same pattern in waves, grouped by how much custom instrumentation each one carries.
A rollback plan that only exists at the migration level, rather than per service, tends to become useless exactly when it is needed, because reverting one service should never require reverting all of them.
Phase 5: Decommission the old stack
The temptation to declare victory early is strong once most services have cut over. Resist it until every dependency is actually confirmed, not assumed.
- Confirm every dashboard, alert, and downstream integration that depended on the old backend has a working equivalent on the new one
- Check for less obvious dependents, scheduled reports, integrations with incident management tools, or data exports other teams rely on
- Only after that confirmation should the old agent’s licenses, infrastructure, and data retention be wound down
Only once every one of the 40 services has cleared cutover, and every dashboard and alert has a confirmed equivalent, does the example team decommission the Datadog Agent fleet-wide and let that contract lapse.
Where CubeAPM Fits Into This Migration
Everything covered so far is about instrumentation, moving from a proprietary agent to the OpenTelemetry Collector and SDKs. But the backend receiving that telemetry matters just as much to whether this migration actually pays off long term.
Once telemetry flows through the Collector as OTLP, the backend receiving it either speaks that protocol natively or it doesn’t. If it doesn’t, the migration ends with a translation layer or a proprietary exporter sitting between the Collector and the backend, which reintroduces the exact lock-in this entire migration was meant to remove.
CubeAPM ingests traces, metrics, and logs natively over OTLP. The Collector’s output connects directly, without a conversion step or a vendor-specific exporter in the middle. For a team going through everything this guide covers- inventory, phased cutover, dual run validation- that architectural detail is worth checking for any backend under consideration, not just this one, since it directly determines whether the next migration, whenever it comes, is as painful as this one was.
Common Migration Risks and How to Avoid Them
Big bang migrations
Replacing every service’s instrumentation in a single release feels faster on paper. In practice, it multiplies risk instead of reducing it. If something breaks, every service is affected at once, and rollback means reverting the entire change rather than one isolated piece. The gradual, service-by-service approach outlined above takes longer, but it keeps any single failure contained to a service or two instead of the whole fleet.
Underestimating custom instrumentation
Auto-instrumentation coverage is not equal across vendors and languages. A service that relied heavily on a proprietary agent’s automatic detection may have far more custom spans and manual tracing calls than the team remembers, simply because the agent made that complexity invisible. Skipping a thorough inventory, the work covered earlier in this guide, is how teams end up discovering missing spans mid-migration instead of before it starts.
Treating the strangler pattern as optional
For small, recently built systems, a full cutover might genuinely be manageable in one pass. For large, deeply integrated legacy environments, it rarely is. The strangler pattern, migrating incrementally and routing an increasing share of traffic to the new path over time, exists specifically for systems too large and too interdependent to replace in one motion. Treating it as optional on a legacy estate usually means discovering, mid-migration, exactly why the pattern exists in the first place.
Skipping the dual run phase
Of every mistake on this list, this is the one that causes the most damage with the least warning. A team under time pressure cuts the dual run phase short, or skips it entirely, assuming the new pipeline is close enough to correct. Data gaps from a rushed cutover often go unnoticed for weeks, surfacing only when someone needs historical data from exactly the window that got lost. Unlike most migration mistakes, this one cannot always be fixed retroactively, since the missing data is simply gone.
Conclusion
Migrating from a proprietary agent to OpenTelemetry is not a weekend project, and treating it like one is where most of the real risk comes from. The teams that get burned during a migration are rarely the ones who moved slowly. They are the ones who skipped the inventory, rushed the dual run phase, or cut over everything at once because a deadline made the phased approach feel like a luxury.
The phased path exists for a reason. The risk was never in the concept of OpenTelemetry itself. It lives in the cutover, in the gap between what a team assumes is validated and what actually is. Respect that gap, and the migration becomes a manageable engineering project instead of a gamble made under pressure.
FAQ
What is the difference between OpenTelemetry and a proprietary APM agent?
A proprietary agent ties instrumentation directly to one vendor’s backend, using that vendor’s SDK, attributes, and query language. OpenTelemetry separates instrumentation from the backend entirely, using a vendor-neutral SDK and protocol, so the same instrumentation can send data to any compatible backend without being rewritten.
How long does an OpenTelemetry migration typically take?
It depends heavily on fleet size and how much custom instrumentation exists beyond auto-instrumentation. A handful of services with straightforward instrumentation can migrate in a few weeks. A large, deeply integrated environment with extensive custom spans and legacy dependencies often takes several months when following a proper phased approach with adequate dual run validation.
Can OpenTelemetry and proprietary agents run at the same time during migration?
Yes, and they should. Running both in parallel during the dual run phase is how teams validate that the new pipeline produces accurate data before removing the old one. Attempting a direct swap without a parallel run removes the ability to compare and catch discrepancies before they become production gaps.
Does OpenTelemetry migration mean losing historical monitoring data?
Not necessarily, though it depends on the backend being migrated away from and whether it offers a data export path. Historical data on the old backend typically stays accessible for as long as that platform remains active. Teams concerned about long-term historical access should plan a data export or extended retention window before decommissioning the old stack.
Is OpenTelemetry actually production-ready in 2026?
Yes, for traces, metrics, and logs. Vendor support for OTLP varies, though; some platforms ingest it natively, others accept it and convert it into their own internal format, so check a specific vendor’s current documentation before assuming native support. Profiling remains the exception, still early in standardization compared to the other three signals.
Disclaimer: This article reflects OpenTelemetry adoption statistics and vendor end-of-life timelines as of the publish date. Adoption figures and vendor status can change. Verify current statistics and vendor announcements against the original sources, linked above, before planning a migration around them.