










ClickStack is an open source observability platform built on ClickHouse and OpenTelemetry that unifies logs, traces, metrics, and session replays in a single storage layer. Instead of running separate backends for each signal type and manually correlating timestamps across tools, ClickStack stores everything in ClickHouse with optimized schemas for each data type, making cross-signal queries straightforward.
This guide covers how to set up ClickStack from deployment through schema configuration and collector setup. It explains what ClickStack actually does, how the components fit together, and how to configure it for production-scale observability without the unpredictable pricing or data egress costs that come with cloud-only SaaS platforms.
What Is ClickStack and Why It Matters for Observability
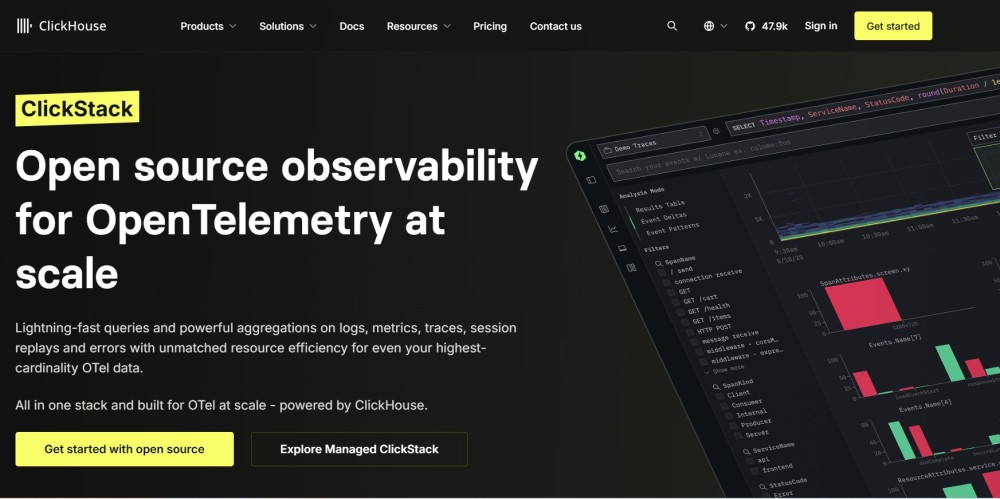
ClickStack is a production-grade observability stack that combines three core components: ClickHouse as the storage layer, HyperDX as the query and visualization UI, and a custom OpenTelemetry collector configured to write telemetry data directly into ClickHouse using an opinionated schema optimized for analytical queries. The entire stack is open source and can be deployed anywhere you run ClickHouse.
The core architectural decision behind ClickStack is this: all observability signals logs, distributed traces, metrics, and session replays should be stored as wide, structured events in ClickHouse tables partitioned by signal type but fully queryable and correlatable at the database level. This means you can write a single SQL query that joins error logs with their associated traces and the infrastructure metrics from the same time window, something that requires three separate tools and manual timestamp correlation in most observability stacks.
ClickStack handles high cardinality workloads efficiently because ClickHouse is a columnar database built for analytical queries over billions of rows. Unlike row-oriented databases that struggle when you add too many unique label combinations, ClickHouse scans only the columns you query and uses native JSON support to store arbitrary attributes without schema migrations. Query performance stays fast even when you index on service name, endpoint path, user ID, deployment version, and dozens of other dimensions simultaneously.
Teams that already run ClickHouse for analytics or data warehousing can add observability to the same infrastructure without deploying a second storage system. For teams evaluating observability platforms, ClickStack provides an alternative to vendor-locked SaaS platforms where telemetry data leaves your infrastructure and pricing scales unpredictably with data volume or user seats.
How ClickStack Works: Architecture and Components
ClickStack consists of three layers that work together to provide full-stack observability.
Storage Layer: ClickHouse
ClickHouse stores all telemetry data in tables optimized for each signal type. Logs go into otel_logs with full text indexing on the body field. Traces go into otel_traces the bloom filter indexes on trace ID and span ID for fast lookups. Metrics are split across multiple tables by metric type: gauge, sum, histogram, exponential histogram, and summary. Session replays go into hyperdx_sessions separate retention policies.
Each table uses compression codecs like ZSTD and Delta encoding to minimize storage cost. TTL policies drop old partitions automatically after your configured retention period. The default schema includes 30 days for traces, 14 days for logs, 90 days for metrics, and 7 days for sessions, but these are configurable.
ClickHouse runs on your infrastructure. You control compute, storage, replication, and backup. If you already run ClickHouse for other workloads, adding observability tables to the same cluster means you can correlate application telemetry with business metrics or user analytics in a single query without moving data between systems.
Query and Visualization Layer: HyperDX UI
HyperDX is the frontend for ClickStack. It provides a web interface optimized for observability workflows: log search with Lucene style syntax, trace exploration with flame graphs and span filtering, metric dashboards, and session replay. The UI translates user queries into SQL that runs directly against ClickHouse, so query performance depends on ClickHouse indexing and parallelization rather than a separate query engine.
HyperDX supports both Lucene syntax for developers who want quick keyword searches and raw SQL for power users who need complex aggregations or joins across signal types. Dashboards, alerts, and saved queries are stored in ClickHouse as well, keeping the entire observability stack in one database.
The UI is open source and can be customized if you need to modify the schema or add new views. It is designed to work with any ClickHouse instance that follows the ClickStack schema, so you can run HyperDX separately from your data storage if your team prefers to separate compute from storage.
Ingestion Layer: OpenTelemetry Collector
The OpenTelemetry collector receives telemetry from your applications and infrastructure via OTLP over gRPC or HTTP. ClickStack ships with a preconfigured collector that includes the ClickHouse exporter, which writes traces, logs, and metrics directly into the appropriate ClickHouse tables using batched inserts.
The collector handles data transformation, sampling, and routing. You can configure it to add resource attributes, drop noisy spans, or route specific services to different ClickHouse tables. The default configuration enables async inserts and LZ4 compression to reduce write latency and network overhead.
If you already run an OpenTelemetry collector for other purposes, you can add the ClickHouse exporter to your existing pipeline instead of deploying the bundled collector. The exporter is part of the OpenTelemetry Collector Contrib repository and supports all standard OTLP signal types.
Setting Up ClickStack: Deployment Options
ClickStack can be deployed in three ways, depending on your infrastructure and operational requirements.
Single Container Deployment for Testing
The fastest way to test ClickStack is the all-in-one Docker image that bundles ClickHouse, HyperDX, and the OpenTelemetry collector into a single container. This is suitable for local development or proof of concept testing, but not for production workloads because it has no data persistence, replication, or horizontal scaling.
docker run -p 8080:8080 -p 4317:4317 -p 4318:4318 \
docker.hyperdx.io/hyperdx/hyperdx-all-in-oneThis starts ClickStack with the HyperDX UI on port 8080 and OTLP receivers on ports 4317 (gRPC) and 4318 (HTTP). You can point OpenTelemetry SDKs at http://localhost:4317 to start sending telemetry immediately.
The all-in-one image is useful for evaluating the UI, testing queries, and understanding the schema before committing to a full deployment. It takes under two minutes to start and includes sample data so you can explore the interface without instrumenting your own applications first.
Docker Compose for Staging
For staging environments or small production deployments, ClickStack provides a Docker Compose configuration that runs ClickHouse, HyperDX, and the collector as separate containers with persistent volumes.
git clone [email protected]:ClickHouse/clickstack.git
cd clickstack
docker compose up
This deployment separates compute and storage, uses named volumes for data persistence, and allows you to scale the collector independently from ClickHouse. The default configuration allocates 4 GB of memory to ClickHouse and 1 GB to the collector. You can adjust these limits in the docker-compose.yaml file based on your expected telemetry volume.
Docker Compose deployments are suitable for teams with moderate telemetry volume (under 100 GB per day) running on a single host or small cluster. For higher scale or multi region deployments, use Kubernetes with the Helm chart or deploy ClickStack on ClickHouse Cloud.
Kubernetes Deployment with Helm
Production ClickStack deployments at scale use Kubernetes and the official Helm chart. The Helm chart deploys ClickHouse as a StatefulSet with persistent volumes, HyperDX as a Deployment, and the OpenTelemetry collector as a DaemonSet that runs on every node to collect host level metrics and logs.
helm repo add clickstack https://clickhouse.github.io/clickstack
helm install clickstack clickstack/clickstack \
  --set clickhouse.persistence.size=500Gi \
--set collector.replicas=3The Helm chart includes configuration options for ClickHouse replication, backup schedules, resource limits, ingress rules, and authentication. You can configure external ClickHouse clusters if you already run ClickHouse separately from your observability workload.
Kubernetes deployments scale horizontally by adding collector replicas to handle higher telemetry ingestion rates and ClickHouse replicas to distribute query load. ClickHouse sharding is supported for teams ingesting over 1 TB per day, though most deployments under 10 TB per day run on a single ClickHouse instance with multiple replicas for high availability.
ClickHouse Cloud with Managed Backend
ClickHouse Cloud offers a managed option where ClickHouse and HyperDX run as fully managed services with compute and storage separation via object storage. This enables low cost long term retention because you pay only for storage after data moves to object storage tiers, and compute scales independently based on query load.
With ClickHouse Cloud, you deploy only the OpenTelemetry collector in your infrastructure to forward telemetry to ClickHouse Cloud over OTLP. HyperDX integrates directly with ClickHouse Cloud’s authentication system, so users log in once and access both the ClickHouse SQL console and the HyperDX observability UI.
Managed deployments trade operational control for reduced operational burden. You do not manage ClickHouse upgrades, replication, or backups, but you also cannot customize the ClickHouse configuration or access the underlying infrastructure. For teams without dedicated database operations expertise, this is often the right tradeoff.
Understanding ClickStack’s Schema Design
ClickStack uses separate ClickHouse tables for each telemetry signal type. Each table is optimized for the query patterns typical of that signal: full text search for logs, trace ID lookups for distributed traces, time series aggregation for metrics.
Logs Table: Full Text Indexing and Trace Correlation
The otel_logs table stores log lines with full text indexing on the body field using ClickHouse’s tokenbf_v1 index. This allows fast substring searches without scanning every row. The table also includes a bloom filter index on TraceId So you can quickly find all log lines associated with a specific distributed trace.
CREATE TABLE default.otel_logs (
  Timestamp DateTime64(9) CODEC(Delta(8), ZSTD(1)),
  TraceId String CODEC(ZSTD(1)),
  SpanId String CODEC(ZSTD(1)),
  SeverityText LowCardinality(String) CODEC(ZSTD(1)),
  ServiceName LowCardinality(String) CODEC(ZSTD(1)),
  Body String CODEC(ZSTD(1)),
  ResourceAttributes Map(LowCardinality(String), String) CODEC(ZSTD(1)),
  LogAttributes Map(LowCardinality(String), String) CODEC(ZSTD(1)),
  INDEX idx_trace_id TraceId TYPE bloom_filter(0.001) GRANULARITY 1,
  INDEX idx_lower_body lower(Body) TYPE tokenbf_v1(32768, 3, 0) GRANULARITY 8
) ENGINE = MergeTree()
PARTITION BY toDate(Timestamp)
ORDER BY (toStartOfFiveMinutes(Timestamp), ServiceName, Timestamp)
TTL toDateTime(Timestamp) + INTERVAL 14 DAY
SETTINGS ttl_only_drop_parts = 1;The schema uses LowCardinality for high cardinality string fields like service name and severity to reduce storage and improve query performance. Maps store arbitrary key value pairs from OpenTelemetry resource and log attributes without requiring schema changes when you add new labels.
Partitioning by date enables fast partition dropping when logs exceed the TTL. Ordering by timestamp and service name makes time range queries and service filtered queries fast because ClickHouse can skip entire data blocks that do not match the query predicate.
Traces Table: Distributed Trace Storage and Span Relationships
The otel_traces table stores distributed trace spans with parent child relationships preserved via ParentSpanId. Bloom filter indexes on TraceId make it fast to retrieve all spans for a given trace even when the trace includes hundreds of spans across dozens of services.
CREATE TABLE default.otel_traces (
  Timestamp DateTime64(9) CODEC(Delta(8), ZSTD(1)),
  TraceId String CODEC(ZSTD(1)),
  SpanId String CODEC(ZSTD(1)),
  ParentSpanId String CODEC(ZSTD(1)),
  SpanName LowCardinality(String) CODEC(ZSTD(1)),
  ServiceName LowCardinality(String) CODEC(ZSTD(1)),
  SpanAttributes Map(LowCardinality(String), String) CODEC(ZSTD(1)),
  Duration UInt64 CODEC(ZSTD(1)),
  StatusCode LowCardinality(String) CODEC(ZSTD(1)),
  INDEX idx_trace_id TraceId TYPE bloom_filter(0.001) GRANULARITY 1,
  INDEX idx_duration Duration TYPE minmax GRANULARITY 1
) ENGINE = MergeTree()
PARTITION BY toDate(Timestamp)
ORDER BY (ServiceName, SpanName, toDateTime(Timestamp))
TTL toDateTime(Timestamp) + INTERVAL 30 DAY
SETTINGS ttl_only_drop_parts = 1;The duration field uses a minmax index so you can quickly filter spans by latency threshold. This is essential for queries like “show all spans slower than 500ms” without scanning every span in the table.
Trace data compresses well because span names and service names repeat frequently. The schema uses Delta encoding on timestamps because spans within a trace typically have timestamps close together, and ZSTD compression on string fields to minimize storage cost.
Metrics Tables: Separate Tables by Metric Type
ClickStack creates separate tables for each OpenTelemetry metric type: gauge, sum, histogram, exponential histogram, and summary. This avoids sparse columns and keeps query performance high because each table only stores the fields relevant to that metric type.
The gauge table is representative of the pattern used across all metric tables:
CREATE TABLE default.otel_metrics_gauge (
  ResourceAttributes Map(LowCardinality(String), String) CODEC(ZSTD(1)),
  ServiceName LowCardinality(String) CODEC(ZSTD(1)),
  MetricName String CODEC(ZSTD(1)),
  MetricUnit String CODEC(ZSTD(1)),
  Attributes Map(LowCardinality(String), String) CODEC(ZSTD(1)),
  TimeUnix DateTime64(9) CODEC(Delta(8), ZSTD(1)),
  Value Float64 CODEC(ZSTD(1))
) ENGINE = MergeTree()
PARTITION BY toDate(TimeUnix)
ORDER BY (ServiceName, MetricName, Attributes, toUnixTimestamp64Nano(TimeUnix))
TTL toDateTime(TimeUnix) + INTERVAL 90 DAY
SETTINGS ttl_only_drop_parts = 1;Metrics use longer retention (90 days) than logs (14 days) or traces (30 days) because metric data is smaller and teams typically need longer historical windows for capacity planning and SLO tracking.
Histogram tables include additional fields for bucket boundaries and counts. Exponential histogram tables store base and scale fields for variable width buckets. The collector writes the appropriate metric type to the matching table based on the OpenTelemetry metric descriptor.
Session Replay Table: Frontend Telemetry and User Interactions
The hyperdx_sessions table stores session replay data captured from browser based applications. This includes user interactions, console logs, network requests, and DOM mutations recorded by the HyperDX browser SDK.
Session data has the shortest TTL (7 days) because it includes high volume event streams that are primarily useful for debugging active issues rather than long term trend analysis. The table uses similar indexing as logs with full text search on the body field and trace correlation via bloom filter indexes.
Configuring the OpenTelemetry Collector for ClickStack
If you run a separate OpenTelemetry collector instead of the bundled collector that ships with ClickStack, you need to configure the ClickHouse exporter to route telemetry to the correct ClickHouse tables.
Collector Configuration: Receivers and Processors
The collector receives telemetry via OTLP over gRPC and HTTP. The batch processor groups spans and log records into larger batches before writing to ClickHouse to reduce insert overhead.
receivers:
  otlp:
    protocols:
      grpc:
        endpoint: 0.0.0.0:4317
      http:
        endpoint: 0.0.0.0:4318
processors:
  batch:
    send_batch_size: 10000
    timeout: 2s
  resourcedetection:
detectors: [env, system]The resource detection processor adds resource attributes like hostname, OS type, and cloud provider metadata automatically based on the environment where the collector runs. This reduces instrumentation burden because applications do not need to manually attach infrastructure context to every span or log line.
ClickHouse Exporter Configuration
The ClickHouse exporter writes telemetry to ClickHouse using the native protocol over TCP. It supports async inserts to reduce write latency and LZ4 compression to minimize network transfer size.
exporters:
  clickhouse:
    endpoint: tcp://clickstack:9000?dial_timeout=10s&compress=lz4&async_insert=1
    database: default
    traces_table_name: otel_traces
    logs_table_name: otel_logs
    metrics_tables:
      gauge:
        name: otel_metrics_gauge
      sum:
        name: otel_metrics_sum
      histogram:
        name: otel_metrics_histogram
      exponential_histogram:
        name: otel_metrics_exponential_histogram
      summary:
        name: otel_metrics_summary
    ttl: 720h
    create_schema: true
    timeout: 5s
    sending_queue:
      queue_size: 1000
    retry_on_failure:
enabled: trueThe create_schema setting tells the exporter to create tables automatically if they do not exist. This is useful for initial setup but should be disabled in production once the schema is stable to prevent accidental schema changes.
The ttl Setting controls how long data is retained before ClickHouse drops old partitions. The default is 720 hours (30 days) for traces and metrics, but you can configure per-table TTLs directly in the ClickHouse table definitions.
Service Pipelines: Routing Telemetry to ClickHouse
The service section defines pipelines that connect receivers, processors, and exporters. ClickStack uses separate pipelines for traces, logs, and metrics so you can apply different processing rules to each signal type.
service:
  pipelines:
    traces:
      receivers: [otlp]
      processors: [resourcedetection, batch]
      exporters: [clickhouse]
    logs:
      receivers: [otlp]
      processors: [resourcedetection, batch]
      exporters: [clickhouse]
    metrics:
      receivers: [otlp]
      processors: [resourcedetection, batch]
exporters: [clickhouse]If you need to route specific services or namespaces to different ClickHouse tables, you can add routing processors that filter spans by resource attributes and send them to separate exporters. This is useful for multi tenant deployments where each tenant’s telemetry goes into an isolated database or table.
Cross Signal Queries: The Real Power of Unified Storage
Storing all observability signals in ClickHouse means you can write queries that join logs, traces, and metrics without switching tools or manually correlating timestamps. This is the primary reason teams choose ClickStack over tool combinations like Elasticsearch for logs, Jaeger for traces, and Prometheus for metrics.
Finding Error Traces and Their Associated Logs
When a trace shows an error, you often need to see the log lines from the same request to understand what failed. This query retrieves error traces and their logs in a single result set:
SELECT
  t.TraceId,
  t.ServiceName,
  t.SpanName,
  t.Duration / 1e6 AS duration_ms,
  l.Timestamp AS log_time,
  l.SeverityText,
  l.Body AS log_message
FROM otel_traces t
JOIN otel_logs l ON t.TraceId = l.TraceId
WHERE t.StatusCode = 'ERROR'
  AND t.Timestamp >= now() - INTERVAL 1 HOUR
ORDER BY t.Timestamp DESC
LIMIT 100;This query finds all traces with error status in the last hour and joins them with matching log lines via trace ID. The result shows which service failed, how long the request took, and what the application logged at the time of failure.
Without unified storage, you would query Jaeger for error traces, extract the trace IDs, then manually query Elasticsearch for logs matching those IDs. ClickStack makes this a single query that finishes in under a second even over billions of spans and log lines.
Correlating Slow Spans with Infrastructure Metrics
If API latency spikes, you need to know whether the cause is application code, database queries, or infrastructure resource saturation. This query correlates slow spans with CPU and memory metrics from the same host:
SELECT
  t.ServiceName,
  t.SpanName,
  t.Duration / 1e6 AS duration_ms,
  m_cpu.Value AS cpu_percent,
  m_mem.Value / 1e9 AS memory_gb
FROM otel_traces t
LEFT JOIN otel_metrics_gauge m_cpu ON
  t.ServiceName = m_cpu.ServiceName AND
  m_cpu.MetricName = 'system.cpu.utilization' AND
  m_cpu.TimeUnix BETWEEN t.Timestamp - INTERVAL 10 SECOND AND t.Timestamp + INTERVAL 10 SECOND
LEFT JOIN otel_metrics_gauge m_mem ON
  t.ServiceName = m_mem.ServiceName AND
  m_mem.MetricName = 'system.memory.usage' AND
  m_mem.TimeUnix BETWEEN t.Timestamp - INTERVAL 10 SECOND AND t.Timestamp + INTERVAL 10 SECOND
WHERE t.Duration > 500e6
  AND t.Timestamp >= now() - INTERVAL 1 HOUR
ORDER BY t.Duration DESC
LIMIT 50;This query shows slow spans alongside the CPU and memory usage on the same host at the time the span executed. If CPU was at 95% when the span ran, you know the slowness was infrastructure related rather than application logic.
Running this query across separate tools requires exporting data from three systems, joining on timestamps in a spreadsheet or script, and manually aligning time zones. ClickStack makes it a native SQL query that completes in milliseconds.
Best Practices for Running ClickStack in Production
ClickStack can handle production scale telemetry, but like any observability platform, it requires tuning and operational discipline to run reliably at high ingestion rates.
Retention Policies: Align TTL with Your Query Patterns
The default TTLs (14 days for logs, 30 days for traces, 90 days for metrics) work for most teams, but you should adjust them based on how long you actually query historical data. Logs are rarely useful after two weeks because most debugging happens within hours of an incident. Metrics are queried for months during capacity planning and SLO reviews.
Set shorter TTLs for high volume signals to reduce storage cost. For example, if your application generates 500 GB of logs per day, storing 30 days costs 15 TB. Dropping logs after 7 days reduces storage to 3.5 TB with minimal impact on debugging workflows.
Indexing Strategy: Add Indexes Only When Queries Are Slow
ClickHouse query performance depends on data ordering and indexes. The default schema orders logs by timestamp and service name, which makes time range queries and service filtered queries fast. If you frequently filter by other fields like user ID or endpoint path, add secondary indexes.
Do not add indexes preemptively. Indexes consume storage and slow down inserts. Add them only when you identify slow queries in production. Use EXPLAIN to see which indexes ClickHouse uses for your queries and add bloom filter or minmax indexes where appropriate.
Sampling Strategy: Use Collector Level Sampling for High Volume Services
If a single service generates millions of spans per minute, you can configure the OpenTelemetry collector to sample before writing to ClickHouse. Tail sampling retains all error spans and slow spans while dropping a percentage of fast successful spans.
ClickStack does not include built in sampling because ClickHouse handles high cardinality data efficiently without sampling. But if storage cost or write throughput becomes an issue, probabilistic sampling at the collector reduces volume by 90% while preserving visibility into errors and latency outliers.
Backup and Disaster Recovery: Replicate ClickHouse Data Across Availability Zones
ClickHouse supports replication using the ReplicatedMergeTree engine. In production, deploy ClickHouse with at least two replicas in separate availability zones so that telemetry data survives infrastructure failures.
The Helm chart includes replication configuration options. Enable replication and point each replica at a shared ZooKeeper or ClickHouse Keeper instance to coordinate writes. Replicas stay synchronized automatically, and queries can run against any replica without manual failover.
Back up ClickHouse data to object storage using ClickHouse’s native backup tools or by exporting partitions to S3 compatible storage. Restoring from backup is faster than replaying telemetry from source because ClickHouse backups are partition level and compress efficiently.
Monitoring ClickStack with CubeAPM
CubeAPM is a self hosted observability platform that runs inside your cloud or data center and provides full stack monitoring for applications, infrastructure, and databases including ClickHouse. If you deploy ClickStack on premises or in your own VPC, CubeAPM gives you visibility into ClickStack’s operational health without sending telemetry to external SaaS platforms.
CubeAPM connects to ClickHouse via OpenTelemetry or Prometheus exporters and collects system metrics, query performance stats, replication lag, and disk usage. It surfaces ClickHouse specific signals like merge activity, part count, and compression ratio, which are essential for diagnosing performance issues in production ClickHouse clusters.
Unlike generic infrastructure monitoring tools, CubeAPM understands ClickHouse’s operational characteristics and provides dashboards designed for ClickHouse cluster health. You can set alerts on query latency, replication lag, or disk space without writing custom queries. CubeAPM pricing is $0.15 per GB of telemetry ingested with no per seat fees, making it predictable as your monitoring data grows.
For teams running ClickStack in production, monitoring the monitoring system is critical. ClickHouse is the storage layer for all observability signals, so if ClickHouse becomes slow or unavailable, you lose visibility into your entire infrastructure. CubeAPM ensures you know when ClickHouse is under load before it impacts query performance or data ingestion.
Tools and Implementation: Alternatives to ClickStack
ClickStack is one option for unified observability on ClickHouse. If ClickStack does not fit your requirements, several alternatives provide similar capabilities with different tradeoffs.
SigNoz: Open Source Observability with ClickHouse Backend
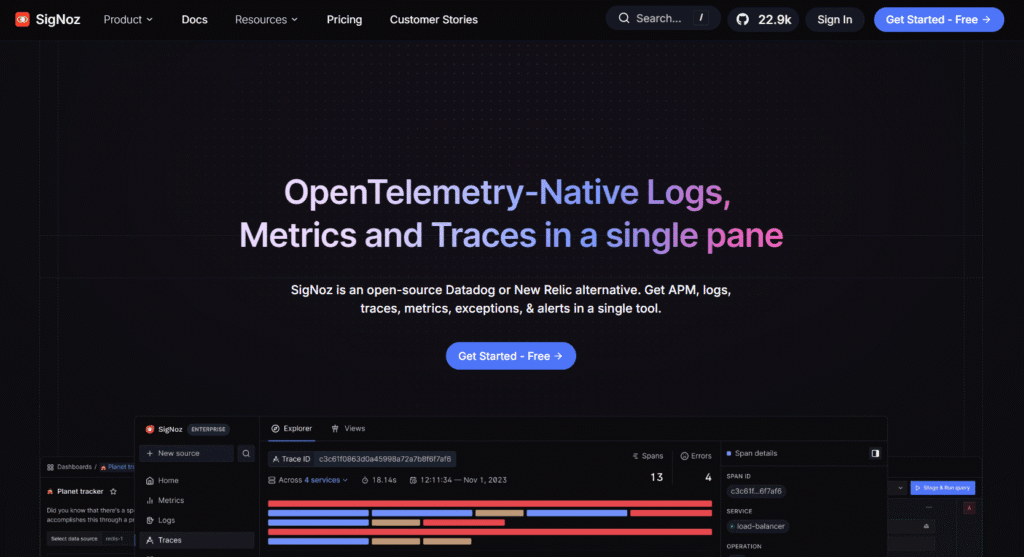
SigNoz is an open-source APM platform that uses ClickHouse as the default storage backend. It provides similar functionality to ClickStack logs, traces, metrics, and session replay with a different UI and query interface. SigNoz Cloud offers a managed option if you prefer SaaS over self-hosting.
SigNoz uses a custom schema rather than OpenTelemetry native tables, so migrating between SigNoz and ClickStack requires schema translation. Pricing for SigNoz Cloud starts at $0.30 per GB, higher than ClickStack’s self-hosted cost but lower than most enterprise APM platforms.
Grafana with ClickHouse Plugin
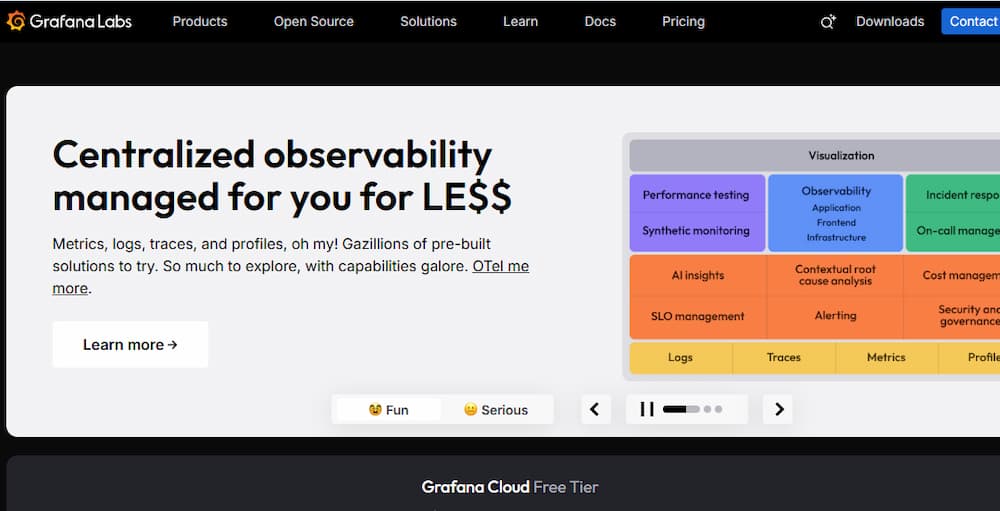
Grafana supports ClickHouse as a data source via a community plugin. If you already use Grafana for metrics dashboards, you can add ClickHouse as a backend and query observability data using Grafana’s dashboard builder. This approach gives you flexibility to customize the schema and query logic but requires more operational work to set up and maintain.
Grafana does not provide a purpose built observability UI like HyperDX, so you build dashboards manually for each signal type. For teams with strong Grafana expertise, this is often preferable to adopting a new UI. For teams without existing Grafana deployments, ClickStack’s bundled UI reduces time to value.
Coralogix and Axiom: SaaS Platforms with ClickHouse Backends
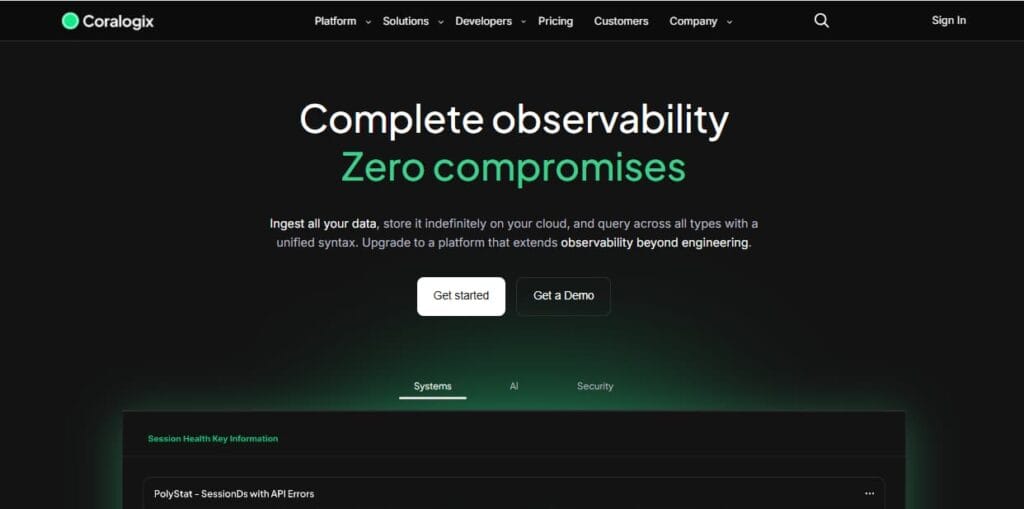
Coralogix and Axiom are SaaS observability platforms that use ClickHouse internally but abstract the database layer from users. You send telemetry via OpenTelemetry and query through their UIs without direct ClickHouse access. This simplifies operations but removes schema control and prevents custom queries that join telemetry with your own business data.
Pricing for both platforms is usage based with per GB ingestion charges. Coralogix charges $0.42 per GB for logs with additional fees for traces and metrics. Axiom charges $0.25 per GB with unlimited retention included. Both are more expensive than self hosted ClickStack but less expensive than legacy enterprise APM platforms.
Conclusion
ClickStack provides a straightforward path to unified observability if you need full control over telemetry data and want to avoid the unpredictable pricing and vendor lock in common with SaaS platforms. Deploying ClickStack requires running ClickHouse and understanding its operational characteristics, but in return you get a single storage layer for logs, traces, metrics, and sessions that scales to billions of events per day without degrading query performance.
The primary advantage of ClickStack is cross signal queries. When logs, traces, and metrics live in separate tools, correlating data requires manual effort and domain expertise. ClickStack makes correlation native because everything is in one database with a shared query language. This reduces mean time to resolution during incidents and makes root cause analysis faster.
For teams that already run ClickHouse, adding observability to the same infrastructure is efficient. For teams evaluating self hosted observability for the first time, evaluating observability platforms requires comparing not just features but also operational complexity, query performance under load, and total cost of ownership including storage and compute.
Disclaimer: The information in this article reflects the latest details available at the time of publication and may change as technologies and products evolve. Features, pricing, and plan limits can change over time. Always verify the latest information directly with the vendor before making purchasing or deployment decisions.
Frequently Asked Questions
What is ClickStack and why would I use it instead of separate logging and APM tools?
ClickStack is an open source observability platform that stores logs, traces, metrics, and session replays in a single ClickHouse database. Instead of running separate tools and manually correlating timestamps, ClickStack lets you query across all signal types in one SQL statement. This makes root cause analysis faster and eliminates the operational overhead of managing multiple backends.
How does ClickStack pricing compare to SaaS observability platforms?
ClickStack is free open source software. You pay only for the infrastructure to run ClickHouse and the collector. Storage cost depends on your data volume and ClickHouse deployment, but most teams report 60 to 80 percent lower cost than SaaS platforms because there are no per user fees, no data egress charges, and no separate indexing costs.
Can I use ClickStack with my existing OpenTelemetry instrumentation?
Yes. ClickStack is OpenTelemetry native and works with any application instrumented using OpenTelemetry SDKs. The collector receives OTLP over gRPC or HTTP and writes telemetry directly to ClickHouse. You can also use the ClickHouse exporter in your existing collector pipelines if you already run a separate OpenTelemetry collector.
What is the difference between ClickStack and SigNoz?
Both use ClickHouse as the storage backend, but ClickStack uses an OpenTelemetry native schema while SigNoz uses a custom schema. ClickStack includes the HyperDX UI for querying and visualization. SigNoz has its own UI with different query syntax and dashboard design. SigNoz offers a managed cloud option, while ClickStack is primarily self hosted.
How much ClickHouse infrastructure do I need to run ClickStack in production?
For teams ingesting 100 GB of telemetry per day, a single ClickHouse instance with 16 CPU cores and 64 GB of memory handles ingestion and queries comfortably. For higher volume, add replicas for high availability and distribute queries across them. Most teams under 1 TB per day run on a single ClickHouse server with replication for durability.
Does ClickStack support long term data retention?
Yes. ClickHouse compresses telemetry data efficiently, and you can configure TTL policies per table. The default is 14 days for logs, 30 days for traces, and 90 days for metrics, but you can retain data indefinitely if storage capacity allows. Object storage backends like S3 reduce the cost of long term retention further.
Can I query ClickStack data directly with SQL or do I need to use the HyperDX UI?
You can query ClickStack tables directly using any SQL client that supports ClickHouse. The HyperD