










ClickHouse runs some of the world’s fastest analytical queries, processing billions of rows per second in production. But without proper monitoring, a single slow insert batch or replicated table lag can quietly degrade performance for hours before anyone notices. With the right monitoring setup, the same issue triggers an alert, surfaces the exact table or query causing the bottleneck, and gives engineers the context to fix it in minutes instead of days.
This guide covers what ClickHouse monitoring is, how it works, what metrics matter most, and how to build a monitoring stack using system tables, Prometheus, Grafana, and purpose-built tools. Whether you run a single ClickHouse node or a distributed cluster across multiple regions, this guide shows you how to instrument every layer from query latency to replication lag without adding operational overhead.
What Is ClickHouse Monitoring?
ClickHouse monitoring is the practice of continuously tracking the performance, availability, and resource utilization of ClickHouse database clusters using built-in system tables, external metric collectors, and real-time dashboards. The goal is to detect performance degradation, failed queries, replication issues, and resource saturation early enough to prevent user impact.
Unlike traditional OLTP databases that serve thousands of small transactions per second, ClickHouse is an OLAP database optimized for analytical workloads. It handles batch inserts, massive aggregations, and queries that scan billions of rows. This creates a different monitoring profile. Instead of tracking connection pool saturation or transaction rollback rates, ClickHouse monitoring focuses on insert throughput, merge performance, query duration distributions, and replication queue depth.
ClickHouse itself monitors hardware resource state continuously. According to the official ClickHouse documentation, ClickHouse tracks load and temperature on processors, utilization of storage system, RAM, and network. This self-monitoring data is exposed through system tables that update in real time, making ClickHouse one of the most introspectable databases available.
How ClickHouse Monitoring Works
ClickHouse exposes internal state through a set of system tables that any client can query using standard SQL. These tables contain metrics, query logs, part merge activity, replication status, and error events. External monitoring tools either query these system tables directly or scrape metrics from ClickHouse’s Prometheus-compatible /metrics endpoint.
The monitoring architecture has three layers:
System tables provide real-time access to internal metrics, query logs, merge activity, replication queue status, and table part metadata. Tables like system.query_log, system.metrics, system.asynchronous_metrics, and system.events give full visibility into what ClickHouse is doing at any moment. These tables are queryable from any SQL client, making them the foundation of all ClickHouse monitoring.
Prometheus endpoint exposes a /metrics HTTP endpoint that returns metrics in Prometheus format. This endpoint is generated by querying system tables when scraped, meaning it adds monitoring load to the production instance. The benefit is standardized metric collection that integrates with existing Prometheus and Grafana stacks without custom query logic.
External dashboards and alerting platforms consume metrics from either system tables or the Prometheus endpoint, then visualize trends, detect anomalies, and fire alerts. Tools like Grafana, Datadog, and infrastructure monitoring platforms connect to ClickHouse as a data source and build dashboards using pre-built queries or custom SQL.
This layered approach means you can start with simple system table queries, add Prometheus scraping when you need standardized metrics, and integrate with external platforms when alert routing or long term metric retention becomes necessary.
Key ClickHouse Metrics to Monitor
ClickHouse generates hundreds of metrics across query performance, storage, replication, and infrastructure. Monitoring everything creates noise. Focusing on the right subset catches real problems early.
Query performance metrics
Query performance directly impacts user experience and application responsiveness. Slow queries cascade into timeouts, retries, and degraded service quality across dependent systems.
Query duration tracks how long queries take to execute, measured from the system.query_log table. Monitor the 50th, 95th, and 99th percentile query times for each query type SELECT, INSERT, ALTER to detect performance regressions. A sudden spike in p95 query duration often signals a schema change, increased data volume, or a newly introduced query pattern that does not use indexes efficiently.
Queries per second measures query load by counting entries in system.query_log grouped by time window. High query rates without corresponding infrastructure scale can lead to CPU saturation, memory pressure, and increased queue wait times. Monitor this alongside CPU utilization to detect when query load is approaching cluster capacity limits.
Failed queries are queries that returned an exception, logged in system.query_log with type = ‘ExceptionWhileProcessing’. A spike in failed queries often indicates a schema mismatch, permission issue, or a query that exceeds memory limits. These failures are silent to users unless you monitor and alert on them proactively.
Slow query patterns are identified by filtering system.query_log for queries exceeding a duration threshold and grouping by normalized query text. This reveals which query templates are consistently slow, helping prioritize optimization work on high impact queries rather than one off anomalies.
Insert and merge performance
ClickHouse’s insert path is fundamentally different from row-oriented databases. Inserts write new parts to disk, and background merges consolidate these parts into larger, more efficient structures. Poor insert or merge performance degrades both write throughput and query speed.
Insert throughput measures rows inserted per second, calculated from system.query_log entries with type = ‘QueryFinish’ and query_kind = ‘Insert’. Low insert throughput relative to expected volume can indicate network bottlenecks, disk I/O saturation, or table engine misconfiguration. Monitor this alongside disk write IOPS to isolate the bottleneck.
Merge operations consolidate small data parts into larger ones, reducing the number of parts each query must read. The system.merges table shows active merges, and system.asynchronous_metrics exposes NumberOfRunningMerges. A consistently high merge count signals that inserts are creating parts faster than the merge scheduler can consolidate them, leading to query slowdowns as part count grows.
Part count per partition is visible in system.parts. High part counts increase query latency because each query must open and read from more files. Monitor count(*) FROM system.parts GROUP BY partition and alert when any partition exceeds 100 parts, indicating merge lag or undersized merge thread pool.
Merge performance can be tracked by querying system.query_log for merge durations. Slow merges delay part consolidation and increase storage space usage due to unmerged duplicate data. This often points to disk I/O contention or large uncompressed data parts.
Replication and cluster health
Distributed ClickHouse deployments rely on replication to ensure availability and query scalability. Replication lag and replica failures are among the most critical failure modes to monitor.
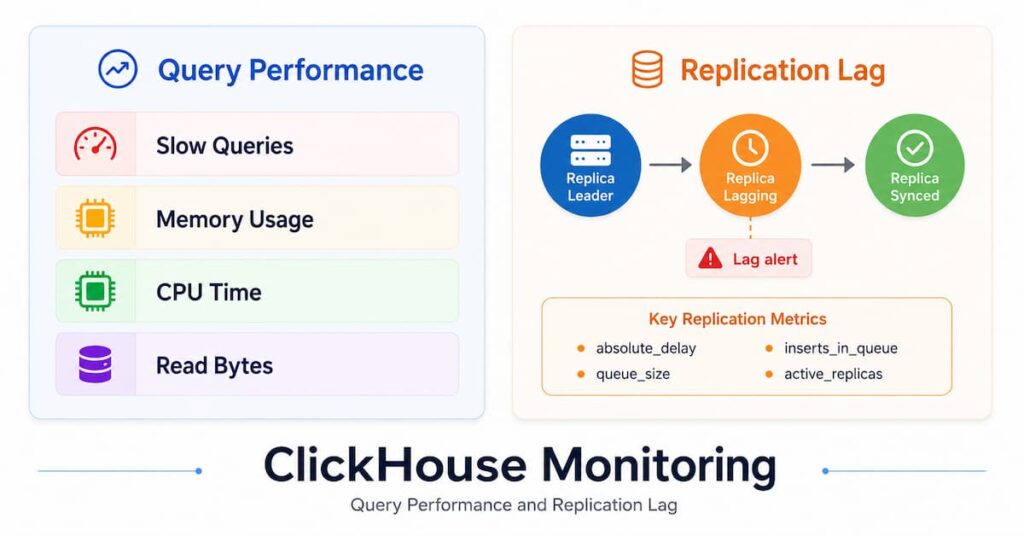
Replication queue depth shows how many parts are waiting to be replicated to follower nodes, visible in system.replication_queue. A growing queue means replicas are falling behind, often due to network issues, disk saturation on the replica, or follower node crashes. Query SELECT database, table, count() FROM system.replication_queue GROUP BY database, table to identify which tables are lagging.
Replica status is exposed in system.replicas. The is_readonly column indicates if a replica has fallen too far behind and stopped accepting writes. The total_replicas and active_replicas columns show cluster health. A mismatch between these values means some replicas are unreachable or stuck, requiring immediate investigation.
ZooKeeper or ClickHouse Keeper latency affects replication coordination. ClickHouse uses ZooKeeper or Keeper to manage distributed DDL and replication state. High latency or connection failures to the coordination service cause replication delays and failed distributed queries. Monitor ZooKeeper metrics separately using its built-in monitoring endpoints or with tools that scrape /mntr stats.
Distributed query failures occur when queries routed across shards fail due to network issues, replica unavailability, or query timeouts. These show up in system.query_log with error messages referencing distributed table engines. Monitor distributed query error rates to detect cluster-level connectivity problems early.
Infrastructure and resource utilization
ClickHouse’s performance is tightly coupled to underlying infrastructure. CPU, memory, disk, and network saturation all manifest as query slowdowns and insert failures.
CPU utilization per node should stay below 80% sustained usage. ClickHouse is CPU-intensive during query execution, especially for aggregations and joins. Monitor per-core CPU usage since ClickHouse parallelizes queries across all available cores. Single-threaded CPU bottlenecks indicate poorly parallelized queries.
Memory usage tracks resident memory consumption, visible in system.asynchronous_metrics as OSMemoryTotal and OSMemoryAvailable. ClickHouse queries can consume large amounts of memory for in-memory aggregations and hash joins. Memory exhaustion leads to OOMKills or query failures with “Memory limit exceeded” errors. Monitor both total cluster memory usage and per-query memory allocation from system.query_log.
Disk I/O and IOPS are critical for both inserts and queries. ClickHouse writes data to disk on insert and reads from disk during query execution. High disk queue depth or saturated IOPS lead to insert lag and query slowdowns. Use node-level metrics from /proc/diskstats or infrastructure monitoring agents to track disk utilization.
Network throughput matters for distributed queries and replication. Inter-node network saturation causes replication lag and distributed query timeouts. Monitor network bytes sent and received per node, and alert on sustained throughput above 70% of link capacity.
Error and exception tracking
Errors in ClickHouse often indicate schema issues, resource limits, or infrastructure failures. Many errors are logged but do not trigger automatic alerts, so explicit monitoring is required.
Query exceptions appear in system.query_log with type = ‘ExceptionWhileProcessing’. Group by exception message to identify recurring error patterns. Common exceptions include “Memory limit exceeded”, “Too many simultaneous queries”, and “Timeout exceeded”. Each points to a specific infrastructure or configuration issue.
Table-level errors are visible in system.errors. This table tracks error counts by error code, making it easy to detect when a specific error type starts spiking. For example, error code 241 (“Memory limit exceeded”) indicates undersized max_memory_usage settings or queries that need optimization.
Background task failures include failed merges, mutations, and replication tasks. These appear in system.merges, system.mutations, and system.replication_queue. A failed mutation or stuck replication task can leave a table in an inconsistent state, requiring manual intervention.
ClickHouse Monitoring Tools and Implementation
ClickHouse monitoring can be implemented using system tables directly, Prometheus and Grafana integrations, or purpose-built monitoring platforms. Each approach has trade-offs in setup complexity, operational overhead, and feature depth.
Querying system tables directly
The simplest monitoring approach is writing SQL queries against ClickHouse system tables and running them on a schedule. This requires no external tools, no metric exporters, and no additional infrastructure. Every ClickHouse cluster already has these tables enabled by default.
Query performance analysis starts with system.query_log. This table logs every query execution with duration, memory usage, rows read, and exception details. To find the slowest queries in the last hour:
SELECT

type,

event_time,

query_duration_ms,

query,

read_rows,

tables

FROM clusterAllReplicas(default, system.query_log)

WHERE event_time >= now() - INTERVAL 1 HOUR

AND type = 'QueryFinish'

ORDER BY query_duration_ms DESC

LIMIT 10

FORMAT VerticalThis query runs across all replicas in the cluster using clusterAllReplicas, ensuring you see queries executed on any node. The query_duration_ms column shows execution time in milliseconds, and read_rows indicates how many rows were scanned. High read_rows with slow duration often means missing indexes or inefficient query structure.
Replication lag detection uses system.replication_queue:
SELECT

database,

table,

count() AS queue_depth,

max(last_exception_time) AS last_error

FROM system.replication_queue

GROUP BY database, table

HAVING queue_depth > 0

ORDER BY queue_depth DESCAny result from this query indicates replication lag. A queue_depth above 10 means significant lag, and last_error timestamps show when the last replication failure occurred. Persistent replication lag requires checking disk I/O, network connectivity, and ZooKeeper health.
Part count monitoring prevents query performance degradation from excessive small parts:
SELECT

database,

table,

partition,

count() AS part_count

FROM system.parts

WHERE active = 1

GROUP BY database, table, partition

HAVING part_count > 100

ORDER BY part_count DESCAny partition with more than 100 active parts indicates merge lag. ClickHouse’s merge scheduler should keep part counts low through background merges. High part counts slow queries because each query must open and read metadata from every part.
The downside of system table queries is they require manual scheduling, log aggregation, and alert routing. Most teams eventually add an external tool to automate these queries and handle alerting.
Prometheus and Grafana integration
Prometheus is the most common tool for collecting ClickHouse metrics at scale. ClickHouse exposes a /metrics endpoint that returns Prometheus-formatted metrics generated from system tables when scraped.
To enable the Prometheus endpoint, add this to ClickHouse’s config.xml:
<prometheus>

<endpoint>/metrics</endpoint>

<port>9090</port>

<metrics>true</metrics>

<asynchronous_metrics>true</asynchronous_metrics>

<events>true</events>

</prometheus>After restarting ClickHouse, Prometheus can scrape http://clickhouse-host:9090/metrics. This endpoint includes metrics like ClickHouseProfileEvents_Query, ClickHouseMetrics_MemoryTracking, and ClickHouseAsyncMetrics_Uptime.
Grafana Labs provides a ClickHouse data source plugin that queries ClickHouse system tables directly instead of relying on Prometheus. This avoids double-storing metrics first in Prometheus, then querying from Grafana. The plugin supports SQL queries, so you can build dashboards using the same system table queries shown earlier.
Pre-built Grafana dashboards are available in the ClickHouse monitoring mix-in repository. These dashboards visualize query latency, insert throughput, merge activity, and replication health using Prometheus metrics. They are a faster starting point than building dashboards from scratch.
The trade-off with Prometheus is it adds another service to maintain. Prometheus itself needs monitoring, alerting, and storage management. For teams already running Prometheus for other infrastructure, adding ClickHouse is straightforward. For teams new to Prometheus, this approach introduces significant operational complexity.
Purpose-built monitoring platforms
Several platforms offer pre-built ClickHouse monitoring with dashboards, alerting, and minimal setup. These tools query ClickHouse system tables or scrape the Prometheus endpoint, then visualize metrics in a managed UI.
CubeAPM provides full-stack observability, including database monitoring for ClickHouse clusters. It runs on-premises inside your VPC, so no telemetry data leaves your infrastructure. CubeAPM queries ClickHouse system tables directly and correlates database metrics with application traces and logs. This unified view makes it faster to trace slow application queries back to specific ClickHouse query patterns or resource bottlenecks. CubeAPM pricing is $0.15/GB of telemetry ingested with no per-host or per-user fees, and includes unlimited retention. For teams already using CubeAPM for application monitoring, adding ClickHouse visibility requires no additional infrastructure.
Datadog offers a ClickHouse integration that collects metrics from system tables and the Prometheus endpoint. It includes pre-built dashboards for query performance, replication status, and resource utilization. Datadog’s strength is breadth it monitors ClickHouse alongside application, infrastructure, and log data in one platform. The downside is cost: Datadog pricing is per-host and per-feature, so monitoring a 20-node ClickHouse cluster can exceed $1,000 per month before ingesting any application telemetry. Datadog also queries system tables directly, which means it cannot take advantage of ClickHouse Cloud’s idle state cost savings.
Grafana Cloud provides managed Grafana and Prometheus with a ClickHouse monitoring integration. This avoids running your own Prometheus and Grafana infrastructure. Grafana Cloud pricing starts free and scales with metric volume and dashboard usage. For small clusters under 10 nodes, the free tier covers most use cases. Larger deployments require a paid plan based on active series count and dashboard queries per month.
ClickHouse Monitoring (open source) is a Next.js dashboard built specifically for ClickHouse, available at GitHub – duyet/clickhouse-monitoring. It queries system tables directly and provides a modern UI for query monitoring, cluster health, replication status, and table analytics. This project is fully open source and can be self-hosted or deployed to Cloudflare Workers. It is a good middle ground for teams that want a purpose-built dashboard without vendor lock-in.
Best Practices for ClickHouse Monitoring
Effective ClickHouse monitoring requires more than setting up dashboards. It requires aligning metrics, alerts, and response workflows with how ClickHouse actually fails in production.
Focus on actionable metrics
ClickHouse exposes hundreds of metrics. Monitoring all of them creates alert fatigue and obscures real problems. Focus on metrics that directly indicate user impact or predict imminent failure.
Query latency percentiles (p50, p95, p99) show user-experienced performance. Alert on sustained increases in p95 query duration for critical query types. A 2x increase in p95 latency means half of your slowest users are seeing significantly degraded performance.
Replication queue depth predicts replica failure. Alert when any table’s replication queue exceeds 100 entries. This catches replication lag before it causes replica read-only mode or query routing failures.
Part count per partition predicts query slowdowns. Alert when any partition exceeds 100 active parts. This gives time to investigate merge lag before query latencies degrade.
Failed query rate catches silent failures. Alert when the percentage of failed queries exceeds 1% of total queries in a 5 minute window. This detects schema mismatches, permission issues, and resource limit errors that do not trigger other alerts.
Avoid alerting on raw resource usage like CPU or memory unless it predicts failure. High CPU usage during a batch processing window is expected. High CPU usage during a low-query period is not. Context matters more than thresholds.
Correlate metrics across layers
ClickHouse performance issues often span multiple layers: application query patterns, ClickHouse query execution, storage I/O, and network throughput. Monitoring each layer in isolation makes root cause analysis slower.
When query latencies increase, check these correlated metrics in sequence:
- Active merges and part count from system.merges and system.parts
- Disk I/O utilization and queue depth from node-level metrics
- Memory usage from system.asynchronous_metrics
- Replication queue depth from system.replication_queue
- Network throughput to and from each node
This sequence isolates whether the problem is merge contention, disk saturation, memory pressure, replication lag, or network congestion. Tools that unify these metrics in one view like CubeAPM, Datadog, or synthetic monitoring tools reduce investigation time from minutes to seconds.
Set up proactive health checks
ClickHouse’s built-in health check endpoint is /ping, which returns 200 OK if the server is running. This endpoint does not validate query execution, replication health, or data integrity. It only confirms the HTTP server is alive.
A better health check queries a test table:
SELECT count(*) FROM system.oneThis validates that the ClickHouse server can execute queries and access system tables. Run this check every 30 seconds from an external monitoring service. Any failure indicates the server is unresponsive or misconfigured.
For replicated clusters, check replication status on every replica:
SELECT

database,

table,

is_readonly,

total_replicas,

active_replicas

FROM system.replicas

WHERE active_replicas < total_replicasAny result means at least one replica is unreachable or out of sync. Alert immediately and route to on-call engineers, since replica failures often cascade into widespread query timeouts.
Tune retention and aggregation
ClickHouse query logs grow quickly. A cluster handling 10,000 queries per minute generates 600,000 log entries per hour, consuming gigabytes of disk space in system.query_log. Without retention limits, query log tables fill disks and slow down monitoring queries.
Set query log retention in config.xml:
<query_log>

<database>system</database>

<table>query_log</table>

<partition_by>toYYYYMM(event_date)</partition_by>

<ttl>event_date + INTERVAL 30 DAY</ttl>

</query_log>This keeps 30 days of query logs and automatically drops older partitions. For long-term trend analysis, aggregate query metrics into a summary table:
CREATE TABLE system.query_summary

(

date Date,

hour UInt8,

query_type String,

p50_duration_ms UInt64,

p95_duration_ms UInt64,

p99_duration_ms UInt64,

total_queries UInt64,

failed_queries UInt64

)

ENGINE = MergeTree

PARTITION BY toYYYYMM(date)

ORDER BY (date, hour, query_type)Populate this table hourly using a scheduled query that aggregates system.query_log. This reduces storage requirements by 100x while preserving trend data for capacity planning and long term performance analysis.
Automate responses where possible
Many ClickHouse issues have predictable fixes that can be automated. Instead of waking an engineer to manually intervene, script common responses and trigger them from alerts.
Restart stuck replication when replication queue depth exceeds a threshold and has not decreased in 10 minutes. This often resolves transient network issues or ZooKeeper connection problems without manual intervention.
Kill long-running queries that exceed a predefined duration threshold. ClickHouse allows setting max_execution_time per query, but queries with no limit set can run indefinitely and block resources. A monitoring script can query system.processes and kill any query exceeding 10 minutes using KILL QUERY WHERE query_id = ‘…’.
Trigger manual merges when part counts exceed safe limits. ClickHouse’s automatic merge scheduler handles most cases, but sometimes manual intervention is needed. Schedule a maintenance job that runs OPTIMIZE TABLE table_name FINAL during low-traffic windows to force part consolidation.
Automating these responses reduces time to resolution from minutes to seconds and prevents escalations for issues that do not require human judgment.
Disclaimer: The information in this article reflects the latest details available at the time of publication and may change as technologies and products evolve. Features, pricing, and plan limits can change over time. Always verify the latest information directly with the vendor before making purchasing or deployment decisions.
FAQs
What is the difference between ClickHouse monitoring and ClickHouse observability?
Monitoring tracks predefined metrics like query duration, replication lag, and CPU usage. Observability adds the ability to ask arbitrary questions about system behavior after an incident using logs, traces, and high-cardinality metrics. ClickHouse monitoring tells you that query latency increased. Observability lets you drill into which specific queries slowed down, which tables they queried, and what changed in the infrastructure at that time.
How do I monitor ClickHouse in Kubernetes?
ClickHouse running in Kubernetes requires monitoring both ClickHouse-specific metrics and Kubernetes infrastructure. Query ClickHouse system tables as usual, but also monitor pod resource usage, node pressure, and persistent volume performance. Use a Kubernetes-native monitoring tool or deploy the ClickHouse Prometheus exporter as a sidecar container. Alert on pod restarts, OOMKills, and disk full conditions separately from ClickHouse query metrics.
Can I use ClickHouse itself to store monitoring metrics?
Yes. ClickHouse is well suited for storing time series metrics and log data. Many teams use ClickHouse as the storage backend for Prometheus or Grafana instead of Prometheus’s built-in TSDB. This works well for long term metric retention and reduces infrastructure complexity. The trade-off is ClickHouse becomes a single point of failure if monitoring data is stored in the same cluster being monitored. Best practice is to send metrics to a separate ClickHouse cluster dedicated to observability data.
What causes high replication queue depth in ClickHouse?
Replication queue depth grows when follower replicas cannot apply changes as fast as the leader produces them. Common causes include network bandwidth limits between nodes, disk I/O saturation on follower nodes, ZooKeeper or Keeper connection instability, and large batch inserts that create many new parts faster than replicas can fetch and merge them. Check network throughput, disk queue depth, and ZooKeeper latency when replication lag appears.
How do I monitor ClickHouse Keeper?
ClickHouse Keeper exposes metrics through a Prometheus endpoint on port 9181 by default. Key metrics include keeper_outstanding_requests, keeper_approximate_data_size, and keeper_packets_sent. Monitor Keeper separately from ClickHouse nodes since Keeper failures cause replication and distributed DDL to stop working across the entire cluster. Alert on Keeper node downtime, high request latency, and low free disk space on Keeper data volumes.
What is the difference between system.metrics and system.asynchronous_metrics?
system.metrics contains counters and gauges that update synchronously as ClickHouse processes queries. These metrics reflect real time state like active queries, running merges, and current memory usage. system.asynchronous_metrics contains metrics calculated periodically in the background such as CPU temperature, disk free space, and OS-level statistics. Query system.metrics for immediate operational state and system.asynchronous_metrics for infrastructure health and capacity planning.
How often should I scrape ClickHouse metrics?
Scrape interval depends on alert sensitivity and query load. For high-traffic clusters, scrape every 15 seconds to catch short-lived anomalies. For low-traffic clusters, scrape every 60 seconds to reduce monitoring load. Avoid scraping faster than 10 seconds unless you need sub-minute alert resolution, as frequent scrapes add CPU and network load to the ClickHouse server. If scraping adds noticeable load, increase the interval or use system table queries instead of the Prometheus endpoint.