PostgreSQL monitoring tools help you identify slow queries, track replication lag, and pinpoint I/O bottlenecks in real-time, ensuring reliable and high-performance database systems at scale.
Yet choosing the right tool remains challenging as most APM vendors charge per host and GB ingested, impose strict data-retention limits, and offer limited query-level visibility. CubeAPM is the best PostgreSQL monitoring tool provider, built for modern, cloud-native architectures. It offers full-stack observability, unlimited retention, self-hosting, and native Postgres query plan insights, at a transparent rate.
In this article, we’ll explore some PostgreSQL monitoring tools.
10 Best PostgreSQL Monitoring Tools
- CubeAPM
- Datadog
- New Relic
- Dynatrace
- pganalyze
- pgDash
- Percona Monitoring & Management (PMM)
- Prometheus + Grafana (postgres_exporter)
- SolarWinds Database Performance Analyzer (DPA)
- Nagios Core
What is a PostgreSQL Monitoring Tool?
PostgreSQL is an advanced, open-source relational database known for its reliability, ACID compliance, and extensibility — powering millions of transactional and analytical workloads globally.
A PostgreSQL monitoring tool helps teams continuously observe and analyze the performance of their PostgreSQL clusters by tracking key metrics like slow queries or query latency, cache hit ratios, replication lag, and I/O throughput. These tools turn raw database telemetry into actionable insights that enable DevOps, SRE, and DBA teams to optimize query performance, reduce downtime, and improve application responsiveness.
For modern businesses, PostgreSQL monitoring tools are indispensable because they provide:
- Real-time visibility: Detect long-running queries, deadlocks, or failed transactions before they cascade into outages.
- Predictive scaling: Analyze historical performance trends to plan compute, memory, and storage scaling efficiently.
- Faster root-cause analysis: Correlate metrics, traces, and logs across database and application layers to pinpoint issues instantly.
- Cost and compliance optimization: Identify inefficient queries or idle replicas to reduce compute waste while ensuring GDPR/HIPAA-ready audit trails.
- Unified observability: Connect PostgreSQL metrics with infrastructure, logs, and synthetic tests for a complete MELT (Metrics, Events, Logs, Traces) view.
Modern observability platforms like CubeAPM go beyond basic monitoring — offering OpenTelemetry-native instrumentation, full-stack tracing, error tracking, and synthetic monitoring through a single unified interface.
Example: Query Latency Optimization in PostgreSQL with CubeAPM
Imagine a fintech company noticing intermittent API slowdowns during transaction spikes. Using CubeAPM’s PostgreSQL monitoring, the team can instantly visualize query response times, connection pool saturation, and transaction locks under heavy load. Through CubeAPM’s trace waterfall view, engineers identify a slow JOIN query consuming 80% of CPU time. The Logs Monitoring dashboard correlates the same event with disk I/O spikes, confirming the root cause. Within minutes, the team optimizes the query and redeploys, verified through CubeAPM’s Synthetic Monitoring to ensure consistent performance.
By combining query-level visibility, infrastructure correlation, and real-time alerts, CubeAPM empowers teams to prevent costly downtime, achieve predictable performance, and maintain observability without the pricing complexity of legacy APM vendors.
Why Teams Choose Different PostgreSQL Monitoring Tools
Cost Predictability and Data Retention
PostgreSQL environments generate vast telemetry—query stats, WAL logs, and replication data—that quickly inflate costs with per-host or per-GB pricing. Users on Reddit and G2 report that legacy APM tools like Datadog and New Relic become expensive as data scales, especially when extended retention is needed for debugging. Teams now prefer transparent, flat-rate tools like CubeAPM, which offer unlimited retention without unpredictable overages.
Deep PostgreSQL Insights and Query Plan Tracking
Generic monitors surface CPU and connection metrics but lack visibility into PostgreSQL’s internal mechanics. DBAs need data from pg_stat_statements, index usage, autovacuum runs, and query plan changes to truly optimize performance. Platforms like CubeAPM, Percona PMM, and pganalyze deliver query-level views that help detect inefficient joins, missing indexes, and bloat in seconds, aligning with pganalyze’s recommendation for query-centric monitoring.
Replication, High Availability, and Failover Readiness
High-availability PostgreSQL setups rely on real-time visibility into replication lag, WAL activity, and slot health. Standard tools often alert too late, as users note on Stack Overflow. Modern solutions like CubeAPM and Percona PMM provide replication dashboards, failover alerts, and trend analytics to detect desync early and prevent downtime.
OpenTelemetry-First Approach and Vendor Flexibility
Organizations increasingly demand OpenTelemetry-native monitoring to avoid vendor lock-in and unify pipelines. The CNCF 2025 survey shows 67% of enterprises standardizing OTEL for databases and apps. Tools like CubeAPM natively ingest OTEL metrics and traces, integrating seamlessly with existing observability stacks while ensuring flexibility across environments.
Strong Correlation Across MELT and Multi-Cloud Control
PostgreSQL slowdowns often stem from upstream causes like I/O throttling or app-level latency. Teams value tools that unify Metrics, Events, Logs, and Traces for faster root-cause analysis. CubeAPM connects query traces with infrastructure and application metrics while supporting self-hosted or SaaS deployments—offering full data-locality control for multi-cloud PostgreSQL clusters.
10 Best PostgreSQL Monitoring Tools
1. CubeAPM
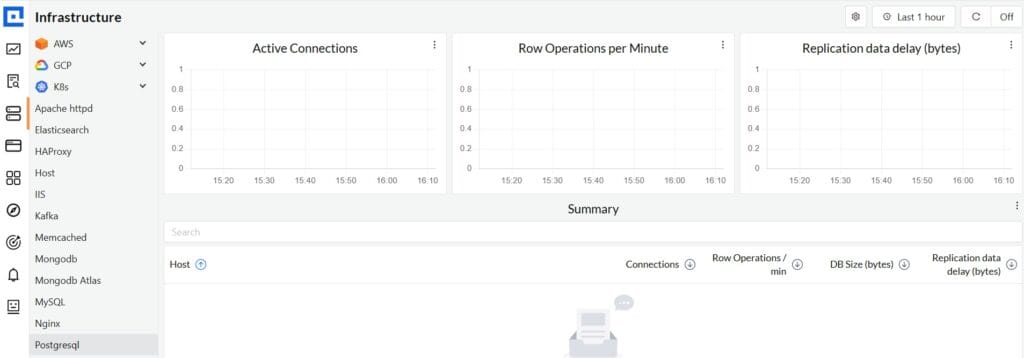
Overview
CubeAPM is an OpenTelemetry-native observability platform known for providing full MELT (Metrics, Events, Logs, Traces) visibility across cloud-native applications and databases like PostgreSQL. It’s designed for engineering teams that want complete transparency, predictable pricing, and deep database insight without vendor lock-in. With native PostgreSQL instrumentation, CubeAPM correlates query latency, connection saturation, and replication metrics with infrastructure and application traces in a single view—making it one of the most comprehensive yet cost-efficient APMs in the 2025 market.
Key Advantage
Complete PostgreSQL observability—combining query-level tracing, metric visualization, and log correlation in one platform.
Key Features
- Query-Level Monitoring: Captures slow queries, execution time, and lock activity from PostgreSQL for in-depth performance analysis.
- Autovacuum and Bloat Insights: Tracks autovacuum cycles, index bloat, and table size trends to maintain storage health.
- Replication Lag Tracking: Monitors replication delay, WAL write frequency, and failover events to ensure high availability.
- Connection Pool Analysis: Observes connection saturation and idle time to optimize resource allocation.
- Integrated Traces and Logs: Correlates database queries with upstream application spans and container logs for faster root-cause detection.
Pros
- OpenTelemetry-native and compatible with Prometheus and Grafana
- Unlimited data retention with transparent pricing
- Real-time dashboards for query and infrastructure metrics
- Supports SaaS, self-hosted, and BYOC deployments
- Responsive Slack/WhatsApp support with developer-level assistance
Cons
- Less ideal for teams seeking strictly off-prem monitoring without self-management
- Focused on observability and doesn’t include cloud security or compliance scanning
CubeAPM Pricing at Scale
CubeAPM uses a transparent pricing model of $0.15 per GB ingested. For a mid-sized business generating 45 TB (~45,000 GB) of data per month, the monthly cost would be ~$7,200/month*.
*All pricing comparisons are calculated using standardized Small/Medium/Large team profiles defined in our internal benchmarking sheet, based on fixed log, metrics, trace, and retention assumptions. Actual pricing may vary by usage, region, and plan structure. Please confirm current pricing with each vendor.
Tech Fit
Ideal for organizations running PostgreSQL on Kubernetes, AWS RDS, or hybrid environments. Works seamlessly with Java, Python, Node.js, Go, and Ruby backends, and integrates easily into existing observability stacks through OpenTelemetry Collectors and over 800 supported integrations.
2. Datadog
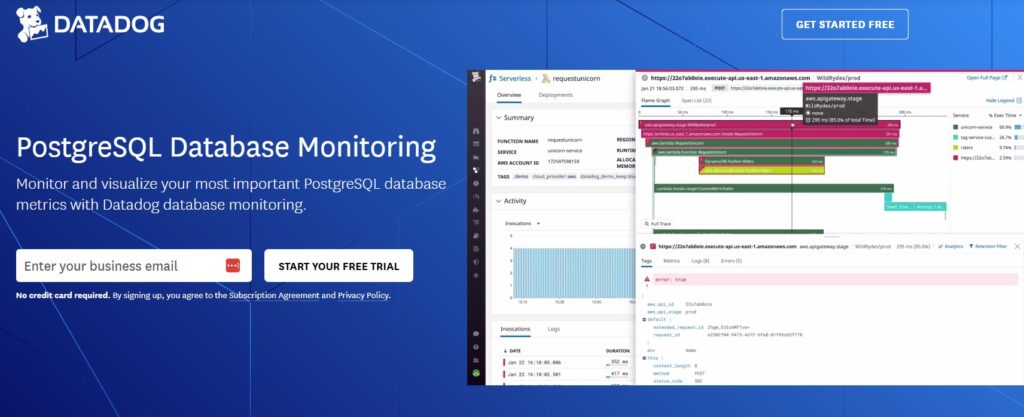
Overview
Datadog pairs its PostgreSQL integration with Database Monitoring (DBM) to give engineers query-level visibility (live and historical samples, normalized queries) plus classic health metrics in one UI. DBM adds explain plans, wait events, database load, and blocking insight on top of the base Postgres integration—so teams can go from an alert to the exact slow statement quickly across self-hosted Postgres and managed services (RDS, Aurora, Cloud SQL, AlloyDB).
Key Advantage
Unified query analytics for PostgreSQL—live/historical query samples with EXPLAIN plans, wait events, and blocking analysis directly in Datadog DBM.
Key Features
- Query Samples & EXPLAIN: Capture live and historical samples with execution plans to pinpoint regressions fast.
- Wait Events & Blocking: Surface lock waits and blocking sessions alongside database load to shorten RCA.
- pg_stat_statements Metrics: Leverage pg_stat_statements for normalized query metrics and performance baselines.
- Replication & Events Visibility: Track database states, failovers, and events for HA awareness.
- Fleet Monitoring & Autodiscovery: One agent can monitor multiple DB hosts and auto-discover databases per host.
Pros
- Mature ecosystem with 1,000+ integrations for broad correlation
- Deep Postgres query analytics via DBM (plans, waits, blocking)
- Supports self-hosted Postgres and managed clouds (RDS, Aurora, Cloud SQL, AlloyDB)
- Rich dashboards, alerting, and recommended agent architectures for scale
Cons
- Pricing spans multiple SKUs; DBM billed per database host while logs and APM have separate ingestion or host costs
- SaaS-based’ no self-hosting
Datadog Pricing at Scale
Datadog charges differently for different capabilities. DBM is billed per database host at $70/host/month (annual); APM starts at $31/month; infra starts at $15/month; logs start at $0.10/GB, and so on.
For a mid-sized business ingesting around 45 TB (~45,000 GB) of data per month, the cost would come around $27,475/month*. Plus, for 10 hosts, DBM cost will be: 10 hosts × $70 = $700.
Tech Fit
Best for teams that want query-centric PostgreSQL monitoring integrated with a broader Datadog stack: self-hosted Postgres or AWS RDS/Aurora, GCP Cloud SQL, AlloyDB, and app backends in Java, Python, Node.js, Go, .NET, Ruby when paired with Datadog APM for cross-layer correlation.
3. New Relic
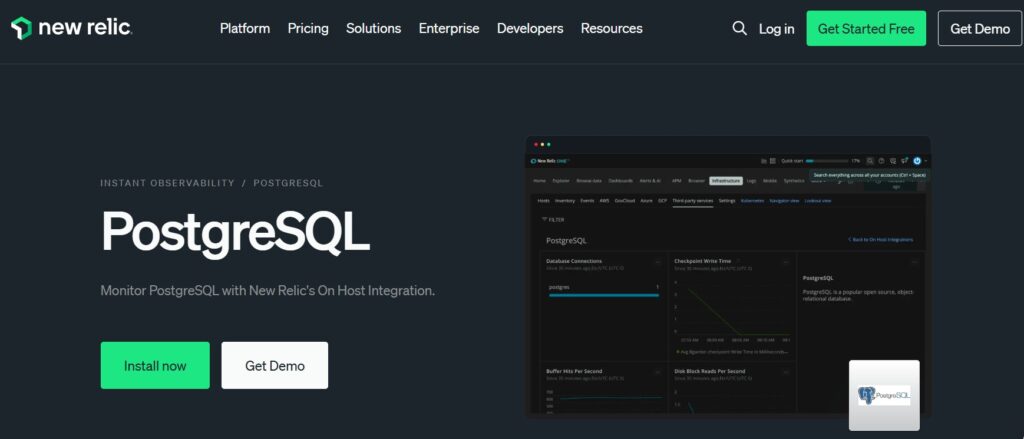
Overview
New Relic combines its PostgreSQL on-host integration with Database Performance Monitoring to surface query-level details—slow query analysis, wait types, and execution plans—alongside classic instance, database, and cluster metrics. You can enable query monitoring (via pg_stat_statements) and collect table/index metrics, then visualize everything in prebuilt dashboards or NRQL. Managed Postgres on Azure is also covered through a native integration that brings service metrics like replication lag into New Relic.
Key Advantage
Query-centric visibility for PostgreSQL (slow query analysis, wait types, and execution plans) directly in the APM UI.
Key Features
- Query samples & EXPLAIN: Capture slow statements and execution plans to spot regressions quickly.
- Wait types & blocking: See lock waits and blocking chains next to database load to speed root-cause analysis.
- pg_stat_statements support: Enable query monitoring and normalized metrics with proper roles/permissions.
- Managed Postgres coverage: Pull Azure Database for PostgreSQL metrics (including replica lag) with polling and dashboards.
- Custom collection controls: Fine-tune what’s ingested (databases/schemas/tables/indexes) via postgresql-config.yml.
Pros
- Mature platform with 50+ capabilities and 700+ integrations for broad correlation
- Deep query analysis with waits and plans inside APM
- Covers self-hosted Postgres plus Azure Database for PostgreSQL
- Quickstart dashboards to accelerate setup
Cons
- Pricing mixes per-GB ingest with user or compute access, so costs can rise at higher data volumes
- No self-hosting; SaaS-only
New Relic Pricing at Scale
New Relic’s billing is based on data ingested, user licenses, and optional add-ons. The free tier offers 100 GB of ingest per month, then it costs $0.40 per GB after that. For a business ingesting 45 TB of logs per month, the cost would come around $25,990/month*.
Tech Fit
Best for teams already standardized on New Relic APM who want PostgreSQL query analytics tied to app traces and infra signals; supports self-hosted Postgres and Azure Database for PostgreSQL (plus other clouds through on-host or cloud integrations), and common backends like Java, .NET, Node.js, Python, Go, Ruby, PHP.
4. Dynatrace
Overview
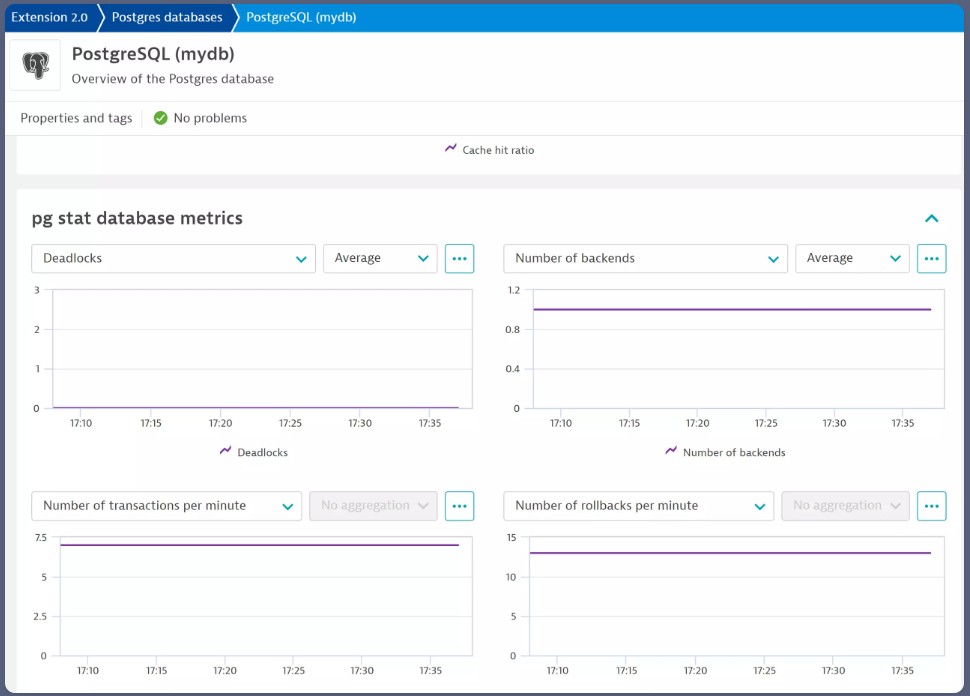
Dynatrace monitors PostgreSQL via its PostgresDB remote monitoring extension (deployed on ActiveGate) and analyzes the resulting telemetry with Davis AI for anomaly and problem detection. The extension collects detailed Postgres internals—background writer, WAL, locks, activity states, replication lag—and can ingest top queries and even execution plans, so teams can move from an availability alert to a specific SQL statement and plan in a few clicks.
Key Advantage
AI-assisted PostgreSQL observability with rich internals (WAL, replication, locks) plus automated top-query capture and optional execution-plan retrieval.
Key Features
- EF2.0 remote extension: Polls PostgreSQL through ActiveGate and surfaces instance, database, and tablespace health in curated dashboards.
- WAL & checkpoint visibility: Tracks WAL generation, sync/write times, and checkpoint behavior to spot I/O stress and tuning gaps.
- Replication & lock metrics: Monitors replay/flush/write lag and lock counts to prevent blockers and replica drift.
- Top queries & execution plans: Ingests top queries (via pg_stat_statements/pg_stat_activity) and can fetch EXPLAIN (JSON) plans for statement analysis.
- Davis AI correlation: Automatically flags anomalies and relates Postgres issues to host, container, and service problems for faster RCA.
Pros
- Deep PostgreSQL metric coverage including WAL, replication, and background writer
- Automated anomaly detection with Davis AI and guided problem context
- Strong estate visibility when you already use Dynatrace for apps and infra
- Flexible dashboards, notebooks, and alerting built on Grail data
Cons
- Pricing spans multiple units (GiB-hour hosts, metric points, logs/traces ingest), which can be complex at scale
- Steep learning curve for new users, particularly
Dynatrace Pricing at Scale
- Full stack: $0.01/8 GiB hour/month or $58/month/8GiB host
- Log Ingest & process: $0.20 per GiB
For a similar 45 TB (~45,000 GB/month) volume, the cost would be $21,850/month*.
Tech Fit
A strong fit for enterprises already standardized on Dynatrace that want PostgreSQL internals + AI-assisted problem detection tied to full-stack context. Works across self-hosted PostgreSQL (v11+) and managed clouds (e.g., RDS/Aurora) and pairs well with containerized/Kubernetes environments where you want Postgres insights alongside service and infrastructure observability.
5. pganalyze
Overview
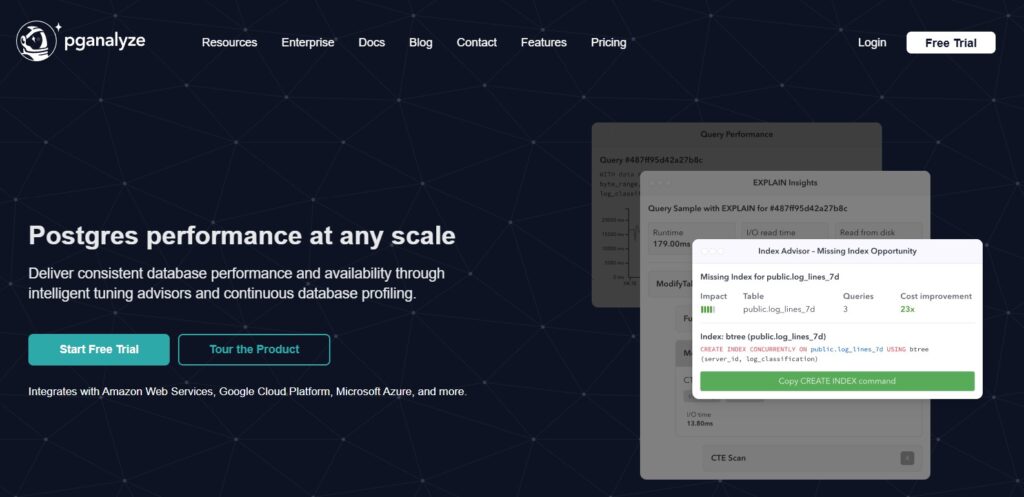
pganalyze is a PostgreSQL-specialist platform built for query tuning and deep database forensics. It focuses on the internals that DBAs live in every day—pg_stat_statements, EXPLAIN plans, autovacuum/bloat signals, wait events, and connection activity—then layers advisors (Index, VACUUM, Config) and log insights to help you move from symptom to fix with minimal guesswork. It’s available as a hosted service or as an enterprise deployment you can run in your own environment.
Key Advantage
Expert-level query tuning workflow—normalized query history, plan visualization, and advisors that translate Postgres internals into concrete fixes.
Key Features
- Query Performance History: Maintain normalized query histories with timing/I/O to spot regressions quickly.
- EXPLAIN & Plan Visualization: Capture and visualize EXPLAIN (JSON), including costly nodes and row estimates, for fast diagnosis.
- Index & VACUUM Advisors: Receive concrete recommendations for new or improved indexes and vacuum/autovacuum tuning.
- Wait Events & Locks: Inspect blocking chains and wait events from pg_stat_activity to resolve contention.
- Log Insights with PII Controls: Triage Postgres log events (errors, deadlocks, checkpoints) with guardrails for sensitive data.
Pros
- Purpose-built for PostgreSQL with deep internals coverage
- Clear tuning guidance via Index, VACUUM, and Query Advisors
- Works across self-hosted Postgres and managed services
- Enterprise option for on-prem or private cloud deployments
Cons
- Not a full-stack observability solution
- Setup difficulty
- Learning curve
pganalyze Pricing at Scale
pganalyze is priced per database server (Production: $149/month for 1 server; Scale: $399/month includes 4 servers, then $100/month per additional billable server). The Scale plan includes a 30-day history and Log Insights with ~1 GB/day per server included.
For a mid-sized fleet of 10 Postgres servers, that’s roughly $999/month ($399 + 6×$100). However, if your organization ingests 45 TB (45,000 GB) of Postgres logs/telemetry monthly, the included Log Insights quota would be far exceeded, and you’d typically rely on an external log pipeline or talk to sales for Enterprise terms.
Tech Fit
A great fit for teams that live inside PostgreSQL and want precise query tuning and advisor-driven guidance across self-managed Postgres, AWS RDS/Aurora, Azure Database for PostgreSQL, and Kubernetes-hosted workloads. Ideal for DBAs/SREs who already have an app/infra observability stack and need a Postgres-first performance companion.
6. pgDash
Overview
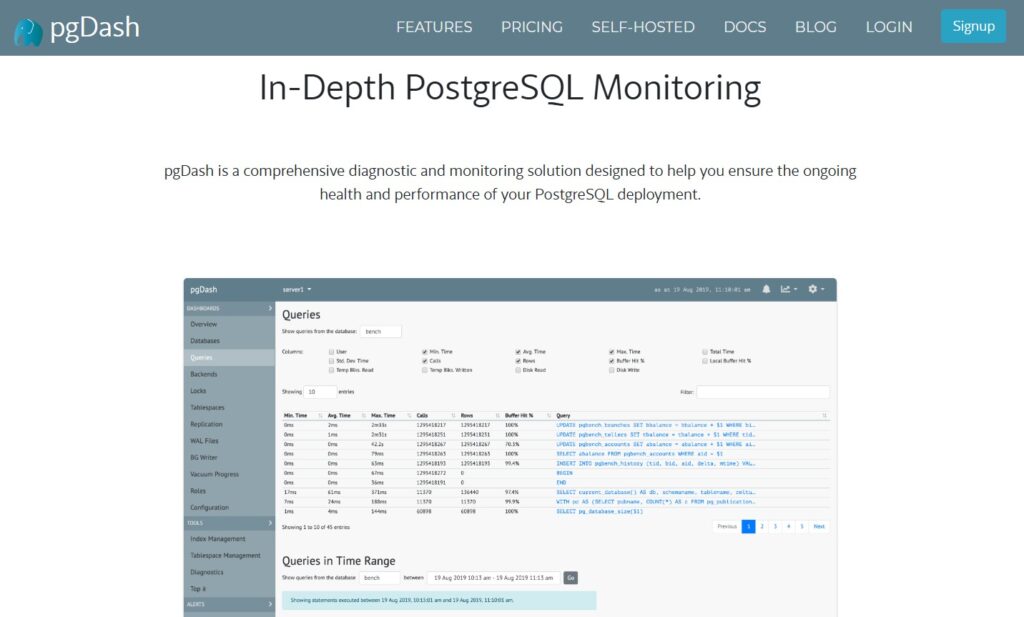
pgDash is a PostgreSQL-focused monitoring and diagnostics platform built by RapidLoop (creators of pgmetrics). It’s known for surfacing the internals Postgres engineers care about—locks and backends, query performance with plan visuals, replication health, bloat, and tablespace usage—through curated dashboards, alerts, and team-friendly workflows in SaaS or self-hosted form.
Key Advantage
PostgreSQL-first diagnostics with execution-plan visualization, lock/backends analysis, and replication insight in one place.
Key Features
- Query diagnostics & plans: Time-series for queries plus EXPLAIN (JSON) with visualizations and improvement suggestions.
- Locks & backends tracking: See who’s waiting on whom; spot long-running or idle-in-transaction sessions.
- Replication monitoring: Track primary/standby lag, physical/logical slot health, and recovery progress.
- Index & tablespace management: Identify unused/bloated indexes; manage tablespace growth and generate SQL to reorganize.
- Alerts & Change Alerts: Threshold alerts plus automatic notifications for schema/data-shape changes (e.g., new users/tables/indexes).
Pros
- Purpose-built for PostgreSQL with deep internals coverage
- SaaS and self-hosted options with team sharing and access controls
- Clear replication, bloat, and tables/index visibility for day-to-day DBA work
- Notification channels like email, Slack, PagerDuty via alerting/Change Alerts
Cons
- Not a full-stack observability platform with distributed tracing or app-level spans
- Limited log handling; large log/trace retention typically requires pairing with another system
pgDash Pricing at Scale
pgDash is priced by PostgreSQL server count, not by GB of data. Plans show Basic ($100/mo) for 2 servers, Pro ($200/mo) for 5 servers with $50 per additional server, and Enterprise (20+) via sales; self-hosted is priced similarly on an annual term. Billing is based on the maximum concurrent servers you monitor, where a “server” maps to a Postgres cluster/RDS instance.
For a mid-sized estate with 10 Postgres servers, Pro would be $200 + (5 × $50) = $450/month. The scenario of ingesting 45 TB (45,000 GB) of database telemetry doesn’t change pgDash cost (it’s not GB-metered).
Tech Fit
Best for teams that want PostgreSQL-centric monitoring across self-managed clusters or cloud instances (including RDS/Aurora), with actionable views into queries, locks, replication, bloat, and tablespaces; available as SaaS or self-hosted to match residency or control requirements.
7. Percona Monitoring & Management (PMM)
Overview
PMM is Percona’s open-source database monitoring and management platform with first-class PostgreSQL coverage. It ships curated Postgres dashboards, Query Analytics (QAN), and deep internals via pg_stat_monitor, giving DBAs a clear window into slow queries, wait events, replication health, and storage pressure across self-hosted or cloud Postgres fleets.
Key Advantage
PostgreSQL-specialist telemetry with QAN + pg_stat_monitor for rich query forensics and long-horizon performance history.
Key Features
- Query Analytics (QAN): Normalized queries, timing/I/O histograms, and drill-downs to spot regressions quickly.
- pg_stat_monitor integration: Enhanced query grouping and per-bucket stats beyond pg_stat_statements for clearer outliers.
- Replication & WAL dashboards: Lag, slot health, WAL generation/sync/write timings to catch HA risks early.
- Autovacuum & bloat insight: Track autovacuum cadence, table/index bloat, and checkpoint behavior to prevent slowdowns.
- Alerting & annotations: Threshold alerts and change notes to tie performance shifts to releases or config changes.
Pros
- Open source with no license fees
- Deep PostgreSQL internals and QAN for query-centric tuning
- Works across self-managed Postgres and cloud (e.g., RDS)
- Mature deploy model with Grafana/Prometheus under the hood
Cons
- You operate and scale the monitoring stack yourself
- Not a full application observability suite with distributed tracing
PMM Pricing at Scale
PMM software is open source with no licensing fees; you pay only your own infrastructure and storage. For a mid-sized company generating 45 TB (45,000 GB) of PostgreSQL telemetry monthly, PMM’s software cost remains $0, but you should budget for servers, storage, and ops time.
Tech Fit
Ideal for teams that want self-hosted, Postgres-first monitoring with precise query tuning, replication visibility, and long-term diagnostics—across bare-metal, VMs, Kubernetes, and cloud Postgres (including RDS/Aurora)—and that are comfortable running the observability stack in-house.
8. Prometheus + Grafana (postgres_exporter)
Overview
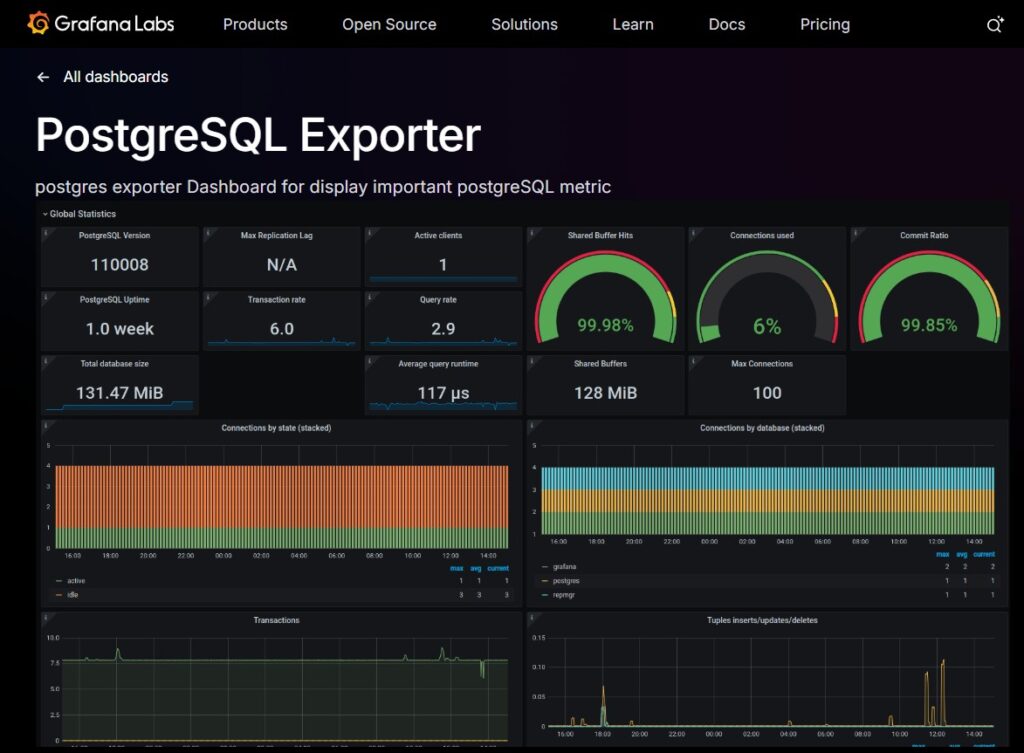
This classic open-source stack pairs the postgres_exporter for Prometheus with Grafana dashboards to surface PostgreSQL internals in real time. You collect metrics straight from Postgres—connections, locks, WAL/checkpoints, replication lag, cache hit ratios, deadlocks—and visualize them with curated dashboards from Grafana’s library. It’s popular with teams that want maximum control, Kubernetes-first deployments, and a no-license approach to Postgres monitoring.
Key Advantage
Highly customizable PostgreSQL metrics pipeline with rich, community-tested Grafana dashboards and alerting you can tailor to your SLOs.
Key Features
- Exporter-based metrics: Collect QPS, tuples read/returned/updated, cache hit ratio, deadlocks, temp files, and long-running queries.
- Replication & WAL visibility: Track write/replay/flush lag, WAL generation, and checkpoint timings to protect HA.
- Locks & sessions: Monitor blocking chains, idle-in-transaction backends, and connection saturation.
- Dashboards & rules: Use prebuilt Grafana dashboards, recording rules, and alerting best practices out of the box.
- Kubernetes friendly: Helm charts and operators make it straightforward to run at cluster scale.
Pros
- Open source, no license fees
- Deep PostgreSQL metric coverage via exporter and community dashboards
- Works great in Kubernetes and hybrid estates
- Flexible alerting and data retention strategies you control
Cons
- DIY setup and ongoing maintenance of Prometheus, Alertmanager, and Grafana
- Setup can be complex
- If you choose Grafana Cloud, logs/traces incur separate usage fees
Prometheus + Grafana Pricing at Scale
Self-hosted Prometheus/Grafana has no software license cost; you pay for your own infrastructure and storage. If you opt for Grafana Cloud, pricing is usage-based (Pro plan adds a $19/month platform fee).
Key list prices: Metrics at $6.50 per 1k active series, Logs/Traces/Profiles at $0.50 per GB ingested. The free tier includes helpful allowances (e.g., 10k series, 50 GB logs/traces/profiles, 2,232 host hours, 37,944 container hours).
For the mid-sized scenario of 45 TB data ingestion, teams may have to pay $11,875/month*.
Tech Fit
Ideal for platform teams standardizing on Prometheus/Grafana who need PostgreSQL-first metrics in Kubernetes or hybrid environments, and who are comfortable operating the stack. Pairs well with app backends in Java, Go, Node.js, Python, .NET, Ruby and managed Postgres like RDS/Aurora, when you prefer open tooling and custom workflows.
9. SolarWinds Database Performance Analyzer (DPA)
Overview
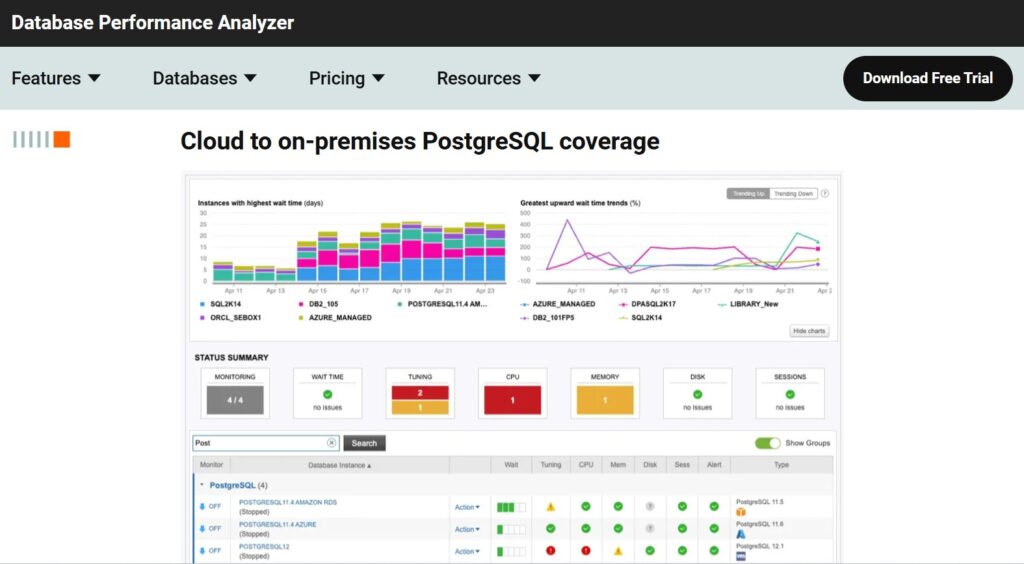
SolarWinds DPA focuses on PostgreSQL performance tuning through continuous workload analysis, isolating the SQL, wait events, and resource contention that drive latency. It’s agentless, supports self-managed and managed Postgres (RDS, Aurora, Azure, Cloud SQL), and provides advisors for tables, indexes, and configuration so DBAs can move from symptoms to specific fixes with low overhead. SolarWinds also offers Database Observability in its SaaS platform for instance-level health and query analytics.
Key Advantage
Wait-time analytics that tie PostgreSQL query slowdowns to concrete wait events, enabling precise tuning and faster resolution.
Key Features
- Workload & Wait Analysis: Attribute latency to waits (locks, I/O, CPU) to pinpoint the true cause of slow queries.
- Query & Plan Visibility: Capture problem statements and execution plans to validate indexes and spot regressions quickly.
- Advisors & Recommendations: Table and index advisors suggest concrete tuning actions for Postgres schemas.
- Replication & Instance Health: Track replica lag, background writer, checkpoints, and storage pressure trends.
- Fleet Onboarding: Register many databases at once via mass registration or API to scale coverage across environments.
Pros
- Agentless with low overhead and quick time-to-value
- Strong query diagnostics centered on wait events
- Table/index advisors accelerate practical tuning
- Supports self-managed and cloud PostgreSQL (RDS, Aurora, Azure, Cloud SQL)
Cons
- Broader observability (logs/traces) requires pairing with other SolarWinds modules
- Pricing spans different products and units, which can be complex for mixed deployments
SolarWinds Pricing at Scale
Two official options are common for PostgreSQL monitoring:
DPA: listed from $1,699 (license pricing shown on the DPA product page). Costs don’t depend on GB ingested, but you’ll license per environment and budget for infrastructure.
SolarWinds Observability: Database Observability at $70 per database instance/month; if you also ship logs, Log Observability is $5/GB, $12 per host per month for infra, and $27.5 per service for APM. For a mid-sized company, the cost for APM and infra would be:
- APM: $27.5 x 125 (hosts) = $3,437.5
- Infra: $12 x 200 (hosts) = $2,400
Tech Fit
Best for DBA teams prioritizing query tuning and wait-based diagnostics on PostgreSQL across self-managed and cloud estates. Works well when you want agentless analysis and built-in advisors; if you also need end-to-end MELT correlation and large-volume log retention, pairing with a platform like CubeAPM provides a simpler, lower-cost path at high data volumes.
10. Nagios Core
Overview
Nagios Core is the open-source engine behind Nagios, widely used for infrastructure and service health checks, including PostgreSQL. With community plugins like check_postgres and built-in wizards available in the commercial Nagios XI, teams can track database availability, connection latency, replication lag, locks, and storage thresholds. It’s a pragmatic choice when you already standardize on Nagios for servers and networks and want PostgreSQL status and thresholds folded into the same alerting workflows.
Key Advantage
Extensible PostgreSQL health and availability monitoring using proven Nagios checks and plugins across heterogeneous estates.
Key Features
- Connectivity & Latency: Verify PostgreSQL is reachable and measure connect/query response time to catch outages early.
- Replication Monitoring: Check streaming replication state and lag to protect HA and failover readiness.
- Locks & Sessions: Alert on blocking chains, idle-in-transaction backends, and backend connection saturation.
- Storage & Bloat Thresholds: Track database size, tablespace growth, and bloat indicators to prevent space-related incidents.
- Config Wizards (via XI): Guided setup for common PostgreSQL checks and notifications when using the commercial UI.
Pros
- Open-source Core with large plugin ecosystem
- Fits well in infra-centric monitoring stacks and NOC workflows
- Flexible thresholds and escalations for SRE on-call
- Works across self-managed Postgres and managed clouds via network checks
Cons
- Primarily availability and threshold monitoring, not deep query plans or tracing
- More DIY setup and maintenance for large fleets compared to turnkey observability suites
- Configuration requires expertise
Nagios Pricing at Scale
Nagios Core has no software license cost; you operate the monitoring server and storage yourself. If you choose Nagios XI (the commercial edition), licenses are sold by the number of monitored nodes (hosts/devices) with published prices for different node counts.
For example, a 300-node Standard Edition license is about $5,995/year, and a 300-node Enterprise Edition is about $7,990/year according to Nagios’s official pricing tiers. Larger node levels scale upward (e.g., 500, 750, 1,000+), each increasing the base license cost accordingly.
Tech Fit
Best for teams already running Nagios for servers, network, and OS checks who need PostgreSQL availability and threshold monitoring (connections, replication lag, locks, storage). Pairs well with self-managed PostgreSQL and managed offerings (e.g., RDS/Aurora) when you want unified alerting, and you’re comfortable extending coverage via community plugins and custom checks.
How to Choose the Right PostgreSQL Monitoring Tools
Deep PostgreSQL Diagnostics and Query Visibility
A robust PostgreSQL monitoring tool must expose pg_stat_statements, pg_locks, and slow-query metrics—not just CPU or uptime. These insights form the backbone of performance tuning and regression detection. Platforms like CubeAPM and pganalyze visualize query plans and normalization, helping engineers detect inefficient joins or query-plan shifts that degrade performance.
Replication and High-Availability Observability
For production clusters, replication health and failover readiness are critical. The tool should track replication lag, WAL activity, and slot status in real time to detect desyncs early. As noted on Stack Overflow, generic monitors often miss early lag signals—something tools like CubeAPM and Percona PMM address through latency-aware alerts.
Autovacuum, Bloat, and Checkpoint Monitoring
PostgreSQL performance relies on efficient autovacuum cycles and checkpoints. When these processes lag, table bloat and stale stats slow queries dramatically. CubeAPM visualizes autovacuum runs, buffer flush counts, and bloat trends, correlating them with I/O metrics to help teams tune thresholds before performance dips.
OpenTelemetry-First Architecture and Integration
With observability stacks standardizing around OpenTelemetry (OTEL), enterprises should prefer tools that natively ingest OTEL metrics and traces. The CNCF 2025 Survey shows 67% of organizations use OTEL for databases and apps, and CubeAPM enables seamless interoperability without vendor lock-in.
Unified MELT Correlation and Alert Quality
Database issues rarely occur in isolation. Modern PostgreSQL monitoring platforms must correlate Metrics, Events, Logs, and Traces (MELT) to connect query latency with app and infra context. CubeAPM links Postgres slow queries directly to application spans and container metrics, reducing RCA time and surfacing meaningful, SLO-aware alerts.
Cost Predictability and Data Retention
PostgreSQL telemetry is spiky—query bursts and WAL writes can overwhelm per-GB pricing. Teams should test cost behavior under peak ingest. G2 reviewers cite overages from legacy tools, whereas CubeAPM’s flat $0.15 / GB pricing and unlimited retention ensure cost control and full query history.
Deployment, Residency, and Multi-Cloud Control
For enterprises spanning AWS, Azure, and on-prem, deployment flexibility and compliance are essential. Tools should offer SaaS, self-hosted, or BYOC options to keep data local. CubeAPM supports region-locked hosting and private networking, maintaining unified dashboards across hybrid environments.
Conclusion
Choosing PostgreSQL monitoring tools is hard because pricing explodes with data growth, query-level visibility varies wildly, and many platforms don’t correlate DB signals with app and infrastructure context. Teams need real diagnostics, pg_stat_statements, replication lag, autovacuum health, without vendor lock-in or surprise overages.
CubeAPM solves this by unifying metrics, logs, traces, and events for PostgreSQL in one place, with OpenTelemetry-native ingest, deep query insights, and no extra charges for infrastructure or data transfer.
Ready to modernize PostgreSQL monitoring? Schedule a FREE demo with CubeAPM.
Disclaimer: The information in this article reflects the latest details available at the time of publication and may change as technologies and products evolve.
FAQs
1) What core signals should a PostgreSQL monitoring tool capture?
Slow/normalized queries, wait events/locks, pg_stat_statements, replication lag, WAL/checkpoints, autovacuum runs, cache hit ratio, temp files, and connection saturation.
2) How do I monitor managed Postgres (e.g., AWS RDS/Aurora) without superuser access?
Use tools that support cloud-native metrics APIs and read-only roles; enable pg_stat_statements where allowed, and ship logs/telemetry via an agent or OTEL Collector.
3) Do PostgreSQL monitoring tools need OpenTelemetry?
Not required, but OTEL-first tools like CubeAPM simplify pipeline portability, correlate DB spans with app traces, and avoid agent lock-in.
4) How much history should I retain for credible root-cause analysis?
Keep at least 30–90 days for query trends, plan drifts, and autovacuum/bloat patterns; platforms like CubeAPM include long-horizon retention without add-on fees.
5) What’s the quickest way to reduce Postgres latency discovered by monitoring?
Prioritize top offenders: fix missing indexes, reduce needless sorts/joins, tune work_mem/parallelism, and address lock contention; CubeAPM links slow queries to traces and infra, speeding targeted fixes.


