APM stands for Application Performance Monitoring (or Application Performance Management). It is the practice of continuously tracking how software applications behave in production, measuring speed, availability, error rates, and end-user experience so that engineering teams can detect and resolve issues before they impact customers.
Without APM, a slow database query or a memory leak can quietly degrade user experience for hours before anyone notices. With APM, the same issue triggers an alert, surfaces a root cause, and gives developers the exact line of code causing the bottleneck.
This guide covers what APM is, how it works, what it measures, and how to choose the right APM tool for your stack, including both enterprise platforms and leaner alternatives suited to smaller teams.
APM Definition: What Does APM Stand For?
APM stands for Application Performance Monitoring and is sometimes used interchangeably with Application Performance Management, depending on the vendor and context.
At its core, APM is the strategy and practice of using software tools and telemetry data to monitor the performance, availability, and user experience of business-critical applications in real time.
The simplest way to understand APM: It answers the question, “Is my application working well right now and if not, why?”
According to Gartner, APM is defined as:
“A suite of monitoring software comprising digital experience monitoring (DEM), application discovery, tracing and diagnostics, and purpose-built artificial intelligence for IT operations.”
In practice, APM tools collect data from your application’s runtime environment, covering everything from frontend page load times to backend service latencies, database query durations, and infrastructure resource consumption. They aggregate this data, detect anomalies, fire alerts, and help teams trace the origin of performance problems down to specific code paths or infrastructure components.
Organizations across industries from e-commerce and SaaS to banking and healthcare depend on APM to protect uptime, maintain SLAs, and deliver fast, reliable digital experiences.
Application Performance Monitoring vs. Application Performance Management
The two terms share the same acronym (APM) and are often used interchangeably, but they describe slightly different scopes.
Application Performance Monitoring is the technical act of collecting and visualizing performance data. It points out that a problem exists, for example, alerting you that API response times have spiked above your defined threshold.
Application Performance Management is the broader strategy of managing overall application performance end-to-end: from code quality and deployment pipelines through production monitoring, incident response, and post-mortem analysis. Management uses the data from monitoring surfaces to drive decisions and process improvements.
A useful analogy: monitoring is the stethoscope that detects an irregular heartbeat; management is the full treatment plan that follows.
Most modern APM platforms blur this distinction.
Why Is APM Important?
The business case for APM comes down to one unavoidable reality: application performance directly affects revenue, customer retention, and brand reputation.
Performance Problems Are Expensive
- Studies from Google consistently show that a 100ms delay in page load can reduce conversion rates significantly.
- A widely cited Amazon performance anecdote, attributed to former Amazon engineer Greg Linden, says that adding 100 ms of latency led to a 1% drop in sales.
- Gartner research estimates that IT downtime costs organizations an average of $5,600 per minute.
Modern applications distributed across microservices, cloud infrastructure, third-party APIs, and multiple global regions are inherently complex. A single user request can touch dozens of services. When something goes wrong, finding the cause without APM is like searching for a broken wire in a city-wide electrical grid.
Key Reasons Organizations Adopt APM
APM catches performance degradations before customers do. Rather than learning about a problem from a wave of support tickets, your team is already working on a fix.
Instead of spending hours (or days) correlating logs across systems, APM traces the exact path of a failing request and pinpoints which service, database query, or dependency is responsible.
Faster diagnosis directly translates to shorter outages and less revenue impact.
APM data reveals which services are over-provisioned (wasting money) and which are under-resourced (causing slowdowns), enabling smarter capacity planning.
By monitoring real user interactions, page loads, transaction completions, and error encounters, APM directly connects technical performance to the customer experience.
APM integrates with CI/CD pipelines to catch performance regressions before they reach production and supports SRE teams in maintaining error budgets and service-level objectives (SLOs).
How Does APM Work?
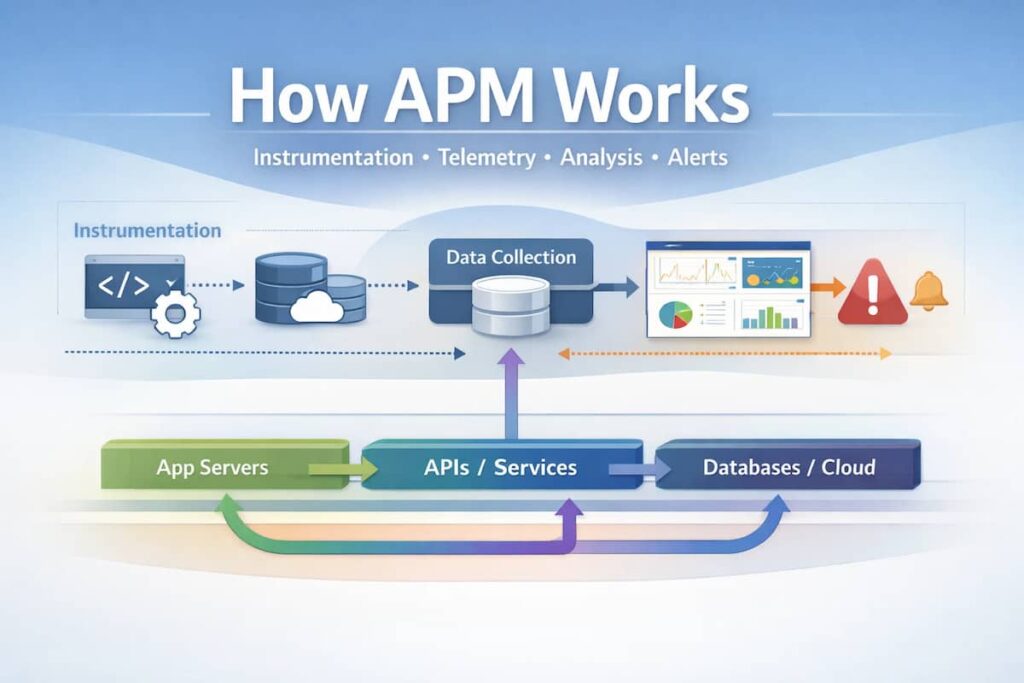
APM tools work by instrumenting your application and infrastructure to collect telemetry data, then processing and visualizing that data so teams can act on it. The process typically follows four stages:
Stage 1: Instrumentation and Data Collection
Instrumentation is the process of adding code, either manually or automatically, that records what your application is doing. Modern APM tools support several instrumentation methods:
- Auto-instrumentation: Agents or SDKs are deployed alongside your application and automatically capture telemetry without requiring code changes. Languages like Java, Python, Node.js, .NET, Go, and Ruby are commonly supported.
- Manual instrumentation: Developers add specific tracing calls or custom metrics to their code for business-critical workflows.
- OpenTelemetry (OTel): An open-source, vendor-neutral instrumentation standard that is rapidly becoming the industry default. OpenTelemetry allows teams to instrument once and send data to any compatible backend. (opentelemetry.io)
Stage 2: Data Transmission and Aggregation
Once collected, telemetry data is sent to the APM platform, either a SaaS cloud backend or a self-hosted data store. Data includes:
- Traces: Records of individual request flows across services
- Metrics: Numeric time-series data (response time, error rate, throughput)
- Logs: Event records from applications and infrastructure
- Profiles: Continuous code-level CPU and memory usage snapshots
Stage 3: Analysis and Anomaly Detection
The APM platform processes incoming data against baselines. Many platforms use machine learning to establish dynamic baselines and detect statistical anomalies, catching issues that wouldn’t trigger a simple threshold-based alert. AI-driven analysis (often called AIOps) can automatically correlate related alerts and surface probable root causes.
Stage 4: Alerting, Visualization, and Action
Teams interact with APM data through dashboards, service maps, distributed trace viewers, and alert channels (Slack, PagerDuty, email, etc.). When something goes wrong, the alert fires, a developer opens the trace, identifies the bottleneck, and ideally deploys a fix while the application is still recovering.
What Does APM Measure? Key Metrics to Track
APM tools measure two broad categories of metrics: end-user experience metrics and system/resource metrics. The most important ones include:
Application Performance Metrics
| Metric | What it Measures | Why it Matters |
| Response Time / Latency | How long it takes for the application to respond to a request (p50, p95, p99 percentiles) | Directly impacts user experience; high latency drives abandonment |
| Error Rate | Percentage of requests resulting in errors (4xx, 5xx HTTP errors, exceptions) | High error rates signal broken functionality |
| Throughput / Request Rate | Number of requests processed per second or minute | Indicates traffic load; spikes may precede degradation |
| Apdex Score | A standardized satisfaction score based on response time thresholds | Single number summarizing user satisfaction |
| Availability / Uptime | Percentage of time the application is accessible and functional | Core SLA metric |
Infrastructure and Resource Metrics
| Metric | What it Measures |
| CPU Utilization | Processing load on application servers or containers |
| Memory Usage | RAM consumption and memory leaks surface here |
| Disk I/O | Read/write activity and latency on storage |
| Network Latency | Time for data to travel between services |
| Database Query Times | How long individual SQL or NoSQL queries take |
| Garbage Collection Pauses | JVM and other runtime GC events that cause latency spikes |
End-User Experience Metrics
- Page Load Time / Core Web Vitals (LCP, FID/INP, CLS) measured via Real User Monitoring (RUM)
- Session replay data records user interactions to understand friction
- Synthetic transaction monitoring scripted tests that simulate user journeys 24/7, even when real users aren’t active
Core Features of APM Tools
A mature APM solution typically includes the following capabilities:
Distributed tracing follows a single request as it propagates through multiple services, containers, or serverless functions. Each “span” in a trace records the time spent in a service and any downstream calls made. Trace views make it immediately clear which service in a chain is causing slowdowns. This is the most critical feature for debugging microservices architectures.
Service maps are auto-generated visual diagrams showing how your services connect to each other and to external dependencies (databases, APIs, queues). They update in real time and immediately reveal which services are healthy (green) or degraded (red/yellow). Cisco AppDynamics, Dynatrace, and New Relic are particularly known for their dynamic service map capabilities.
APM agents can capture stack traces and identify the specific method, class, or line of code responsible for slow transactions. This is especially valuable for performance regressions introduced by a code change, allowing developers to fix the issue without needing to reproduce it locally.
APM platforms offer configurable alert conditions based on static thresholds (e.g., “alert if error rate > 1%”) and, increasingly, dynamic baselines established through machine learning. Good alerting strikes a balance — catching real problems without flooding teams with noise.
Many APM tools correlate trace data with logs, so developers can jump from a slow trace directly to the related log entries. Platforms like Elastic Observability and Datadog provide unified log, metric, and trace search within a single interface.
Custom dashboards let teams view the metrics that matter most for their services and SLAs. Executive-facing reports can translate technical metrics into business language connecting P95 latency to conversion rates, for example.
APM vs. Observability: What’s the Difference?
This is one of the most commonly asked questions in the APM space and it’s worth clarifying precisely because vendors use both terms liberally (and sometimes interchangeably for marketing purposes).
Monitoring is reactive: you pre-define the metrics and thresholds you want to watch. It works well for known failure modes.
Observability is the property of a system that allows you to understand its internal state from its external outputs even for failure modes you’ve never seen before. A system is observable when it emits rich enough telemetry (logs, metrics, traces, profiles) that an engineer can answer arbitrary questions about its behavior.
APM sits closer to the monitoring end of the spectrum, but modern APM platforms are increasingly expanding toward full observability. Tools like Honeycomb, which pioneered high-cardinality event-based observability, and Dynatrace, which combines APM with full-stack observability, blur the line considerably.
The practical distinction for buyers: traditional APM tools excel at tracking request flows, service dependencies, and standard performance metrics. Observability platforms provide deeper exploratory analysis capabilities the ability to slice and dice telemetry data in ways that weren’t anticipated when the system was set up.
For most teams, the right answer today is to evaluate platforms that deliver both APM and observability capabilities together, built on the OpenTelemetry standard to avoid vendor lock-in.
APM in Cloud-Native and Microservices Environments
Traditional APM tools were designed for monolithic applications running on fixed server infrastructure, an environment where a single agent on a single server could capture everything. Cloud-native architectures have fundamentally changed the challenge.
Why Cloud-Native Applications Make APM Harder
In a Kubernetes-based microservices environment, a single application might consist of hundreds of independently deployed services. These services spin up and down dynamically, communicate over the network (often asynchronously via message queues), and run across multiple availability zones or cloud providers.
The challenges this creates for APM include:
Pods and containers are short-lived, so agent-per-host models break down
Service maps become extremely complex; understanding dependencies is non-trivial
Tracing requests that pass through message queues (Kafka, RabbitMQ) requires careful instrumentation
Data must be correlated across AWS, GCP, Azure, and on-premises infrastructure simultaneously
High-cardinality distributed tracing data is expensive to store and query at microservices scale
How Modern APM Adapts
Leading APM platforms have responded with the following:
Agents deployed as DaemonSets or via operator patterns to automatically discover and instrument all pods
Allowing a single instrumentation approach to work across any language, framework, or cloud
Reducing storage costs by intelligently sampling traces while ensuring outliers and errors are always captured.
Automatically discovering service relationships without manual configuration.
Instrumentation for AWS Lambda, Google Cloud Functions, and Azure Functions.
How to Choose an APM Tool
The APM market is crowded. Selecting the right platform depends on several dimensions that go beyond feature checklists.
Start with your stack. Does your team run on Kubernetes? What languages are in use (Java, Python, Node.js, Go)? Are you AWS-first, multi-cloud, or primarily on-premises? Some tools, like AWS CloudWatch, integrate deeply with a specific cloud provider. Others, like Datadog and New Relic, are designed to work across any environment.
Large enterprises with dedicated platform engineering or SRE teams can leverage the full depth of tools like Dynatrace or Datadog. Smaller development teams often benefit more from tools that are easier to set up and interpret platforms where a developer can self-serve an answer without a steep learning curve.
APM pricing is notoriously complex. Common models include:
- Per-host pricing: Predictable for fixed infrastructure, but can spike with autoscaling
- Data ingest-based pricing: New Relic’s model; costs scale with data volume
- Per-feature licensing: Datadog charges separately for APM, logs, infrastructure, and more. Total bills can surprise teams new to the platform
- Usage-based / consumption pricing: Increasingly common with cloud-native tools
Always model expected costs against your actual data volumes and infrastructure footprint before committing.
Prioritize tools that natively support OpenTelemetry for instrumentation. This ensures you can switch backends in the future without re-instrumenting your entire application, a significant investment of engineering time.
Your APM tool needs to fit into your existing workflow. Key integrations to verify: your CI/CD pipeline (GitHub Actions, Jenkins, and GitLab); incident management (PagerDuty and Opsgenie); collaboration (Slack and Microsoft Teams); and cloud providers (AWS, GCP, and Azure).
For regulated industries (finance, healthcare, government), confirm where telemetry data is stored, what compliance certifications the vendor holds (SOC 2 Type II, ISO 27001, HIPAA), and whether you can self-host the backend.
Popular APM Tools Overview
The following is a vendor-neutral overview of widely used APM platforms. This is not an exhaustive ranking, and the best tool for your organization depends on your specific context.
CubeAPM
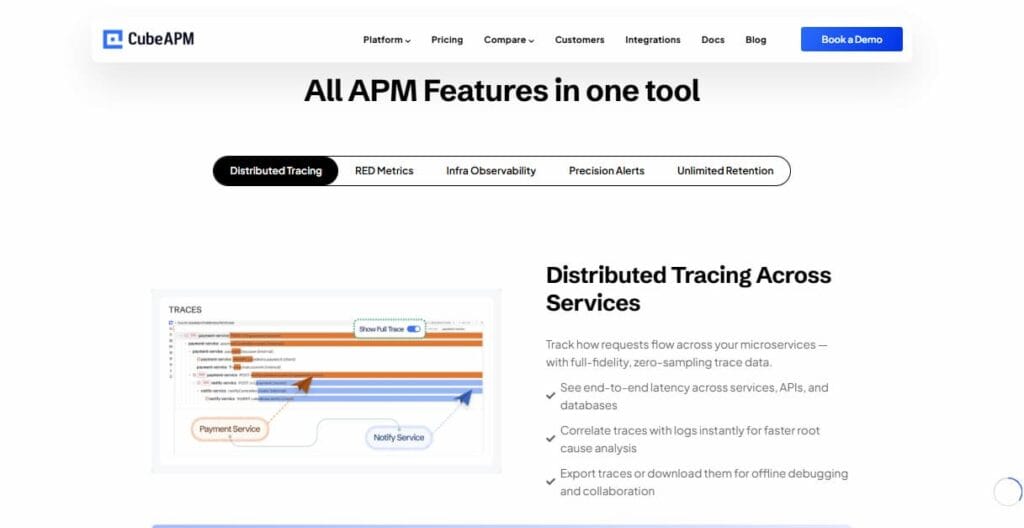
CubeAPM is an OpenTelemetry-native APM platform built for developer teams that want meaningful application performance insights without the cost and complexity of enterprise APM tools. It is designed as a lightweight, self-hostable alternative that consumes standard OpenTelemetry data directly, meaning teams that have already instrumented their applications with OTel can connect CubeAPM without re-instrumentation.
CubeAPM focuses on the core workflows developers actually need: distributed trace search, service error and latency dashboards, and infrastructure correlation without the sprawling feature set and unpredictable pricing of larger platforms. For engineering teams at growth-stage companies or cost-conscious organizations running OpenTelemetry, CubeAPM is worth evaluating as a practical alternative to more expensive enterprise options.
Best for: Developer-first teams, growth-stage companies, and organizations already using OpenTelemetry that want a straightforward, cost-effective APM backend.
Datadog
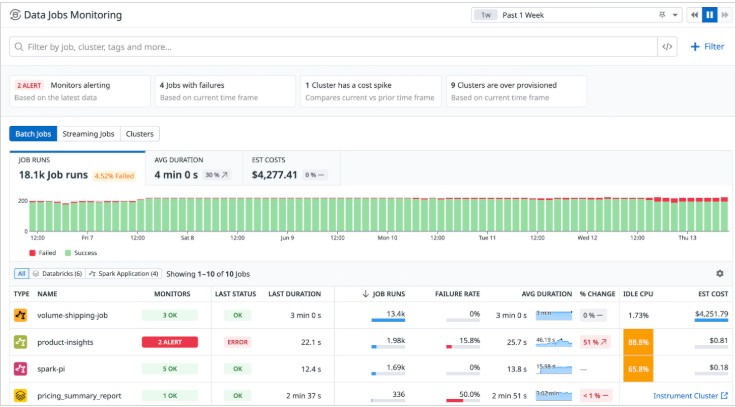
Datadog is one of the most widely adopted full-stack observability platforms. It covers APM, infrastructure monitoring, log management, real user monitoring, and security in a single unified platform, with over 700 integrations. Its strength is breadth and ease of getting started. The pricing can be a challenge to manage at scale, as teams are billed separately for each product module.
Best for: Mid-to-large enterprises wanting a single platform covering APM, infrastructure, and logs.
Dynatrace
Dynatrace differentiates through its AI engine (Davis AI), which automates root cause analysis and anomaly detection. Its Smartscape technology auto-discovers application topology in real time, making it particularly powerful for large, complex environments. Dynatrace is consistently positioned as a leader in the Gartner Magic Quadrant for APM and observability.
Best for: Large enterprises with complex, dynamic cloud-native environments where automated intelligence is valued over manual configuration.
New Relic
New Relic offers a unified observability platform with a consumption-based pricing model that includes a generous free tier (100GB/month). Its all-in-one approach covers traces, metrics, logs, and errors within a single data platform. New Relic has invested heavily in OpenTelemetry support.
Best for: Teams wanting a unified platform with predictable onboarding costs; good for organizations making their first move into structured APM.
Elastic Observability (ELK Stack + APM)
Elastic APM builds on the familiar Elastic Stack (Elasticsearch, Kibana). If your organization already uses Elasticsearch for log management, adding APM gives you correlated logs, metrics, and traces in a single interface. Elastic is strong for teams comfortable with self-managed infrastructure or who want granular control over their data.
Best for: Organizations already invested in the Elastic ecosystem; teams with log-heavy workloads wanting trace correlation.
Grafana + Prometheus + Tempo
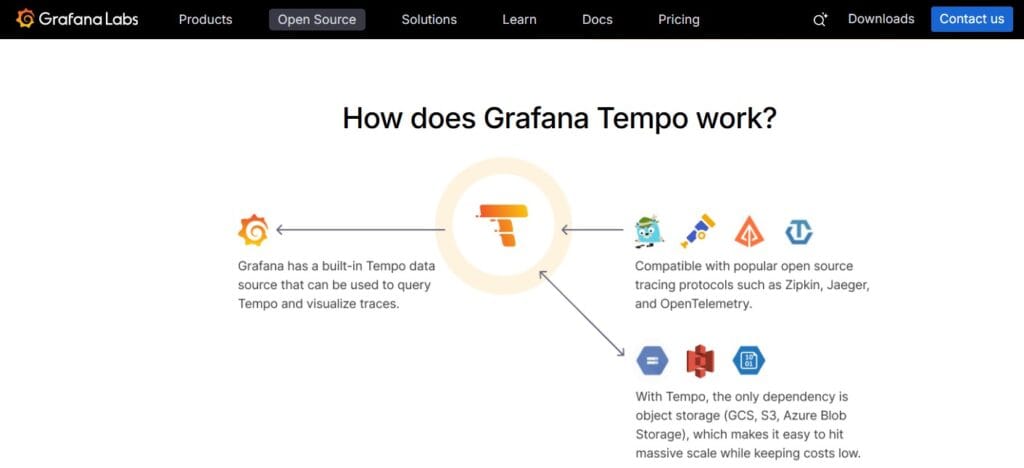
This open-source stack Prometheus for metrics, Grafana for visualization, and Grafana Tempo for distributed tracing has become the de facto observability stack for teams that want full control without vendor lock-in. Grafana Cloud provides a managed SaaS option. Setup requires more engineering investment than turn-key SaaS tools, but the flexibility and cost control are unmatched for teams with the expertise.
Best for: Teams with strong DevOps or platform engineering capability who want open-source control and maximum cost flexibility.
OpenTelemetry + Jaeger
OpenTelemetry is the CNCF standard for telemetry instrumentation, not an APM tool itself, but the foundation on which vendor-neutral observability is built. Paired with Jaeger (an open-source distributed tracing system), it provides a fully open-source, self-hosted tracing solution. This combination requires more operational work but provides zero vendor lock-in.
Best for: Teams building a vendor-neutral telemetry foundation; organizations where open-source and self-hosted are hard requirements.
AWS CloudWatch + AWS X-Ray
For teams heavily invested in AWS, Amazon CloudWatch provides metrics, logs, and alarms natively integrated with AWS services. AWS X-Ray adds distributed tracing for applications running on AWS. The integration is seamless within the AWS ecosystem, though it provides less value for multi-cloud or hybrid environments.
Best for: AWS-native organizations wanting deep integration with their cloud provider without introducing a third-party tool.
Splunk Observability Cloud
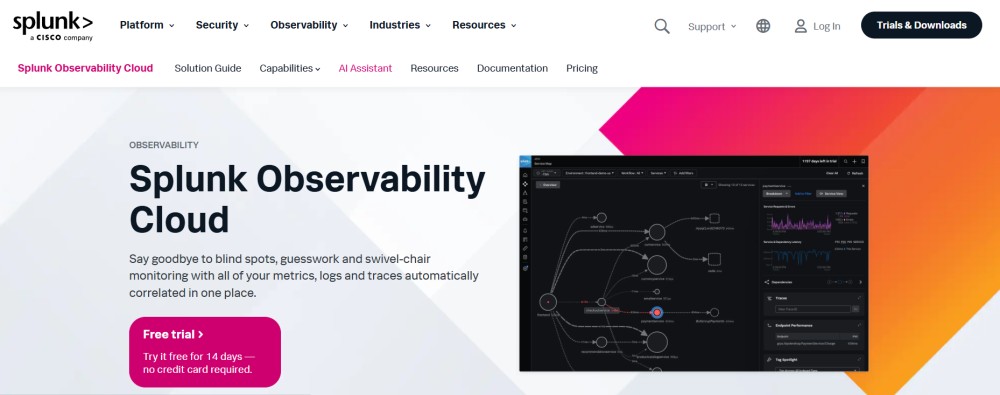
Splunk Observability Cloud, now part of Cisco, provides APM alongside infrastructure monitoring, log management, and synthetic monitoring. For organizations already using Splunk for SIEM and security operations, Observability Cloud can unify security and performance data in a single platform, which is a meaningful advantage.
Best for: Large enterprises already in the Cisco/Splunk ecosystem; organizations wanting to correlate security events with application performance data.
Splunk AppDynamics
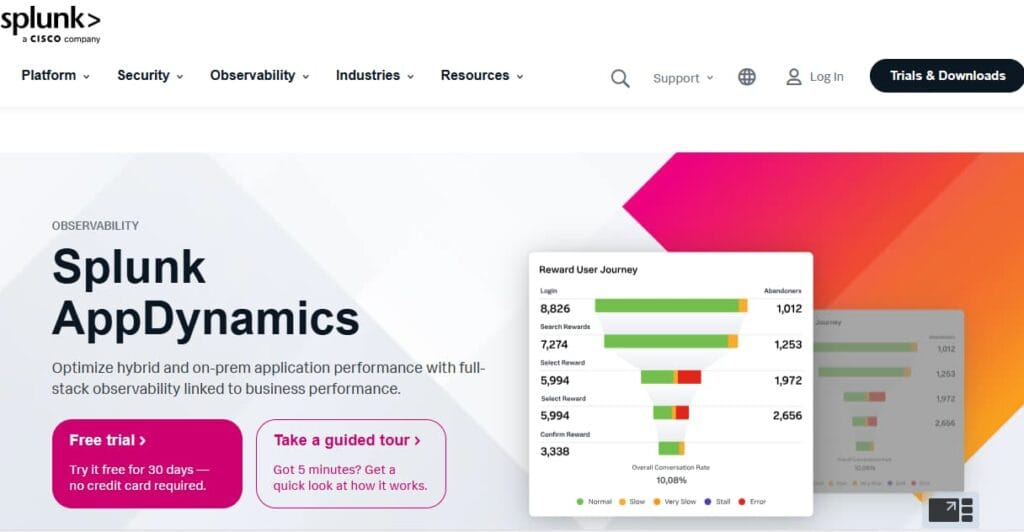
AppDynamics (also Cisco) has been a long-standing enterprise APM leader, known for its business transaction monitoring capabilities that connect application performance directly to business outcomes (revenue per transaction, customer journey completion rates). It is particularly strong in financial services and large enterprises with complex Java and .NET environments.
Best for: Large enterprises needing to connect APM data to business KPIs; heavily regulated industries with complex on-premises Java applications.
Conclusion
APM Application Performance Monitoring is no longer a luxury reserved for large enterprises. As applications grow more distributed, user expectations for speed and reliability grow higher, and the cost of downtime compounds, APM has become a foundational capability for any team running production software.
The right APM tool depends on your architecture (monolith vs. microservices vs. serverless), your team’s maturity, your cloud environment, and your budget. Enterprise platforms like Dynatrace, Datadog, and New Relic offer deep, integrated capabilities for organizations that can invest in them. Open-source stacks like Grafana + Prometheus + Tempo provide maximum control. OpenTelemetry-native tools like CubeAPM offer a practical middle ground meaningful APM visibility built on open standards, without enterprise-level complexity or cost.
Whatever tool you choose, prioritize OpenTelemetry compatibility from day one. Instrumenting your application once, against an open standard, protects your engineering investment and keeps your future options open. APM is not a destination; it is an ongoing practice, and the best tool is the one your team will actually use.
Disclaimer: The information in this article reflects the latest details available at the time of publication and may change as technologies and products evolve.
FAQs
APM (Application Performance Monitoring) is software that watches your application while it’s running and tells you when something is slow, broken, or degrading the user experience. Think of it as a health monitor for your application, tracking response times, errors, and resource usage in real time so your team can fix problems fast.
Monitoring (including APM) tells you that something is wrong, based on pre-defined metrics and thresholds. Observability goes further; it describes the property of a system where you can understand why something is wrong, even for failure modes you’ve never encountered before, by exploring the telemetry your system emits. Modern APM platforms are increasingly incorporating observability capabilities, and in practice, the terms are often used interchangeably in the market.
In DevOps, APM bridges the gap between development and operations. It gives developers visibility into how their code behaves in production and helps operations teams detect and diagnose issues without needing code-level expertise. APM integrates with CI/CD pipelines to catch performance regressions before deployment and supports SRE teams in maintaining error budgets and service-level objectives (SLOs).
The three foundational telemetry signals are metrics (numeric time-series data like response time and error rate), logs (timestamped records of discrete application events), and traces (end-to-end records of how individual requests flow through distributed services). Together, these three pillars provide comprehensive visibility into application behavior.
Cloud APM monitors applications running in public cloud (AWS, GCP, and Azure), private clouds, hybrid cloud, and multi-cloud environments. It tracks the performance of cloud-native components like containers, Kubernetes pods, serverless functions, and managed services (databases, queues, and CDNs), providing the same end-to-end visibility in dynamic cloud environments that traditional APM provided for fixed server infrastructure.
APM pricing varies significantly. Enterprise platforms like Datadog, Dynatrace, and New Relic typically range from hundreds to thousands of dollars per month depending on the number of hosts, data volume, and features enabled. Open-source stacks (Prometheus + Grafana + Jaeger) are free to use but require engineering time to operate. Mid-tier and developer-focused tools like CubeAPM offer more accessible pricing models. Always model your expected data volumes and host counts against vendor pricing before committing.
Log monitoring focuses on collecting, searching, and alerting on application log output useful for debugging specific events. APM is broader: it adds distributed tracing, metrics dashboards, service dependency maps, and user experience data on top of logs. The most powerful modern platforms (Elastic, Datadog, and New Relic) correlate logs with traces, allowing developers to jump from a slow trace directly to the relevant log lines.


