Express.js is one of the most widely used frameworks in the Node.js ecosystem, valued for its minimalist design and middleware flexibility that make API and microservice development fast and efficient. However, as applications scale, diagnosing slow routes, async delays, and middleware bottlenecks becomes complex.
CubeAPM supports native Express.js tracing and instrumentation, automatically capturing route spans, middleware timings, and async call insights to help you quickly pinpoint slow endpoints or bottlenecks in your Express services.
In this guide, we’ll explore the top Express.js monitoring tools, comparing their architecture, features, pricing, and suitability for real-world Node.js environments.
Best Express.js Monitoring Tools
- CubeAPM
- Datadog
- New Relic
- Dynatrace
- Sentry
- Instana (IBM)
- Grafana Cloud
- Elastic Observability
What Is Express.js Monitoring?
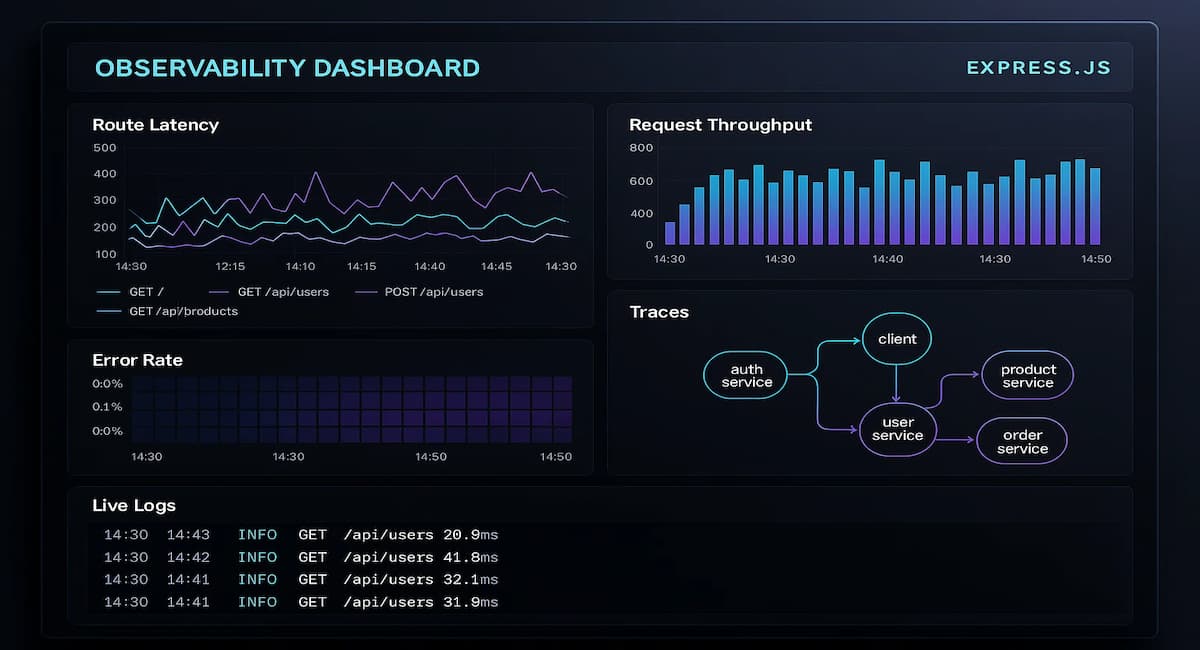
Express.js monitoring is the process of tracking the performance, health, and reliability of applications built using the Express framework on Node.js . It focuses on observability at the application layer, providing insights into request latency, middleware execution time, route performance, and errors across the full request lifecycle.
While infrastructure metrics like CPU, memory, or container health reveal system-level conditions, Express.js monitoring dives into application-level telemetry — how each HTTP request is processed, how long middleware stacks take to execute, and where bottlenecks occur in async I/O or external API calls.
A well-instrumented Express.js monitoring setup typically captures:
- Route latency: Time taken to handle individual API routes or endpoints
- Middleware performance: Execution duration for authentication, validation, and logging middleware
- Event loop utilization: Insights into Node.js thread blocking or async drift
- Error tracking: Frequency, source, and impact of runtime or unhandled exceptions
- External dependencies: Latency from third-party APIs, databases, or message queues
Together, these metrics help teams detect slow transactions, identify performance regressions, and correlate issues across code, logs, and traces — enabling faster debugging and proactive scaling decisions.
Example: How CubeAPM Handles Express.js Monitoring
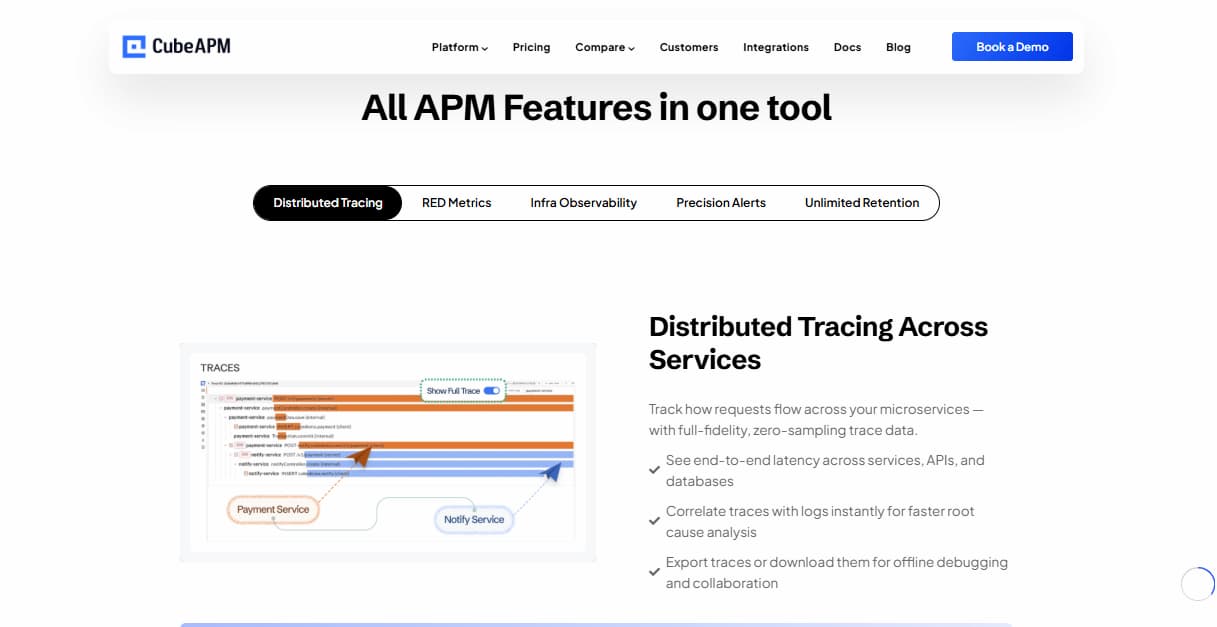
CubeAPM provides native Express.js instrumentation that automatically traces incoming HTTP requests, middleware layers, and route handlers — without requiring major code changes. Using its OpenTelemetry-based Node.js agent, CubeAPM captures latency, error rates, and request flow data across the full Express lifecycle, including event-loop metrics and async I/O performance. This allows developers to pinpoint slow routes, blocking middleware, or unoptimized database calls in real time.
All telemetry — including metrics, traces, and logs — is visualized in a unified dashboard. Developers can filter by route, response time, or error type, correlate application traces with infrastructure metrics, and create alerts for rising latency or failed transactions. The platform’s lightweight agent design ensures minimal overhead while maintaining full visibility across production workloads.
Express.js Monitoring Highlights in CubeAPM:
- Automatic tracing for routes, controllers, and middleware
- Event-loop and async call monitoring for performance bottlenecks
- Real-time correlation of logs, traces, and metrics
- Error rate tracking with detailed span context
- Route-level dashboards for latency and throughput visualization
- OpenTelemetry-native SDK integration for Node.js
Why Teams Choose Different Express.js Monitoring Tools
1. Depth of Express.js–Native Instrumentation
Teams want tools that natively understand the Express runtime — not just generic Node.js metrics. True Express.js monitoring should capture route latency, middleware timing, async drift, and event-loop lag. Tools like CubeAPM and Dynatrace provide this granularity, while others only surface system-level stats.
2. OpenTelemetry Compatibility
Modern observability strategies rely on OpenTelemetry for vendor-agnostic data pipelines. Tools with full OTel support (metrics, traces, and logs) allow developers to export Express telemetry to multiple backends without rewriting instrumentation, ensuring long-term flexibility.
3. Pricing and Data Ingestion Model
Express APIs can generate thousands of requests per second, which translates into large trace and log volumes. Platforms charging per GB or per span can become costly at scale. Teams often evaluate whether the pricing model supports predictable costs as data grows.
4. Log and Trace Correlation
Developers prioritize tools that seamlessly correlate logs, traces, and metrics within a single request context. This makes it easier to track an error from an HTTP 500 log entry down to the originating middleware or database call inside Express.
5. Deployment Flexibility and Compliance
Organizations with data-sovereignty or compliance needs prefer platforms that offer self-hosting, BYOC (Bring Your Own Cloud), or on-premise deployments. Cloud-only tools may not fit industries under HIPAA, GDPR, or ISO 27001 mandates.
6. Integration Ecosystem
Express.js apps rarely run in isolation — they’re paired with MongoDB, Redis, Nginx, or Kubernetes. Teams often choose monitoring tools that integrate natively with these environments, providing unified dashboards for both application and infrastructure layers.
7. Alerting Intelligence and Developer Experience
Ease of use and actionable insights are major differentiators. Engineers favor platforms that include anomaly detection, service-level objective (SLO) alerts, and intelligent notifications via Slack, Teams, or PagerDuty — reducing noise while highlighting real performance issues.
Top 8 Express.js Monitoring Tools
1. CubeAPM
Known For
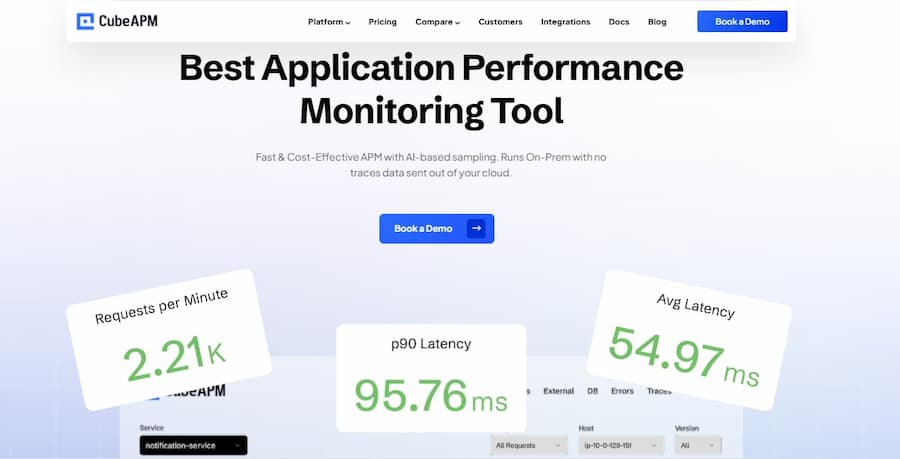
CubeAPM is known for delivering OpenTelemetry-native observability purpose-built for modern Node.js frameworks like Express. It combines metrics, events, logs, and traces (MELT) into a unified backend that supports self-hosted deployments. Its lightweight agents automatically instrument Express routes and middleware without code bloat, offering full-stack visibility with minimal overhead.
Express.js Monitoring Features
CubeAPM provides deep Express.js insights through:
- Automatic route and middleware instrumentation
- Event-loop and async latency tracking
- Real-time error detection for API routes and promise chains
- Span-level tracing to visualize slow or blocking operations
- Request correlation linking logs, traces, and metrics in one context
- Adaptive sampling to handle high-throughput Express workloads efficiently
Key Features
- OpenTelemetry-native collector and SDKs
- Unified MELT observability for microservices
- Support for self-hosted, SaaS, or BYOC deployments
- Granular trace filtering by route, status code, or latency percentile
- Smart anomaly detection and SLO-based alerting
- Native integrations for Docker, Kubernetes, Redis, PostgreSQL, and MongoDB
Pros
- Excellent visibility into Express route performance
- Low agent overhead for high-traffic Node.js apps
- Enterprise-grade compliance (GDPR, SOC2, HIPAA-ready)
- Supports multi-cloud and hybrid architectures
- Real-time correlation between middleware, logs, and traces
Cons
- Not suited for teams looking for off-prem solutions
- Strictly an observability platform and does not support cloud security management
Pricing
Flat pricing of $0.15/GB of data ingested
CubeAPM Pricing at Scale for Express.js Monitoring
*All pricing comparisons are calculated using standardized Small/Medium/Large team profiles defined in our internal benchmarking sheet, based on fixed log, metrics, trace, and retention assumptions. Actual pricing may vary by usage, region, and plan structure. Please confirm current pricing with each vendor.
For a mid-sized SaaS company ingesting 45TB(~45,000) total monthly data ingestion and 45,000TB of observability data outcharged by the cloud provider, the total cost will be about ~$7200/month.
Tech Fit
CubeAPM suits Node.js and Express-heavy environments running microservices, containerized apps, or serverless APIs. It’s ideal for engineering teams seeking full-stack observability, OpenTelemetry compliance, and real-time route-level diagnostics without complex licensing.
2. Datadog
Known For
Datadog is a leading enterprise observability platform offering unified monitoring for infrastructure, APM, logs, and security. It’s widely used by large engineering teams running Express.js and Node.js microservices that need visibility from API routes to container metrics. Known for its robust integrations, real-time dashboards, and anomaly detection, Datadog helps teams visualize request latency and detect performance regressions across distributed systems.
Express.js Monitoring Features
- Automatic tracing for Express routes and middleware
- Event-loop latency and throughput insights
- Middleware and route-level error tracking
- Trace-to-log correlation for faster debugging
- Service maps and dependency visualization
Key Features
- 900+ integrations (AWS, Docker, Kubernetes, MongoDB, etc.)
- Real-time dashboards and anomaly detection
- Code-level profiling (CPU, memory, I/O)
- Synthetic and RUM support for end-to-end observability
Pros
- Deep integration ecosystem
- Excellent visualization and alerting
- Advanced APM and code profiling
Cons
- High cost at scale
- Complex pricing model
- Extra charges for retention
Pricing
- Infrastructure Monitoring: $15–$23 per host/month
- APM (Traces): $31 per host/month
- Log Ingestion: $0.10 per GB ingested
- Error Tracking: $25 per 50,000 errors
Datadog Pricing at Scale for Express.js Monitoring
For a mid-sized SaaS company operating 125 APM hosts, 40 profiled hosts, 100 profiled container hosts, 500,000,000 indexed spans, 200 infra hosts, 1,500,000 container hours, 300,000 custom metrics, and ingesting around 10TB(~10,000 GB) of logs per month with 3500 indexed logs, the monthly cost would be around ~$27,475/month.
Tech Fit
Best for large engineering teams or enterprises that need comprehensive observability across Express.js APIs, containers, and cloud environments. Datadog delivers unmatched visibility and depth, but its complex, usage-based pricing can quickly become expensive for teams with large data volumes or frequent log ingestion.
3. New Relic
Known For
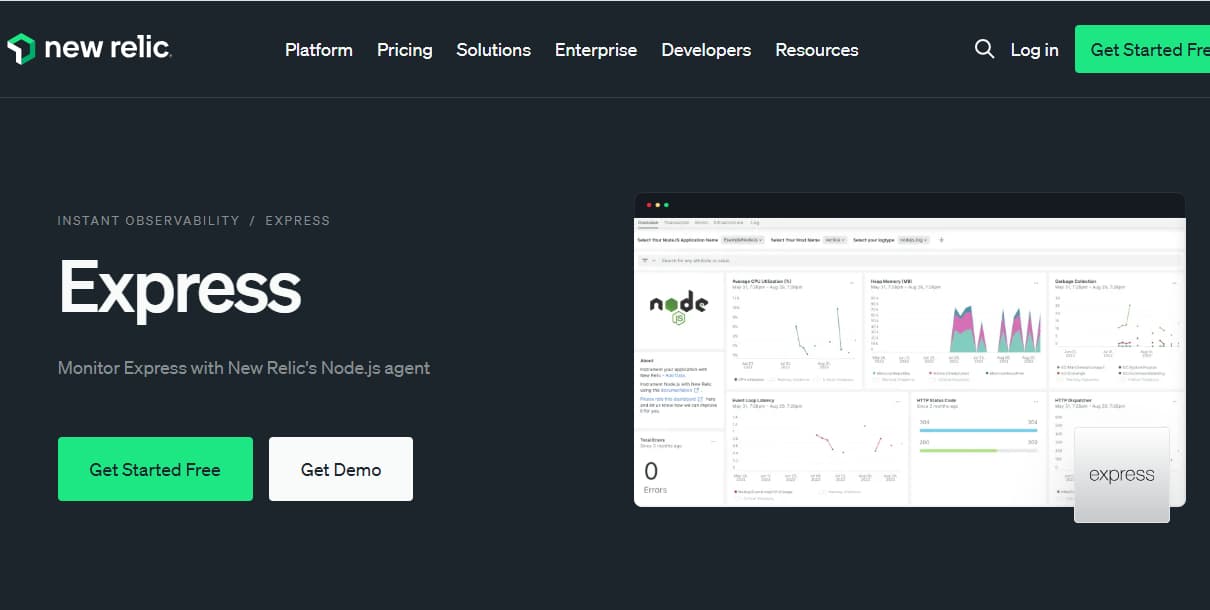
New Relic is a full-stack observability platform offering APM, infrastructure, logs, browser, and synthetic monitoring under a usage-based model. It’s popular among teams seeking to eliminate per-host billing and pay only for data ingested and active users. The platform provides strong visualizations, distributed tracing, error tracking, and real-time dashboards—making it ideal for monitoring Express.js applications running in production environments.
Express.js Monitoring Features
- Automatic tracing for Express routes and middleware
- Error inbox with context for route, status code, and stack trace
- Correlation between logs, traces, and metrics for full visibility
- Route-level filtering to identify slow endpoints
- Sampling and retention controls for high-traffic Express APIs
Key Features
- Unified telemetry ingestion (metrics, logs, traces)
- 100 GB/month free data ingest
- Predictable usage-based billing
- AI-assisted anomaly detection and insights
- Support for OpenTelemetry collectors
Pros
- Simple, transparent billing
- Excellent dashboards and trace correlation
- Strong data governance and role-based access
- Free tier useful for small Express.js projects
Cons
- Expensive at scale due to ingestion and user-based pricing.
- Steep learning curve for new users.
- Requires deep expertise to execute advanced queries.
Pricing
- Free tier: 100GB/month of data ingested
- Data Ingest: $0.40 per GB ingested beyond the free 100GB
- Full Platform Users: $418.80 per user/month
New Relic Pricing at Scale for Express.js Monitoring
A mid-sized SaaS company ingesting 45TB (~45,000 GB) of telemetry data per month and with 10 full users, the cost would come around ~$25,990/month.
Tech Fit
New Relic suits mid-to-large engineering teams that want usage-based pricing, strong user management, and unified observability for Express.js and Node.js services. It offers great flexibility and visualization power.
4. Dynatrace
Known For
Dynatrace is an enterprise-grade observability platform powered by AI (Davis AI) and automatic instrumentation via OneAgent. It’s designed for large, distributed systems where Express.js applications run across multiple services and environments. Known for its root-cause analysis automation and smart dependency mapping, Dynatrace gives teams deep, continuous visibility with minimal manual configuration.
Express.js Monitoring Features
- Auto-instrumentation for Express routes and middleware
- Event-loop latency and memory tracking for Node.js apps
- Real-time correlation of logs, traces, and metrics
- Automatic topology discovery across services
- AI-driven anomaly detection for latency and error spikes
Key Features
- Full-Stack Monitoring (APM + Infrastructure) — $58 / 8 GiB host / month
- Infrastructure Monitoring — $29 / host / month
- Foundation & Discovery — $7 / host / month
- Log Analytics: Pay-per-Query or Bundled Query Plans
Pros
- AI-driven performance diagnostics
- Real-time service discovery and dependency mapping
- Unified visibility across infra, apps, and logs
Cons
- Premium pricing for full-stack monitoring
- Complex initial setup for hybrid environments
Pricing
- Infrastructure Monitoring: $29/mo/host
- Full-Stack Monitoring: $58/mo/8 GiB host
Dynatrace Pricing at Scale for Express.js Monitoring
A midsized SaaS company operating 125 APM hosts, 200 infra hosts, 10TB(~10,000 GB) of ingested logs, 300,000 custom metrics, 1,500,000 container hours, and 45,000GB of observability data out(charged by cloud provider), the cost would come around ~$21,850/month.
Tech Fit
Dynatrace fits enterprises and global DevOps teams managing large Express.js microservices or cloud-native stacks requiring AI-based root-cause analysis and automation. It’s best when observability depth, self-healing detection, and scale outweigh cost considerations.
5. Sentry
Known For
Sentry is a developer-first monitoring and error-tracking platform designed to help teams identify, fix, and optimize application performance issues in real time. It’s widely adopted by JavaScript and Node.js developers, including Express.js teams, for its lightweight SDKs, intuitive dashboards, and focus on actionable error insights rather than broad infrastructure observability.
Express.js Monitoring Features
- Automatic instrumentation for Express routes, middleware, and endpoints
- Real-time error tracking with stack traces, breadcrumbs, and request context
- Performance monitoring for route latency and throughput
- Tagging for routes, HTTP methods, and user sessions
- Distributed tracing with support for OpenTelemetry spans
Key Features
- Error and exception tracking with intelligent grouping
- Transaction traces and route-level performance dashboards
- Alerts for slow requests or rising error rates
- Source-map integration for debugging Express.js in production
- Integrations with GitHub, Slack, Jira, and CI/CD systems
Pros
- Simple to set up and developer-friendly
- Focused on actionable error insights
- Integrates seamlessly with Node.js and front-end tools
- Cost-effective for small to medium workloads
Cons
- Costs scale sharply with event volume
- No native support for infrastructure metrics, logs
- Complex configuration setup
- Expensive at scale
Pricing
- Team Plan: $26/month for 50 K errors
- Business Plan: $80/month (adds release health, advanced alerts)
- Enterprise: Custom (for high-volume workloads and retention)
Sentry Pricing at Scale for Express.js Monitoring
For a mid-sized SaaS company ingesting 10,000 TB (~10,000GB) of logs, 500,000,000 indexed spans, and 45,000GB of observability data (charged by the cloud provider), the cost would come around $12,100/month.
Tech Fit
Sentry fits developer-centric teams focusing on error tracking and performance optimization rather than full observability. It’s ideal for Express.js and front-end stacks where quick issue detection, lightweight instrumentation, and integration with developer workflows matter most.
6. IBM Instana

Known For
Instana (by IBM) is known for automated instrumentation and real-time discovery of services with minimal manual setup. It uses intelligent “AutoTrace” technology to automatically detect new components—including Express.js routes, middleware, and controllers—making it ideal for dynamic microservice environments. Its unified observability model brings together logs, traces, metrics, and end-user data in one platform.
Express.js Monitoring Features
- Automatic tracing of Express routes, handlers, and middleware
- Real-time performance metrics for route latency and throughput
- Log, trace, and metric correlation per request context
- Dependency mapping across distributed Node.js services
- Root-cause detection for errors and high response times
Key Features
- Unified observability (APM, infrastructure, and tracing in one license)
- Self-hosted and SaaS deployment options
- Support for OpenTelemetry and OpenTracing standards
- Automatic service discovery and topology mapping
- AI-powered anomaly detection
Pros
- Minimal setup; auto-instrumentation saves time
- Single license covers all observability components
- Great visibility for containerized and Kubernetes workloads
- Supports data privacy with on-prem deployment
Cons
- Per-host model can scale quickly with large clusters
- Data ingestion costs add up for heavy log pipelines
Pricing
- Essentials Tier: $20 per MVS / month (infrastructure monitoring only)
- Standard Tier: $75 per MVS / month (full-stack observability)
Instana Pricing at Scale for Express.js Monitoring
For a mid-sized company ingesting 45 TB/month (2,000 GB) of Express.js telemetry across 125 managed hosts (MVS) under the Standard Tier, total cost would be around $10,200/month — including $3,750 for host licensing (50 × $75) and $4,450 for data ingestion [(2,000 × $0.35) + minor overages]. At this scale, Instana offers strong full-stack visibility but becomes costly for sustained high-volume Express workloads without sampling or retention tuning.
Tech Fit
Instana is best suited for mid-to-large DevOps teams running Express.js and Node.js microservices that demand continuous auto-discovery, minimal instrumentation effort, and full-stack visibility. It’s ideal for teams that prefer IBM’s enterprise reliability and hybrid deployment options, though cost optimization is essential for high-ingest or large-cluster use cases.
7. Grafana Cloud
Known For
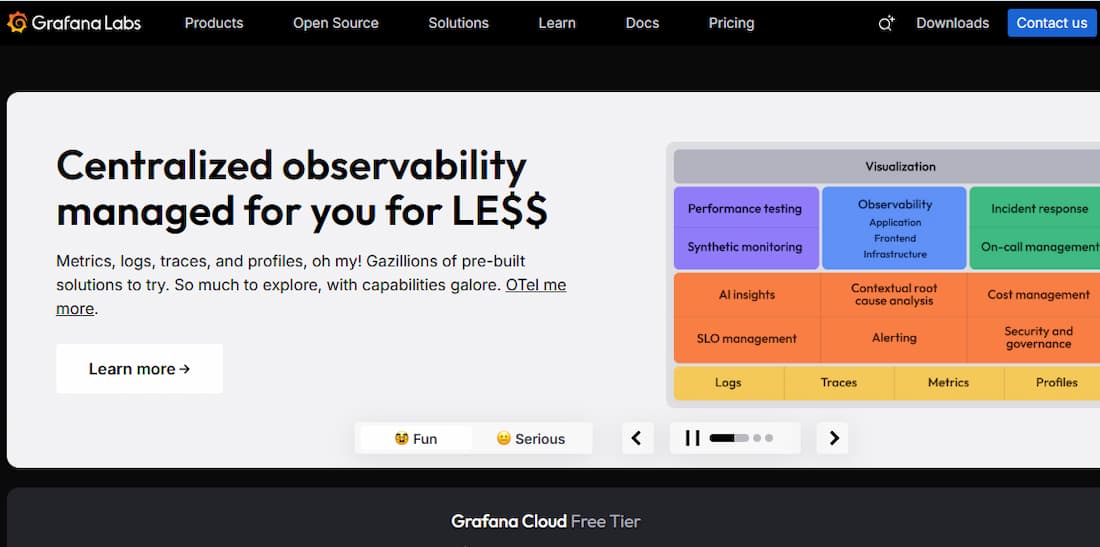
Grafana Cloud is a fully managed observability platform built around Prometheus, Loki, Tempo, and Grafana dashboards. It’s best known for its open-standards compatibility and pay-as-you-grow pricing model, making it ideal for teams monitoring Express.js and Node.js APIs through OpenTelemetry collectors. It offers unified visibility across logs, metrics, and traces without forcing vendor lock-in.
Express.js Monitoring Features
- Native OpenTelemetry support for Express route and middleware tracing
- Real-time route latency, error, and throughput metrics via Prometheus exporters
- Log correlation with Loki and distributed tracing with Tempo
- Dashboards for event-loop delays, request latency, and API error rates
- Alerting through Grafana Alertmanager with Slack, PagerDuty, and OpsGenie integrations
Key Features
- Unified stack: Prometheus (metrics), Loki (logs), Tempo (traces)
- Automatic correlation of Express logs and traces
- Generous free tier (10 k series metrics, 50 GB logs, 50 GB traces)
- Multi-tenant, scalable SaaS with secure retention
- Query language compatibility with PromQL, LogQL, and TraceQL
Pros
- OpenTelemetry-first and vendor-neutral
- Transparent pricing and usage control
- Strong integration ecosystem
- Excellent visualization via Grafana dashboards
Cons
- Requires some setup knowledge for exporters and collectors
- Per-GB pricing can add up quickly as usage grows
- Advanced alert rules need configuration expertise
Pricing
- Metrics (Prometheus) → $8.50 per 10k active series/month
- Logs (Loki) → $0.50 per GB ingested
- Traces (Tempo) → $0.50 per GB ingested
Grafana Cloud Pricing at Scale for Express.js Monitoring
For a mid-sized company operating 125 APM hosts, 200 infra hosts, 10TB(~10,000 GB) of ingested logs, and 45,000GB of observability data out(charged by cloud provider), the cost would come around ~$11,875/month.
Tech Fit
Grafana Cloud suits Express.js and Node.js teams that value open-source tooling, OTel interoperability, and predictable per-GB pricing. It’s ideal for developers already using Prometheus or Loki and wanting managed reliability without enterprise licensing overhead. Best for teams comfortable with configuration who prefer transparency and flexibility over complex vendor ecosystems.
8. Elastic Observability
Known For
Elastic Observability is part of the Elastic Stack (Elasticsearch, Logstash, Kibana), renowned for its search-driven analytics and open-source flexibility. It enables teams to collect, correlate, and visualize logs, metrics, and traces in real time. Express.js developers rely on it for API-level latency tracking, error correlation, and performance visualization across distributed Node.js services.
Express.js Monitoring Features
- Native OpenTelemetry agent for Express routes and middleware
- Real-time request-latency and throughput metrics
- Log ingestion and analysis through Kibana dashboards
- Error-rate tracking and route-level correlation
- ML-based anomaly detection for traffic or performance spikes
Key Features
- Unified platform for logs, metrics, and traces
- Managed Elastic Cloud or self-hosted deployment options
- Advanced search and visualization via Kibana
- Support for Beats, Logstash, and OpenTelemetry pipelines
- Built-in security and access-control layers
Pros
- Highly flexible and open architecture
- Excellent search and visualization capabilities
- Seamless integration with Express.js and Node.js
- Machine-learning insights for anomaly detection
Cons
- Elasticsearch scaling complexity.
- Storage and infra costs grow rapidly.
- Requires in-house expertise to tune.
Pricing
- Standard Plan: $99 per month
- Gold Plan: $114 per month
- Platinum Plan: $131 per month
- Enterprise Plan: $184 per month
Elastic Observability Pricing at Scale for Express.js Monitoring
For a mid-sized SaaS company with 125 APM hosts, 20TB of events ingestion per month, and 45,000GB of observability data out(charged by cloud provider), the cost would be around $17435.
Tech Fit
Elastic Observability suits teams wanting open-source flexibility and deep search capabilities for their Express.js microservices. It’s ideal for developers who need fine-grained control over data pipelines and visualization while maintaining enterprise-grade scalability. Proper indexing and sampling keep Elastic cost-efficient even at terabyte-scale workloads.
Conclusion
Choosing the right Express.js monitoring tool depends on your team’s scale, data volume, and observability needs. Platforms like Grafana Cloud and Better Stack provide open, cost-transparent solutions for developers who value simplicity and integration flexibility. Meanwhile, enterprise-grade tools like Dynatrace, New Relic, and Instana deliver deep AI-powered insights and automation—but often at a higher price point that can strain growing teams.
For organizations that need full MELT visibility (Metrics, Events, Logs, Traces) with OpenTelemetry-native support and predictable pricing, CubeAPM stands out as the best fit. It’s designed specifically for modern JavaScript ecosystems—offering Express.js route-level tracing, error correlation, and performance analytics—all at a flat, transparent rate per GB.
Whether you’re scaling a SaaS platform, debugging microservices, or monitoring enterprise APIs, CubeAPM provides the clarity, control, and affordability that most tools miss. Start monitoring your Express.js workloads with CubeAPM today and see how fast visibility can actually be affordable.
Disclaimer: The information in this article reflects the latest details available at the time of publication and may change as technologies and products evolve.
FAQs
1. What is Express.js monitoring?
Express.js monitoring tracks an application’s performance, latency, errors, and request throughput to ensure reliability and optimal response times. It provides developers with real-time visibility into routes, middleware, and API dependencies.
2. Why is Express.js monitoring important?
It’s crucial because Express.js applications often handle critical backend APIs. Continuous monitoring helps detect slow routes, memory leaks, and unhandled exceptions before they impact users—ensuring faster debugging and stable performance.
3. Which tool is best for Express.js monitoring?
CubeAPM is the best choice for Express.js monitoring. It offers real-time route-level tracing, performance metrics, and error correlation using OpenTelemetry, giving developers deep visibility across services without complex setup or host-based billing.
4. How do I monitor my Express.js app effectively?
You can deploy CubeAPM’s OpenTelemetry-based agent to automatically instrument your Express.js application. It captures metrics, logs, and traces in real time and visualizes them through intuitive dashboards that highlight route performance and latency trends.
5. Is there a cost-effective Express.js monitoring solution?
Yes — CubeAPM delivers enterprise-grade observability at a transparent per-GB rate, eliminating hidden host fees. Its smart sampling and compression ensure you only pay for meaningful telemetry, making it the most affordable and scalable solution for Express.js teams.


