Grafana is popular for its vendor-neutral doctrine, flexible dashboards, and ability to unify data from Prometheus, Loki, Elasticsearch, and other sources. But this composable approach also brings challenges, including maintaining multiple backends and rising storage or scaling costs as environments grow.
CubeAPM removes this complexity by providing a single OpenTelemetry-native backend for metrics, logs, traces, and RUM—eliminating the need to manage Prometheus, Loki, or Tempo clusters. Its unified architecture scales automatically, offers predictable $0.15/GB pricing, and delivers full MELT visibility without the operational overhead of stitching multiple systems together.
This article shares valuable insights on the Top 7 Grafana alternatives, comparing the tools based on features, real-time performance monitoring, pricing, and customer reviews.
Top 7 Grafana Alternatives
- CubeAPM
- DataDog
- Dynatrace
- Splunk AppDynamics
- New Relic
- Coralogix
- Sentry
APM Tools Comparison: Grafana vs CubeAPM vs Others (2025)
Trial
| Tool | *Pricing (Small, Mid, Large) | Native OTEL | Support TAT | Deployment Options |
| CubeAPM | Small: $2,080 Mid: $7,200 Large: $15,200 | Yes | Within minutes | Self-hosted |
| New Relic | Small: $9,366 Mid: $32,115 Large: $70,220 | *No | 1hr to 2 business days | SaaS only |
| Datadog | Small: $8,185; Mid: $27,475 Large: $59,050 | *No | 2hrs to 2 business days | SaaS only |
| Dynatrace | Small: $7,740 Mid: $21,850 Large: $46,000 | *No | 4hrs to 4 business days | SaaS and Self-hosted |
| Splunk AppDynamics | Small: $2,650 Mid: $9,825 Large: $20,150 | *No | 2hrs to days | SaaS and Self-hosted |
| Grafana Cloud | Small: $3,870 Mid: $11,875 Large: $26,750 | Yes | 2hrs to 6hrs | SaaS and Self-hosted |
| Coralogix | Small: $4,090 Mid: $13,200 Large: $29,000 | Yes | Within minutes | SaaS only |
| Sentry | Small: $3,560; Mid: $12,100 Large: $32,400 | No | hrs to days | SaaS and Self-hosted |
*All pricing comparisons are calculated using standardized Small/Medium/Large team profiles defined in our internal benchmarking sheet, based on fixed log, metrics, trace, and retention assumptions. Actual pricing may vary by usage, region, and plan structure. Please confirm current pricing with each vendor.
*OTEL Sources: Datadog uses proprietary SDKs; Dynatrace uses collectors; Splunk AppDynamics uses collectors
Why Look for Grafana Alternatives?
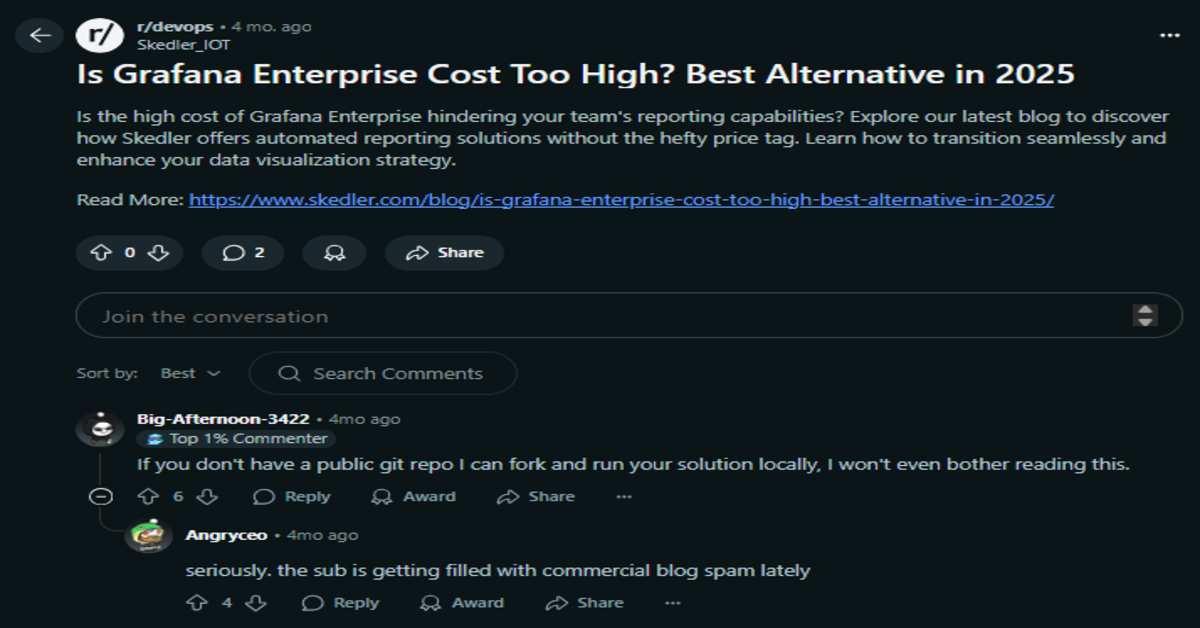
Image Source: Reddit
Grafana is a powerful tool, but most of its capabilities rely on connecting third-party backends—Prometheus for metrics, Loki for logs, Tempo for traces, and Alertmanager for alerts. As teams mature their DevOps and SRE practices, Grafana’s limitations become more evident:
1. Fragmented Stack
Grafana has multiple backends to manage, increasing complexity, especially during setup and configuration. For full-stack observability, Grafana’s LGTM stack(Loki, Grafana, Tempo, Mimir) requires a manual configuration of separate components: Prometheus(metrics), Loki(Logs), Tempo(Traces). This fragmented stack adds a layer of complexity that adds operational overhead.
2. Operational Complexity at Scale
For large deployments, Grafana requires configuring Prometheus nodes, scaling of Loki storage, and distributed alert routing—all of which add DevOps overhead and risk. Modern observability tools simplify this with managed backends and autoscaling ingest.
“While Grafana is great for data visualization, setting up some of the more advanced features can be a bit complex. It can take time to learn all the configurations and integrations, especially if you’re new to the platform.” (G2)
3. Steep Learning Curve
Many teams look for Grafana alternatives because the platform can be difficult to learn and navigate. While Grafana is powerful, its interface often feels overwhelming, with numerous panels, plugins, and configuration options that require significant expertise to use effectively. As dashboards and data sources grow, the UI becomes even more cluttered, making onboarding slower and day-to-day operations harder for teams that want a simpler, more intuitive experience.
“setting up some of the more advanced features can be a bit complex. It can take time to learn all the configurations and integrations, especially if you’re new to the platform.” (G2)
4. Overwhelming UI
Grafana is powerful, but many teams look for alternatives because it comes with a steep learning curve and an increasingly overwhelming UI. Its interface is packed with panels, plugins, data-source settings, and configuration layers that can feel complex even for experienced engineers.
“GUI can sometimes feel clumsy, with many windows and panels, making it difficult to scroll and navigate.” (G2)
Criteria for Suggesting Grafana Alternatives
To identify true alternatives to Grafana, we analyzed observability platforms based on practical enterprise needs—from OpenTelemetry adoption to deployment flexibility and cost control. Here’s what we prioritized:
1. Native MELT Coverage with Low Setup Overhead
Grafana relies on external tools, including Prometheus for metrics, Loki for logs, and Tempo for traces, requiring separate setup, scaling, and maintenance. This fragmented LGTM stack increases engineering overhead, often taking weeks to deploy, as noted in r/devops discussions.
For example, CubeAPM utilizes a single agent to collect all telemetry types, providing pre-built dashboards for instant insights. Unlike Grafana’s complex stack, these tools simplify deployment for teams lacking DevOps expertise.
2. Built-in OpenTelemetry & Prometheus Compatibility
OpenTelemetry and Prometheus are critical for vendor-neutral observability. Grafana supports both via Tempo (OpenTelemetry traces) and Prometheus (metrics), but the setup is complex, requiring expertise in PromQL and OpenTelemetry Collector pipelines. Tools like CubeAPM and Coralogix offer strong native support for both OpenTelemetry and Prometheus, simplifying instrumentation. Enterprises need alternatives that ingest OpenTelemetry metrics, logs, and traces and Prometheus metrics without converters.
3. Smarter Alerting & Anomaly Detection
Enterprises require intelligent alerting to mitigate alert fatigue and enhance resolution in complex systems. CubeAPM’s “Smart” Sampling optimizes signal-to-noise ratios, enhancing alert accuracy. Alternatives should offer AI-driven insights and contextual analysis to prioritize critical alerts.
4. Flexible Hosting (SaaS & Self-Managed)
Grafana offers open-source (self-hosted) and Grafana Cloud (SaaS) options; however, self-hosting requires managing Prometheus, Loki, and Tempo, which can be complex.
CubeAPM support both, with straightforward VPC setups for data control. Flexible hosting balances simplicity and compliance, critical for data sovereignty.
5. Transparent Pricing Models
Grafana Cloud’s free tier is generous, but advanced features and high-volume telemetry (e.g., logs) increase costs. Enterprises need clear, scalable pricing to avoid unpredictable costs. CubeAPM’s pricing ensures predictability, even for high-traffic systems. Alternatives should provide clear cost structures for metrics, logs, traces, and users, avoiding complex per-GB or per-host models.
CubeAPM’s capped pricing, particularly the Enterprise plan billed annually, supports scaling without surprises, which is critical for growing microservices. Transparent pricing aligns with enterprise budgeting, allowing teams to monitor their expenses comprehensively without compromising data ingestion due to cost concerns.
6. Seamless Integrations across the Stack
Grafana supports integrations with CI/CD, cloud platforms, Kubernetes, and tools like PagerDuty via plugins, but configuration is manual, requiring webhooks or custom setups.
CubeAPM and Datadog offer pre-built integrations for AWS, GCP, Kubernetes, and Slack, reducing setup time. Enterprises need seamless connectivity to streamline workflows, from monitoring Kubernetes pods to sending alerts in Slack, Email, or any other supported channel.
Grafana Overview
Known For
A highly customizable observability platform focused on time-series dashboards and visualization, popular with DevOps and infrastructure teams.
Standout Features
- Open-source flexibility with hundreds of plugins
- Prometheus, Loki, Tempo integration for metrics, logs, and traces
- Self-hosted and Grafana Cloud options
- Drag-and-drop dashboard editor and alerting features
Key Features
- OSS & Cloud Deployment: Grafana offers a free self-hosted edition and a hosted cloud version for teams that want managed infrastructure.
- Modular Telemetry with Tempo/Loki: Uses external backends (Prometheus for metrics, Loki for logs, Tempo for traces), allowing teams to plug in best-of-breed open-source components.
- Dashboard Customization: Robust templating, annotations, and shared dashboards across teams with RBAC and folder permissions.
- Community & Plugin Ecosystem: Extensive community support and hundreds of plugins for sources like MySQL, Redis, AWS, and Kubernetes.
Pros
- Free and open source with wide adoption
- Flexible dashboards and alerting options
- Seamless integration with Prometheus/Loki/Tempo
- Active community and plugin support
Cons
- Steep learning curve
- Complex setup requirements
- Overwhelming UI
Best For
Engineering teams with strong DevOps resources who want full control over their observability stack and prefer open-source tools.
Pricing & Customer Reviews
- Grafana OSS: Free
- Pro plan: $19/month
- Metrics: $6.50/ 1k series
- Logs: $0.50/GB ingested
- Traces: $0.50/GB ingested
- G2 Rating: 4.5/5
- Customers love its dashboarding and flexibility, but cite operational complexity at scale.
Top 7 Grafana Alternatives
1. CubeAPM Overview
Known For
CubeAPM is a modern, OpenTelemetry-native observability platform that offers full MELT (Metrics, Events, Logs, Traces) support, making it a compelling alternative to Grafana. It’s smart sampling uses deep context, such as comparing an API’s typical latency to current samples, to retain critical events while discarding noise, thereby achieving a high signal-to-noise ratio. This enables CubeAPM to handle higher incoming traffic while consuming significantly fewer resources.
Standout Features
- Smart Sampling Engine to reduce ingest and cost without losing important traces
- End-to-End MELT Coverage with built-in dashboards and alerting
- Self-hosting support for compliance and data localization
- Flat pricing up to 80% lower than traditional APMs
Key Features
- OpenTelemetry-Native Architecture: Ingests OTEL-compliant metrics, logs, and traces by default—no proprietary agent lock-in.
- Smart Trace Sampling: Filters out low-value traces at ingest to reduce volume and cost while preserving meaningful signals. Unlike tools requiring fixed sampling rates, CubeAPM dynamically decides what to retain, e.g., latency-spiked traces, without predefined percentages.
- Real-Time MELT Observability: Covers metrics, logs, traces, and events with unified dashboards and alert routing.
- Developer-Centric Workflows: Error inboxes, deployment markers, and alerting tailored for fast triaging and debugging.
- On-Prem & SaaS Flexibility: Can be deployed in private cloud or on-prem, unlike tools like Grafana Cloud or Datadog.
Pros
- Predictable, flat pricing with high ingest efficiency
- Full observability out of the box—no need to stitch together tools
- Native OpenTelemetry support from Day 1
- Ideal for teams seeking privacy, cost control, or regulated deployments
Cons
- Not suited for teams looking for off-prem solutions.
- Strictly an observability platform and doesn’t support cloud security management.
Best For
Teams that want modern, scalable, and privacy-respecting observability without the billing complexity of Datadog or the DIY overhead of Grafana.
Pricing & Customer Reviews: Ingestion-based
- Ingestion based pricing of $0.15/GB.
- No extra charge for indexed metrics or logs
- Rating: 4.7/5 ( based on pilot programs, Slack feedback, and demos)
- Customers appreciate the pricing model, low overhead, and OpenTelemetry compatibility
CubeAPM vs Grafana
While Grafana is well-known for its flexible dashboards, it requires integrating separate tools like Prometheus, Loki, and Tempo for full observability, leading to operational complexity and fragmented data pipelines. Grafana Cloud also adds variable ingestion costs, making pricing unpredictable at scale. In contrast, CubeAPM offers a fully integrated, OpenTelemetry-native observability platform with APM, logs, infra, RUM, and synthetics out of the box. It includes smart sampling, real-time support, and a flat $0.15/GB pricing model with no user limits—making it a simpler, more cost-effective solution for teams looking for turnkey observability without stitching together multiple tools.
2. Datadog
Known For
Datadog is widely recognized as a comprehensive, enterprise-grade observability platform that brings together metrics, logs, traces, real user monitoring (RUM), and security monitoring into a single SaaS product. It is especially known for its massive integration ecosystem (900+ services), cloud-native compatibility, and modular architecture that allows teams to monitor everything from infrastructure and containers to application performance and user experience.
Standout Features
- Comprehensive coverage across infra, apps, security, and UX
- Deep integrations with AWS, Kubernetes, and CI/CD pipelines
- Highly customizable dashboards and alerting
Key Features
- Unified Observability Stack: Supports metrics, logs, traces, RUM, and security all within one interface—ideal for centralized DevOps.
- 900+ Native Integrations: Out-of-the-box support for Kubernetes, AWS, Azure, GCP, Redis, MongoDB, and more.
- Machine Learning-Based Anomaly Detection: Built-in Watchdog feature helps detect unusual behavior across services automatically.
- Advanced Dashboarding & Collaboration: Custom dashboards, shared views, incident management, and integrations with Slack, PagerDuty, and Jira.
Pros
- Rich integration ecosystem for nearly every major tool
- Powerful multi-signal correlation and UX monitoring
- Rapid deployment via agents and cloud-native hooks
- Ideal for large-scale distributed systems and hybrid cloud
Cons
- The cost is extremely high for small and growing teams
- Steep learning curve
- Complexity makes navigation a challenge
Best For
Teams with deep DevOps expertise and budgets that can support a modular enterprise SaaS stack, and who require advanced integrations and security observability.
Pricing & Customer Reviews
- APM (Pro Plan): $35/host/month
- Infra (Pro Plan): $15/host/month
- Ingested Logs: $0.10 per ingested or scanned GB per month
- G2 Rating: 4.4/5
- Highly rated for features, but commonly flagged for pricing complexity and unexpected billing spikes
Datadog vs Grafana
Datadog’s advantage lies in its deep integrations and built-in security features, but it comes at a much higher and less predictable cost. Grafana suits teams that want control; Datadog is better for enterprises needing broad observability and quick deployment.
3. New Relic
Known For
New Relic is known for its programmable observability platform that offers APM, infrastructure monitoring, logs, traces, browser monitoring, and custom dashboards—all unified in one UI. It stands out with NRQL (New Relic Query Language), which gives engineers full control over telemetry queries and dashboard visualizations. While highly flexible and developer-centric, its usage + seat-based pricing and lack of self-hosting options have led many teams to seek simpler and more cost-transparent alternatives.
Standout Features
- NRQL Dashboards: Customizable dashboards powered by New Relic’s query language for advanced data slicing and visualization.
- Unified MELT UI: Single-pane view of metrics, logs, traces, and RUM—improves correlation during debugging.
- Lookout Anomaly Detection: Automatically detects and surfaces unusual behavior without manual thresholds.
- Built-in RUM & Synthetic Monitoring: Includes frontend performance tracking and synthetic testing out of the box.
- Broad Integration & Agent Coverage: Supports major cloud platforms, OpenTelemetry, and auto-instrumentation for key languages.
Key Features
- Programmable Dashboards with NRQL: New Relic provides a powerful query language (NRQL) for customizing dashboards, charts, and alerts. This is great for power users but comes with a learning curve.
- Full-Stack Telemetry in One UI: Brings together metrics, logs, traces, browser monitoring, and synthetics—all within a central observability interface.
- Lookout for Anomaly Detection: Uses baselining and deviation scoring to surface anomalies automatically across services.
- Browser and Synthetic Monitoring: Includes end-user monitoring capabilities such as RUM and synthetic checks, offering some frontend visibility natively.
Pros
- Strong dashboarding and custom visualization via NRQL
- Unified view of telemetry, including RUM and synthetics
- OpenTelemetry support for custom instrumentations
- Agent-based auto-instrumentation for major languages (Java, .NET, Node.js, Python)
Cons
- Pricing is complicated and expensive
- Steep learning curve
- Complexity of setup and NRQL queries
Best For
DevOps and engineering teams who need flexible, customizable dashboards and full-stack visibility—and can manage usage-based pricing and NRQL complexity.
Pricing & Customer Reviews
- Free tier: 100GB/month ingested
- Pro Plan: $0.40/GB ingested beyond the 100GB/month free limit
- Pro Plan: $349/month for full platform user
- G2 Rating: 4.4/5
- Users praise its rich features and flexibility, but flag pricing complexity and learning curve as major downsides.
New Relic vs Grafana
New Relic offers a full observability suite with APM, logs, traces, and browser monitoring. It provides more out-of-the-box telemetry coverage, but at a higher cost. Grafana is better for teams seeking lightweight, open-source visualization, while New Relic suits teams who need deep instrumentation + custom dashboards—if they can manage the pricing structure.
4. Coralogix
Known For
A full-stack observability platform optimized for cost efficiency through real-time stream processing, smart routing, and modular indexing. Popular with DevSecOps teams needing high log throughput, flexible pipelines, and security integration.
Standout Features
- Streama™ Architecture: Enables real-time log enrichment, alerting, and routing before logs are indexed or stored, improving performance and reducing cost.
- Indexless Ingestion: Logs can be streamed to dashboards or archived without indexing, helping teams control what data is stored, visualized, or analyzed.
- Customer-Controlled Archival: Archived logs are routed to the customer’s own cloud account, where Coralogix charges nothing. However, data first passes through Coralogix, triggering public cloud egress costs and violating strict data localization laws.
- GitOps-Based Configuration: Observability pipelines can be version-controlled and automated via Git, supporting CI/CD practices.
- Lightweight Security & Compliance Support: Features like audit trails, SIEM integration, and VPC hosting (optional) make it suitable for compliance-oriented teams.
Key Features
- Log-Centric Observability: Built primarily for high-throughput log management, but also supports metrics, traces, and security telemetry in unified dashboards.
- Flexible Archive & Routing Control: Teams can route logs directly to dashboards, alerts, or cold storage, with granular control over what’s indexed vs. archived.
- ML-Based Pattern Detection: Detects anomalies, spikes, or regressions using dynamic baselines—reducing alert fatigue and highlighting unseen issues.
- GitOps + CI/CD Friendly: Infrastructure-as-code model enables teams to manage dashboards and pipelines as code for repeatability and version control.
Pros
- Indexless ingestion dramatically lowers log storage costs.
- Smart routing minimizes ingest waste and boosts pipeline control.
- Archiving to the customer cloud saves on long-term storage fees.
- Real-time stream processing supports instant alerting
- GitOps-friendly observability-as-code model
Cons
- Steep learning curve/complexity for advanced usage
- Complicated UI for newcomers/beginners
- Pricing complexity, Pricing Complexity, while Coralogix optimizes costs, understanding its pricing model (based on ingestion, storage, and query frequency) can be tricky.
Best For
Log-heavy teams in compliance-sensitive industries who want to ingest control, cost-efficient routing, and custom archival strategies, as long as data localization is not a hard requirement.
Pricing & Customer Reviews
- Logs: $0.42/GB
- Traces: $0.16/GB
- Metrics: $0.05/GB
- AI: $1.5/1M tokens
- G2 Rating: 4.6/5
- Praised for: log pipeline flexibility, stream-based alerting, GitOps integrations
- Criticized for: limited APM/tracing depth, compliance risk in archive flow
Coralogix vs Grafana
Grafana excels in open-source dashboarding but requires Prometheus, Loki, and Tempo for full observability. Coralogix delivers full-stack observability with stream routing. It’s better than Grafana for real-time log pipelines and archive control, while Grafana remains stronger for visualizing multi-signal telemetry across complex stacks.
5. Splunk AppDynamics
Known For
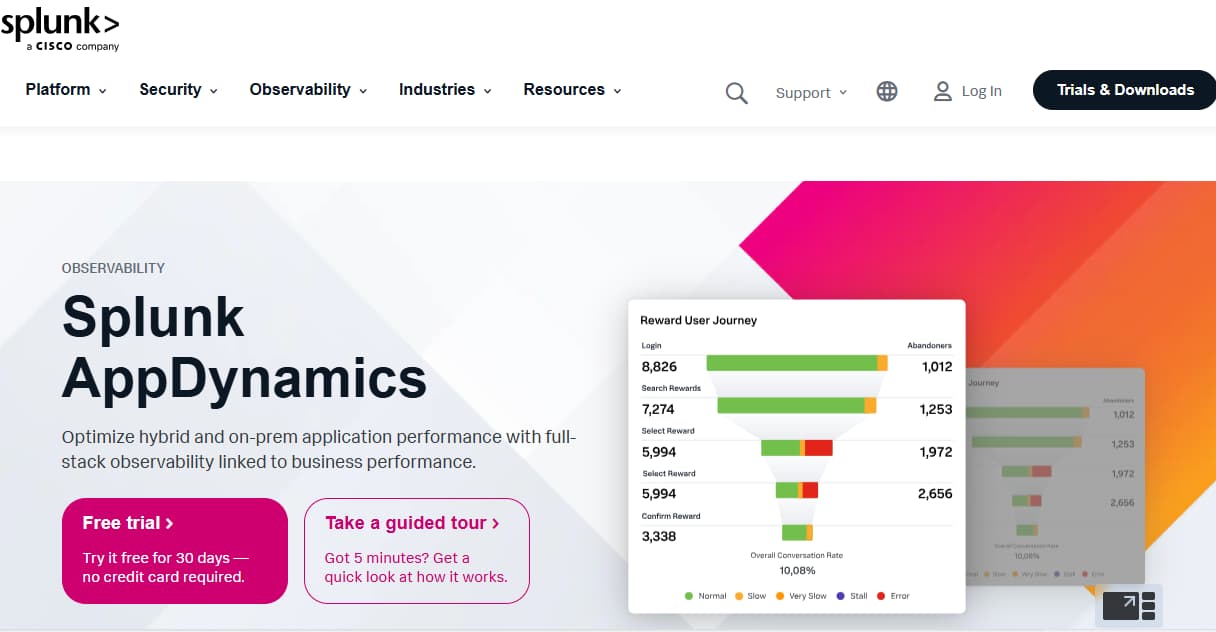
An enterprise-grade application performance monitoring (APM) platform from Cisco, Splunk AppDynamics is known for its deep code-level diagnostics, business transaction monitoring, and hybrid deployment flexibility. Large enterprises commonly use it to align technical performance with business KPIs.
Standout Features
- Business Transaction Monitoring: Maps transactions across distributed systems, making it easy to trace backend issues that impact revenue or user experience.
- On-Prem & SaaS Deployment Options: One of the few tools (besides CubeAPM) to support on-prem deployment for compliance-heavy organizations.
- Cisco Secure Application: Integrates runtime application security, helping teams detect vulnerabilities alongside performance metrics.
- Customizable Dashboards & Flow Maps: Allows detailed visualization of service dependencies, performance flow, and alerts tied to specific business processes.
Key Features
- Application-Centric APM: Splunk AppDynamics tracks application components and correlates performance data to critical business transactions such as checkout flows or user logins.
- Code-Level Diagnostics: Provides stack traces, method timings, and exception logging for Java, .NET, Node.js, and other supported runtimes.
- Real-Time Performance Baselines: Automatically establishes baselines and uses deviation analysis to alert teams about performance regressions.
- Full-Stack Monitoring with Infrastructure Agents: Supports hybrid environments (on-prem, cloud) and monitors servers, databases, containers, and services.
Pros
- Strong correlation of performance with business KPIs
- Deep diagnostics for backend languages and runtime monitoring
- Suitable for hybrid cloud and regulated deployments
- Built-in application security and audit support
- Enterprise-ready with robust role management and dashboards
Cons
- Expensive, users find the cost high for large organizations
- Complex setup & steep onboarding curve
- Non-intuitive interface for some use cases
Best For
Large enterprises seeking deep diagnostics, on-prem deployment, and visibility into business-critical applications—particularly those already using Cisco systems.
Pricing & Customer Reviews
- AppDynamics APM: starts at $33/month/CPU core
- Infra Monitoring: starts at $6/month/CPU core
- G2 Rating: 4.3/5
- Praised for: business correlation, transaction tracking, hybrid support
- Criticized for: legacy-heavy UX, slow iteration cycle, cost of ownership
Splunk AppDynamics vs Grafana
Grafana offers dashboarding flexibility and OSS freedom, but Splunk AppDynamics delivers deeper APM insights, code-level debugging, and hybrid infrastructure visibility. While Grafana is lightweight and customizable, Splunk AppDynamics provides structured, enterprise-ready monitoring built around performance KPIs. For teams needing infrastructure-to-business impact tracking, Splunk AppDynamics offers significantly more out-of-the-box than Grafana—but with more complexity and cost.
6. Dynatrace
Known For
Dynatrace is known for its AI-powered, full-stack observability platform that automates everything from instrumentation to anomaly detection. Its standout feature is the Davis AI engine, which offers real-time dependency mapping, root cause analysis, and performance baselining—making it a favorite among large-scale enterprises with complex architectures
Standout Features
- Davis AI Engine: Automatically detects anomalies, correlates telemetry signals, and pinpoints root causes with high accuracy.
- Smartscape Topology Mapping: Auto-discovers relationships between services, processes, and infrastructure in real time.
- Automatic Instrumentation: Installs with a single agent and automatically instruments apps, services, containers, and cloud infrastructure.
- Built-in Security Monitoring: Includes runtime vulnerability analysis and application-level risk assessment.
Key Features
- Full-Stack AI Observability: Combines metrics, logs, traces, user experience, and security into one AI-driven interface—ideal for unified monitoring at scale.
- No-Code Instrumentation: Automatically traces transactions across cloud-native architectures with minimal setup and no code changes.
- Native Cloud & Kubernetes Monitoring: Deep integrations with AWS, Azure, GCP, and Kubernetes—offering service flow maps and container-level telemetry.
- SLO Monitoring and Problem Resolution: Provides SLO dashboards, automatic problem detection, and impact analysis to help teams reduce MTTR and SLA violations.
Pros
- Industry-leading AI engine (Davis) for anomaly detection and RCA
- Seamless auto-instrumentation for microservices and containers
- Unified MELT observability with UX and security insights
- Strong SLO/SLA tracking and problem prioritization
- Trusted by large enterprises for performance and reliability
Cons
- Steep learning curve & complexity for new users
- High cost — pricing may become prohibitive at scale
- Overwhelming UI / feature overload
Best For
Enterprises with complex, distributed systems that want automated observability, smart anomaly detection, and unified telemetry under a single AI-driven platform.
Pricing & Customer Reviews
- Infrastructure Monitoring: $29 / mo per host
- Full-Stack Monitoring: $58 / mo per 8 GiB host
- G2 Rating: 4.5/5
- Praised for: automation, precision of root cause detection, and enterprise readiness
- Criticized for: high cost at scale, lack of OpenTelemetry-first design, and rigid pricing
Dynatrace vs Grafana
Grafana gives users full control over their dashboards and data sources, but requires manual configuration and multiple backends. Dynatrace offers a fully automated, AI-powered observability experience that removes setup burden but introduces complex host-based pricing. For teams needing hands-off observability and precise root cause insights, Dynatrace far exceeds Grafana—but at a higher cost.
7. Sentry
Known For
Sentry is best known for real-time error tracking and performance monitoring designed specifically for developers. It focuses on frontend and backend application health, with deep integrations into code repositories, enabling rapid triaging and debugging.
Standout Features
- Code-Level Error Tracing: Links stack traces to source code, enabling developers to pinpoint bugs down to the commit and file.
- Performance Monitoring for Frontend/Backend: Offers spans, transaction tracing, and latency insights—optimized for app teams rather than infrastructure.
- GitHub/GitLab Integration: Connects releases, issues, and performance changes directly to code changes.
Key Features
- Real-Time Application Monitoring: Captures runtime exceptions, API errors, and performance slowdowns across client and server apps with minimal instrumentation.
- Session & Release Tracking: Monitors release impact, adoption, and error trends across application versions—great for product teams shipping fast.
- Frontend + Backend Trace Views: Supports distributed tracing between frontend events and backend API calls with contextual performance insights.
- Source Code Context: Stack traces show code snippets and owners via GitHub/GitLab integration, helping teams resolve issues faster.
Pros
- Excellent for developers needing fast debugging and visibility into app crashes
- Native code integration and version awareness
- Easy to set up and scale for frontend/backend teams
- Self-hosted version available for privacy-conscious orgs
- Lightweight alternative to full-stack APMs
Cons
- Pricing issues, limited plans and expensive costs
- Complex configuration
- Delays in error reporting
Best For
Developer-focused teams looking for error tracking, frontend performance monitoring, and release health insights—without needing full-stack observability.
Pricing & Customer Reviews
- Free for 5K events
- Teams: $26/month
- Business: $80/month
- Enterprise: Custom pricing
- G2 Rating: 4.5/5
- Praised for: intuitive UI, debugging workflow, Git integration
- Criticized for: lack of infra observability and MELT coverage
Sentry vs Grafana
While Grafana targets infrastructure visibility and time-series dashboards, Sentry focuses entirely on application-level debugging. It excels in developer productivity and error tracking. For app teams, Sentry complements Grafana—but doesn’t replace it for full observability.
Conclusion: Choosing the Right Grafana Alternative
While Grafana excels at dashboarding, it often falls short in delivering unified observability, automation, and cost predictability, especially at scale. As engineering teams look for tools that combine full MELT coverage, OpenTelemetry support, and compliance-ready deployments, alternatives like CubeAPM, Datadog, Dynatrace, and Coralogix are gaining traction.
Among these, CubeAPM stands out with its smart sampling engine, flat pricing, and OpenTelemetry-native architecture, delivering full-stack observability without the complexity or surprise costs of traditional APM platforms.
If you’re looking to go beyond visualizations and adopt a platform built for modern, scalable observability, CubeAPM is the best Grafana alternative to consider in 2025.
*At the time of writing, all pricing details, feature limitations, and user-reported issues reflect the most up-to-date information available from public sources and vendor documentation. Observability platforms evolve quickly, so features, performance, and pricing may change over time. We recommend verifying the latest details directly with each vendor before making a final decision.
FAQs
1. What are the best Grafana alternatives in 2025?
Top alternatives include CubeAPM, Datadog, Splunk AppDynamics, and Sentrr. Each tool offers unique strengths in MELT coverage, OpenTelemetry support, pricing, and deployment flexibility
2. Why do teams switch from Grafana to other platforms?
Grafana excels at visualization but requires external tools like Prometheus, Loki, and Tempo for full-stack telemetry. Teams often migrate due to the desire for a unified MELT platform, smart alerting, and predictable pricing, without having to stitch together multiple components.
3. Which platform offers better observability than Grafana with self-hosting options?
CubeAPM and Splunk AppDynamics support both SaaS and on-prem/VPC deployment. CubeAPM combines full MELT coverage, OpenTelemetry-native ingestion, and data locality control, delivering observability without forgoing flexibility or compliance.
4. Are there Grafana alternatives with smart alerting and anomaly detection?
Yes—tools like CubeAPM, Datadog, Dynatrace, and New Relic offer intelligent alerting using AI or dynamic baselining. They can detect anomalies and correlate telemetry signals automatically—capabilities that Grafana lacks by default.
5. Can teams replace Grafana with a budget‑friendly observability platform?
Absolutely. CubeAPM provides transparent, flat pricing and smart sampling, making it up to 80% more cost-efficient than SaaS-heavy tools. Grafana OSS remains free, but CubeAPM delivers broader MELT observability and long-term scalability at startup-friendly pricing.


