










Azure OpenAI monitoring is not optional anymore. A single misconfigured deployment or untracked token spike can inflate your bill by thousands of dollars in days. Without proper monitoring, teams cannot see which endpoints are slow, which prompts are inefficient, or where token usage is bleeding budget. Azure’s native tooling gives you raw metrics, but it does not give you context, alerting depth, or the ability to tie token usage back to specific services or users.
This guide compares 10 Azure OpenAI monitoring tools across token tracking, latency visibility, cost control features, and deployment model. Each tool is assessed on real pricing, OpenTelemetry compatibility, and how well it handles the unique challenges of monitoring generative AI workloads at scale.
Quick comparison: 10 Azure OpenAI monitoring tools at a glance
| Tool | Best For | Pricing Model | On-Prem? | Token Usage Tracking |
|---|---|---|---|---|
| CubeAPM | Teams needing full-stack observability with Azure OpenAI monitoring inside their VPC | $0.20/GB ingestion | ✓ First-class | Native, correlated with traces |
| Azure Monitor | Teams already on Azure with basic monitoring needs | $2.76/GB logs ingested + query costs | ✗ Azure only | Native via Log Analytics |
| Datadog | Multi-cloud teams needing broad integrations | $15/host/mo + $0.10/GB logs | ✗ SaaS only | Via custom metrics, APM trace tags |
| New Relic | Teams wanting managed observability with AI monitoring add-ons | $0.40/GB beyond 100 GB free | ✗ SaaS only | Via custom events, dashboards |
| LogicMonitor | Enterprises needing broad infrastructure + Azure OpenAI visibility | Custom pricing, typically $5–$10/device/mo | ✗ SaaS only | Via Azure integration, dashboards |
| Dynatrace | Enterprises wanting AI-driven root cause analysis | Host-based, typically $0.08/host hour | ✓ Yes | Via Azure integration, AI insights |
| Grafana + Prometheus | Teams with existing Prometheus/Grafana stacks | Free OSS, Grafana Cloud from $0.30/GB | ✓ Self-hosted | Manual via Azure metrics scraping |
| Elastic APM | Teams already using Elastic Stack for logs and traces | Free OSS, Elastic Cloud from $95/mo | ✓ Self-hosted | Via APM agents, custom dashboards |
| Splunk | Enterprises with SIEM and log analytics requirements | $150/GB ingested + index license | ✓ Yes | Via Azure add-on, Splunk dashboards |
| Better Stack | Startups needing fast setup and developer-friendly UX | Free tier, paid from $29/mo | ✗ SaaS only | Via integrations, custom dashboards |
Why Azure OpenAI monitoring is different from standard APM
Azure OpenAI is not just another API. It has unique cost, latency, and failure characteristics that standard APM tools miss.
Token usage drives unpredictable costs. Unlike infrastructure that scales predictably with traffic, Azure OpenAI costs scale with token volume, which varies wildly based on prompt length, model choice, and user behavior. A single inefficient prompt template can double your monthly bill without changing request count.
Latency is split across multiple stages. Time to first token, time between tokens, and total response time all matter. Monitoring only end-to-end latency hides bottlenecks in token generation or streaming.
Throttling and quota limits are API-specific. Azure enforces token-per-minute quotas per deployment. Standard APM tools do not surface quota exhaustion as a distinct failure mode. Without monitoring that understands Azure OpenAI’s rate limits, teams mistake throttling for backend failures.
Context matters for debugging. When a request fails or is slow, you need to see the full context: which model, which deployment, which user, what prompt length, and what the token usage was. Standard APM tools do not link these dimensions without custom instrumentation.
1. CubeAPM
CubeAPM is a self-hosted, full-stack observability platform that runs inside your VPC and natively monitors Azure OpenAI deployments alongside your application traces, logs, and infrastructure metrics. It correlates token usage, latency, and errors with the rest of your stack so you can see exactly which service, endpoint, or user is driving Azure OpenAI costs.
Key Features:
- Native token usage tracking correlated with distributed traces
- Latency breakdowns showing time to first token and total response time
- Cost attribution per service, endpoint, or deployment
- Alerts on token quota exhaustion, latency spikes, and error rates
- Self-hosted deployment with no data egress to external SaaS
Pricing: $0.20/GB ingested, covers all telemetry including Azure OpenAI metrics, traces, and logs. No per-host or per-user fees.
Pros:
- Unified view of Azure OpenAI metrics, application traces, and infrastructure in one platform
- Self-hosted deployment keeps Azure OpenAI telemetry private
- Predictable pricing with no surprise overages
- Fast time to value with OpenTelemetry-native ingestion
Cons:
- Requires self-hosted deployment, not a fully managed SaaS
- Smaller ecosystem compared to Datadog or Dynatrace
Best for: Teams needing full-stack observability with Azure OpenAI monitoring inside their own cloud, with predictable pricing and data control.
2. Azure Monitor
Azure Monitor is Microsoft’s native observability service, built directly into Azure. It collects metrics, logs, and diagnostic data from Azure OpenAI deployments through Log Analytics Workspace and Azure Monitor Insights.
Key Features:
- Native integration with Azure OpenAI via diagnostic settings
- Metrics for request count, token usage, latency, and error rates
- Log Analytics queries using Kusto Query Language (KQL)
- Workbooks for visualizing Azure OpenAI performance
- Alerts on metrics and log patterns
Pricing: $2.76/GB for logs ingested into Log Analytics, plus query costs and data retention fees. Metrics are included with Azure OpenAI at no extra charge.
Pros:
- No setup required; diagnostic data flows automatically
- Deep integration with Azure services
- Free metrics, pay only for logs and queries
Cons:
- Query performance degrades with high log volume
- Limited correlation with non-Azure services
- KQL learning curve for teams unfamiliar with Azure
- Costs increase sharply with log retention and query frequency
Best for: Teams already on Azure with basic monitoring needs and willingness to learn KQL for deeper analysis.
3. Datadog
Datadog is a multi-cloud SaaS observability platform with broad integrations. It monitors Azure OpenAI through custom metrics, APM trace tags, and an Azure integration that pulls metrics from Azure Monitor.
Key Features:
- Azure OpenAI metrics via Azure integration
- Custom dashboards for token usage and latency
- APM traces tagged with model, deployment, and token count
- Anomaly detection on token usage and error rates
- 700+ integrations for multi-cloud stacks
Pricing: $15/host/mo for infrastructure monitoring, $42/host/mo for APM, plus $0.10/GB for logs. Azure OpenAI monitoring requires custom metrics, which add cost.
Pros:
- Broad ecosystem and multi-cloud support
- Rich dashboards and visualization options
- Strong anomaly detection and alerting
Cons:
- Expensive at scale; per-host pricing compounds fast
- Requires manual instrumentation for detailed token tracking
- Data leaves your cloud, which may not meet compliance requirements
Best for: Multi-cloud teams needing broad integrations and willing to pay premium pricing for managed observability.
4. New Relic

New Relic is a managed observability platform offering APM, logs, infrastructure monitoring, and custom dashboards. Azure OpenAI monitoring is done through custom events and New Relic’s Azure integration.
Key Features:
- Azure integration pulls metrics from Azure Monitor
- Custom events for token usage, model, and deployment tags
- Dashboards and NRQL queries for Azure OpenAI analysis
- Alerts on latency, error rates, and token quotas
- Log correlation with APM traces
Pricing: $0.40/GB ingested beyond 100 GB free per month. User seats range from free to $99/user/mo depending on plan.
Pros:
- Generous free tier for small teams
- Unified platform for APM, logs, and custom metrics
- Strong query language (NRQL) for custom analysis
Cons:
- Proprietary NRQL creates lock-in
- Pricing becomes expensive beyond the free tier
- Azure OpenAI monitoring requires custom instrumentation
Best for: Teams wanting managed observability with AI monitoring add-ons and willing to invest in custom instrumentation.
5. LogicMonitor
LogicMonitor is an infrastructure monitoring platform with SaaS delivery. It monitors Azure OpenAI deployments through an Azure integration that collects metrics and surfaces them in pre-built dashboards.
Key Features:
- Azure OpenAI metrics via Azure integration
- Pre-built dashboards for token usage and latency
- Alerts on quota exhaustion and error rates
- Broad infrastructure monitoring across cloud and on-prem
- Automated topology mapping
Pricing: Custom pricing, typically $5–$10/device/mo. Azure OpenAI monitoring is included with Azure integration.
Pros:
- Low setup burden with pre-built Azure integration
- Strong infrastructure monitoring alongside Azure OpenAI
- Automated discovery and alerting
Cons:
- Limited APM depth compared to Datadog or New Relic
- Dashboards less customizable than open-source alternatives
- SaaS only, no on-prem option
Best for: Enterprises needing broad infrastructure monitoring with Azure OpenAI visibility without deep APM requirements.
6. Dynatrace
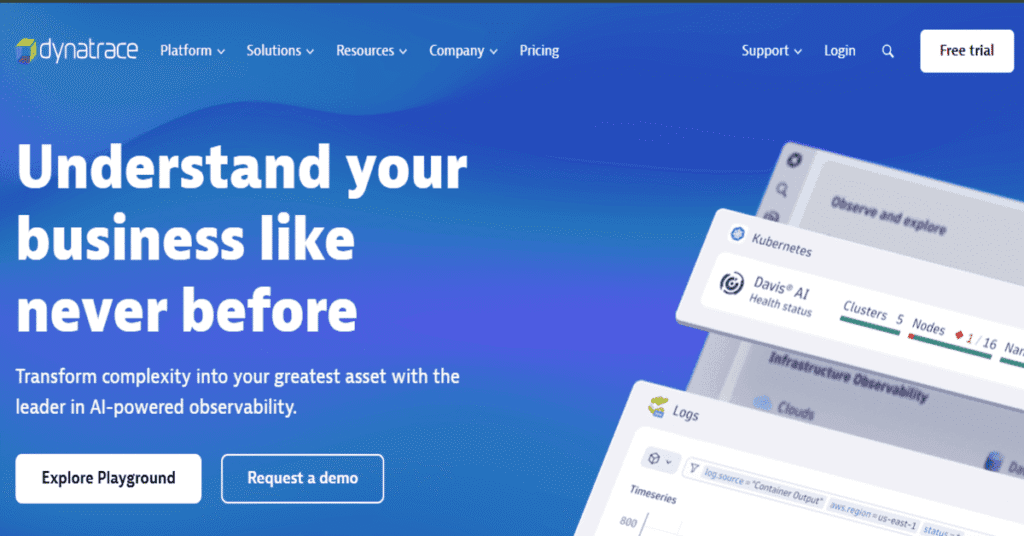
Dynatrace is an enterprise observability platform with AI-driven root cause analysis. It monitors Azure OpenAI through Azure integration and custom extensions that collect token metrics and trace data.
Key Features:
- Azure integration for OpenAI metrics
- AI-driven anomaly detection and root cause analysis
- Distributed tracing with Azure OpenAI context
- Business impact analysis linking Azure OpenAI performance to user experience
- Self-hosted or SaaS deployment
Pricing: Host-based pricing, typically $0.08/host hour, plus add-ons for logs, synthetics, and advanced features. Enterprise discounts available.
Pros:
- Strong AI-driven insights and automated root cause analysis
- Deep integration across Azure services
- Self-hosted option available for regulated environments
Cons:
- Expensive, especially for large deployments
- Complex pricing model with many add-ons
- Requires significant configuration for Azure OpenAI monitoring
Best for: Enterprises wanting AI-driven root cause analysis and willing to invest in premium pricing and setup.
7. Grafana + Prometheus
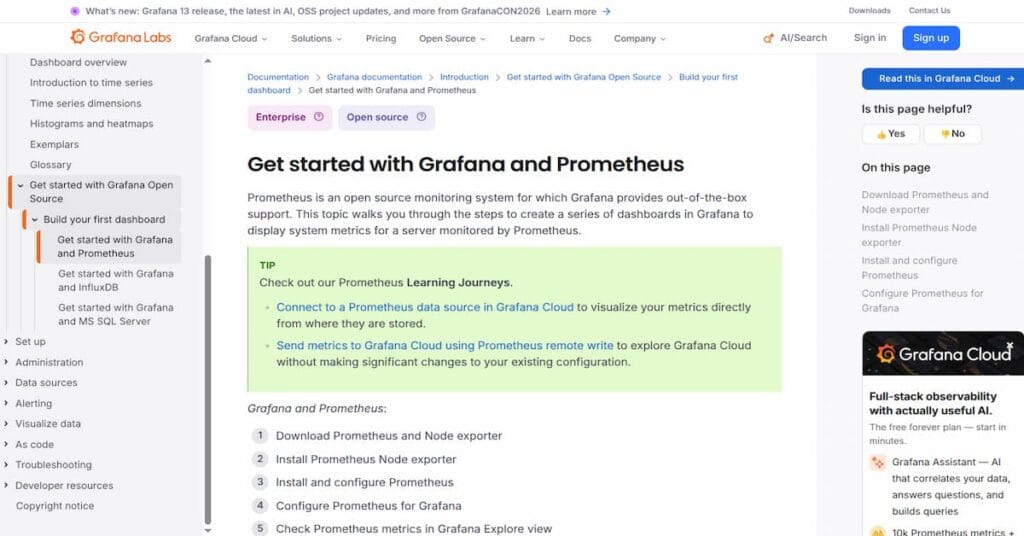
Grafana and Prometheus are open-source tools widely used for metrics collection and visualization. Azure OpenAI monitoring is done by scraping Azure Monitor metrics with the Prometheus Azure exporter and visualizing them in Grafana dashboards.
Key Features:
- Open-source, fully customizable
- Azure exporter collects OpenAI metrics from Azure Monitor
- Pre-built Grafana dashboards for Azure services
- Alertmanager for metric-based alerting
- Self-hosted or Grafana Cloud SaaS
Pricing: Free OSS. Grafana Cloud starts at $0.30/GB for logs, with a free tier for metrics and traces.
Pros:
- No vendor lock-in, fully open source
- Strong community and pre-built dashboards
- Self-hosted option with full control
Cons:
- Manual setup required for Azure OpenAI metrics
- No native log correlation with traces
- Requires Prometheus expertise for effective use
Best for: Teams with existing Prometheus/Grafana stacks wanting to add Azure OpenAI monitoring without new vendor costs.
8. Elastic APM
Elastic APM is part of the Elastic Stack (Elasticsearch, Logstash, Kibana). It monitors applications through APM agents and correlates with logs stored in Elasticsearch. Azure OpenAI monitoring is done through custom instrumentation and Azure metrics ingestion.
Key Features:
- APM agents for distributed tracing
- Custom instrumentation for Azure OpenAI token tracking
- Logs and metrics stored in Elasticsearch
- Kibana dashboards for visualization
- Self-hosted or Elastic Cloud SaaS
Pricing: Free OSS. Elastic Cloud starts at $95/mo for the standard plan.
Pros:
- Unified platform for logs, metrics, traces
- Self-hosted option with full control
- Strong search and analysis capabilities
Cons:
- Requires Elastic Stack expertise
- Manual instrumentation for Azure OpenAI monitoring
- Performance tuning needed at scale
Best for: Teams already using Elastic Stack for logs and traces wanting to add Azure OpenAI monitoring.
9. Splunk
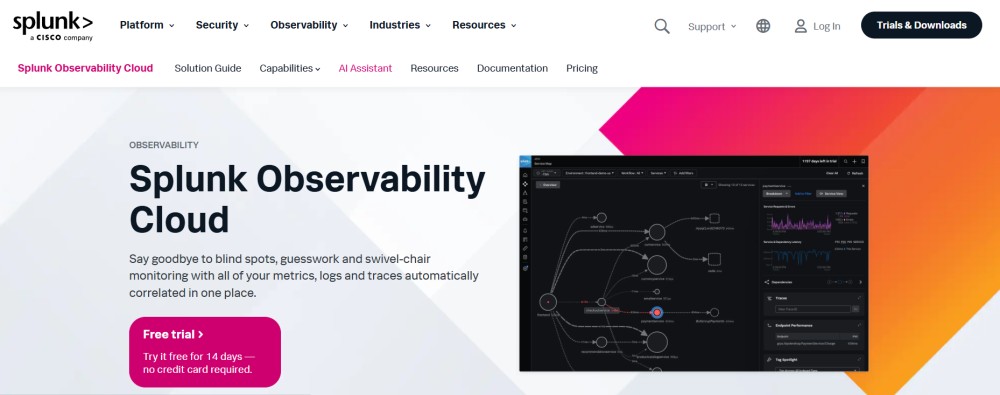
Splunk is an enterprise platform for log analytics, SIEM, and observability. Azure OpenAI monitoring is done through Splunk’s Azure add-on, which collects metrics and logs from Azure Monitor.
Key Features:
- Azure add-on for OpenAI metrics and logs
- Pre-built dashboards for Azure services
- Advanced search and correlation with SPL (Splunk Processing Language)
- SIEM capabilities for security monitoring
- Self-hosted or Splunk Cloud SaaS
Pricing: $150/GB ingested plus index license fees. Enterprise pricing varies widely based on volume and retention.
Pros:
- Enterprise-grade log analytics and SIEM
- Deep Azure integration
- Strong compliance and audit capabilities
Cons:
- Extremely expensive at scale
- Complex pricing model
- Requires Splunk expertise
Best for: Enterprises with SIEM and log analytics requirements needing Azure OpenAI visibility alongside security monitoring.
10. Better Stack
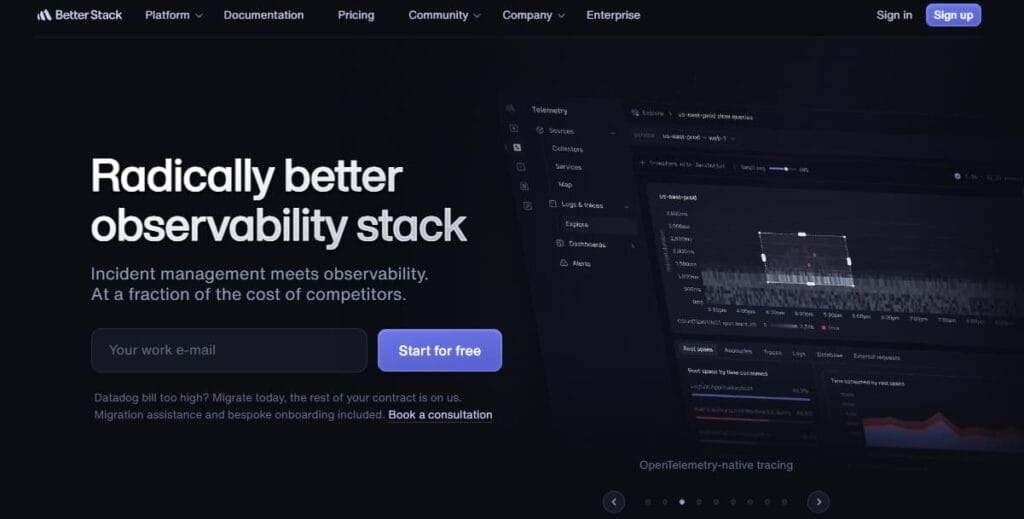
Better Stack (formerly Logtail) is a developer-friendly SaaS platform for logs, uptime monitoring, and incident management. Azure OpenAI monitoring is done through custom log ingestion and integrations.
Key Features:
- Fast log search and visualization
- Custom dashboards for Azure OpenAI metrics
- Uptime monitoring and alerting
- Incident management with on-call scheduling
- Integrations with Azure services
Pricing: Free tier with 1 GB/mo retention. Paid plans start at $29/mo with usage-based scaling.
Pros:
- Fast setup with minimal configuration
- Developer-friendly UI
- Affordable for small teams
Cons:
- Limited APM depth compared to Datadog or New Relic
- SaaS only, no self-hosted option
- Requires custom instrumentation for token tracking
Best for: Startups needing fast setup and developer-friendly UX for Azure OpenAI monitoring without heavy enterprise requirements.
How to choose the right Azure OpenAI monitoring tool
Choosing the right tool depends on five factors: deployment model, cost structure, existing stack, monitoring depth, and team size.
Deployment model matters for compliance and cost. If you have data residency requirements or want to avoid Azure egress fees, choose a tool that runs in your VPC like CubeAPM, Grafana, or Elastic APM. If you prefer managed SaaS and compliance is not a blocker, Datadog, New Relic, or Better Stack are easier to operate.
Cost structure varies wildly. Azure Monitor charges per GB of logs with query costs on top. Datadog and Dynatrace charge per host plus add-ons. CubeAPM and New Relic charge per GB ingested. Model your actual usage before committing. A team ingesting 10 TB/month of telemetry will pay $27,000/month on Datadog but $1,500/month on CubeAPM.
Existing stack determines integration effort. If you already use Prometheus and Grafana, adding Azure OpenAI metrics is simpler than adopting a new platform. If you are already on Elastic Stack, adding Azure OpenAI monitoring through APM agents is faster than switching to New Relic.
Monitoring depth depends on your use case. If you only need token usage and basic latency tracking, Azure Monitor or LogicMonitor are sufficient. If you need full distributed tracing with Azure OpenAI context correlated with application traces and logs, choose CubeAPM, Datadog, or Dynatrace.
Team size affects complexity tolerance. Small teams (under 10 engineers) benefit from Better Stack or Azure Monitor with minimal setup. Mid-size teams (10–50 engineers) need more depth and should consider CubeAPM, Grafana, or Elastic APM. Large enterprises (50+ engineers) need platforms like Datadog, Dynatrace, or Splunk that handle multi-cloud complexity.
Monitoring Azure OpenAI with CubeAPM

CubeAPM monitors Azure OpenAI deployments by collecting metrics, traces, and logs through OpenTelemetry instrumentation and Azure Monitor integration. It correlates token usage, latency, and errors with distributed traces so teams can see exactly which service, endpoint, or user is driving costs.
How it works: CubeAPM ingests Azure OpenAI metrics via OpenTelemetry or Azure Monitor export. It automatically tags traces with model, deployment, token count, and latency breakdowns. Teams can filter by service, endpoint, user, or deployment to see cost attribution and performance patterns.
What it surfaces:
- Token usage per request, service, and deployment
- Latency breakdowns: time to first token, time between tokens, total response time
- Error rates by model and deployment
- Quota exhaustion alerts
- Cost trends over time with attribution to specific services
Why it simplifies Azure OpenAI monitoring: Unlike Azure Monitor which requires manual KQL queries, or Datadog which requires custom instrumentation, CubeAPM provides out-of-the-box correlation between Azure OpenAI metrics and your application stack. It runs in your VPC so Azure OpenAI telemetry never leaves your cloud.
Disclaimer: Pricing based on publicly available information as of April 2026. Enterprise discounts, custom contracts, and negotiated rates are not reflected here.
Disclaimer: The information in this article reflects the latest details available at the time of publication and may change as technologies and products evolve. Features, pricing, and plan limits can change over time. Always verify the latest information directly with the vendor before making purchasing or deployment decisions.
Frequently Asked Questions
What metrics should I track for Azure OpenAI?
Track token usage per request, time to first token, time between tokens, total response time, error rate by model, and quota utilization. These metrics surface cost drivers, latency bottlenecks, and rate limit issues.
How does Azure Monitor track Azure OpenAI usage?
Azure Monitor collects metrics and logs through diagnostic settings. Enable diagnostics on your Azure OpenAI resource, send data to a Log Analytics Workspace, and query with KQL to analyze token usage and latency.
Can I monitor Azure OpenAI with Prometheus?
Yes, use the Prometheus Azure exporter to scrape Azure Monitor metrics. Configure the exporter with your Azure credentials, define scrape targets for Azure OpenAI resources, and visualize in Grafana dashboards.
What is the difference between Azure Monitor and third-party tools?
Azure Monitor is native to Azure with automatic integration but limited correlation with non-Azure services. Third-party tools like CubeAPM, Datadog, or Dynatrace provide deeper APM, log correlation, and multi-cloud visibility.
How much does Azure OpenAI monitoring cost?
Costs vary by tool. Azure Monitor charges $2.76/GB for logs plus query costs. Datadog charges per host plus custom metrics. CubeAPM charges $0.20/GB for all telemetry. Model your usage to estimate real costs.
How do I set up alerts for Azure OpenAI quota limits?
In Azure Monitor, create a metric alert on Tokens Used or Requests per minute. Set a threshold near your quota limit and route alerts to email, Teams, or PagerDuty. Most third-party tools support similar quota alerts.
What is the best tool for monitoring Azure OpenAI at scale?
For teams under 10 TB/month, Azure Monitor or CubeAPM provide good value. Above 10 TB/month, CubeAPM or self-hosted Grafana avoid the cost explosion of per-host SaaS tools like Datadog or Dynatrace.