










Azure Kubernetes Service scales infrastructure fast, but without proper monitoring, you only discover problems after they cascade. A pod restart loop, node pressure, or HPA scaling failure can degrade performance for hours before anyone notices. The right AKS monitoring tool surfaces these signals in real time and connects them to the exact workload, namespace, or configuration change that caused the failure.
According to the CNCF Annual Survey 2024, 83% of organizations now use Kubernetes in production, making Kubernetes the de facto orchestration platform. But the survey also found that complexity and observability remain the top operational challenges. Azure Kubernetes Service abstracts away some of that complexity, but monitoring AKS clusters still requires tracking control plane health, node conditions, pod-level metrics, ingress latency, and application traces across distributed workloads.
This guide compares 10 tools built to monitor AKS clusters, evaluated on cost model, native Azure integration, Kubernetes signal depth, and what each platform misses. Every pricing figure links to the vendor’s official pricing page. All cost scenarios assume a 50-node AKS cluster with moderate log and metric volume.
Quick Comparison: 10 AKS Monitoring Tools at a Glance
| Tool | Best For | Pricing | Free Plan | On-Prem Option |
|---|---|---|---|---|
| Azure Monitor Container Insights | Native Azure integration, control plane logs | Pay-per-GB ingestion, starts at $2.50/GB | 5 GB free/month | No |
| CubeAPM | Self-hosted, data-sovereign teams | $0.20/GB ingestion, unlimited users | Free Trial | Yes |
| Datadog | Multi-cloud teams, broad integrations | $15/host/month base + APM add-ons | 14-day trial | No |
| Dynatrace | Enterprise AI-driven root cause | Host-based, starts at $74/host/month | 15-day trial | Yes |
| New Relic | Full-stack observability with AKS | $0.40/GB ingestion beyond free tier | 100 GB free/month | No |
| Grafana + Prometheus | Open source, full control | Free OSS, Grafana Cloud from $0 | Yes | Yes |
| Elastic APM | Teams already on ELK stack | Free OSS, Elastic Cloud from $99/month | Yes | Yes |
| Splunk | Enterprise SIEM, security focus | Infrastructure Monitoring starts at $15/host/month | No | Yes |
| SigNoz | OpenTelemetry-native, self-hosted | Free OSS, Cloud from $0.30/GB | Yes | Yes |
| AppDynamics | Cisco-heavy enterprises | vCPU-based, enterprise contact only | 15-day trial | Yes |
1. Azure Monitor Container Insights
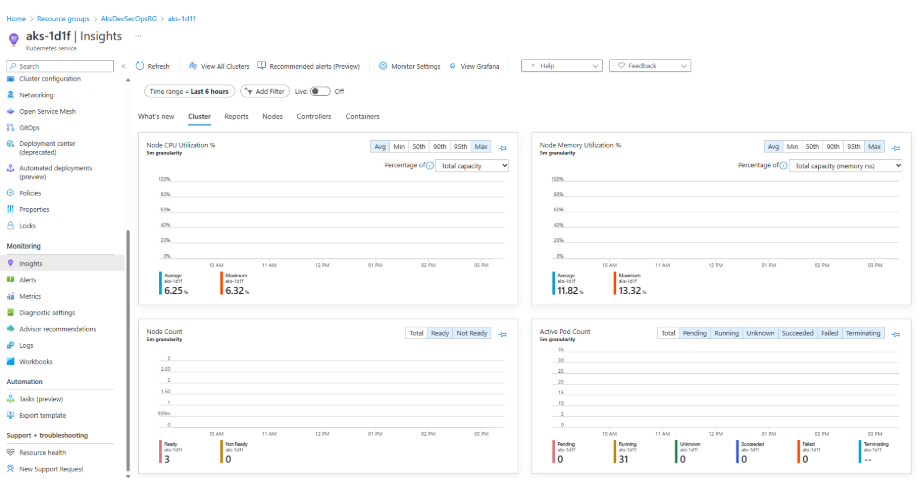
Azure Monitor Container Insights is Microsoft’s native AKS monitoring solution. It collects logs and metrics from AKS clusters, stores them in Log Analytics workspaces, and provides built-in dashboards for cluster health, node performance, and pod resource usage.
Key Features:
- Native integration with Azure Kubernetes Service control plane logs
- Cluster-level health views, node condition tracking, pod CPU and memory metrics
- Log Analytics workspace integration for custom queries using KQL
- Built-in workbooks for visualizing cluster performance
- Direct access to AKS diagnostic settings and control plane audit logs
Pricing:
Azure Monitor charges per GB of data ingested into Log Analytics workspaces. Pricing starts at $2.50/GB for the first 5 GB, with a 5 GB free tier per billing account. A 50-node AKS cluster generating 30 GB of logs and metrics monthly costs approximately $75/month before retention or query costs.
Pricing based on publicly available information as of April 2026. Enterprise discounts and retention beyond 31 days are not reflected here.
Pros:
- Zero setup friction; enabled directly from the Azure portal
- Native access to AKS control plane logs not available in third-party tools
- KQL queries allow deep filtering by pod labels, namespaces, and node conditions
Cons:
- KQL learning curve; requires mastering a query language specific to Azure
- No distributed tracing or application-level APM; Container Insights only tracks infrastructure
- Cost scales unpredictably with verbose logging or high-cardinality metrics
Best for: Teams running workloads exclusively on Azure who want native AKS integration without installing agents or managing external platforms.
2. CubeAPM
CubeAPM is a self-hosted observability platform that runs inside your VPC or data center. It monitors AKS clusters, nodes, pods, and applications with full-stack visibility across metrics, logs, traces, and Kubernetes events. Unlike SaaS platforms, telemetry data never leaves your infrastructure.
Key Features:
- Native Kubernetes operator for AKS with Helm chart deployment
- Pod-level, node-level, and cluster-level metrics with high-cardinality search
- Distributed tracing correlated with pod and namespace context
- Log aggregation from all pods with full-text search and filtering
- Kubernetes event tracking linked to metric spikes and trace failures
- Unlimited data retention with no additional cost
- OpenTelemetry-native; works with existing OTel agents
Pricing:
CubeAPM charges $0.20/GB for data ingestion with no per-host, per-user, or per-feature fees. A 50-node AKS cluster ingesting 30 GB/month of metrics, logs, and traces costs $4.50/month for data ingestion plus infrastructure hosting costs.
This estimate models a production-ready setup. Smaller deployments may cost significantly less.
Pros:
- Full data sovereignty; telemetry stays inside your Azure subscription
- Unlimited retention without egress or storage surcharges
- Correlates Kubernetes events, metrics, and application traces in one UI
- No vendor lock-in; built on OpenTelemetry
Cons:
- Requires managing infrastructure; you deploy and maintain the platform
- Smaller integration ecosystem compared to enterprise SaaS tools
- No autonomous anomaly detection
Best for: Teams with data residency requirements, cost-sensitive engineering orgs, or anyone who wants full control over monitoring infrastructure.
3. Datadog
Datadog is a cloud-based observability platform with deep Azure integration. It monitors AKS clusters via the Datadog Agent, collecting metrics, logs, traces, and live process data. Datadog’s strength is breadth; it connects Kubernetes telemetry with application performance, cloud resources, and business metrics in one platform.
Key Features:
- AKS-specific dashboards showing pod health, node utilization, and deployment status
- Live container view with real-time CPU, memory, and network metrics
- Distributed tracing correlated with Kubernetes pod and service tags
- Log aggregation with pattern detection and anomaly alerts
- Integration with Azure Monitor for control plane metrics
Pricing:
Datadog charges per host. Infrastructure Monitoring starts at $15/host/month, APM costs $31/host/month, and logs cost $0.10/GB ingested plus $1.70/million events indexed. A 50-node AKS cluster with APM and 30 GB of logs costs approximately $2,300/month.
Pricing based on publicly available information as of April 2026. Enterprise discounts are not reflected here.
Pros:
- Unified view across AKS, Azure services, and application code
- Strong anomaly detection and correlation across signals
- 700+ integrations including Azure DevOps, GitHub, and PagerDuty
Cons:
- Per-host pricing scales linearly with cluster size; auto-scaling increases bills immediately
- Logs incur double charges: $0.10/GB ingestion + $1.70/million indexed events
- SaaS-only deployment; no option to keep telemetry on-prem
Best for: Multi-cloud enterprises that need broad integration coverage and can absorb predictable cost growth as infrastructure scales.
4. Dynatrace
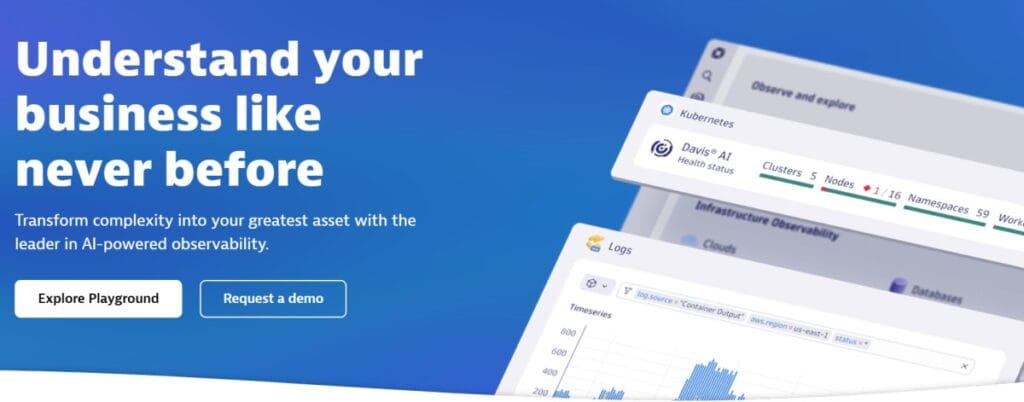
Dynatrace is an enterprise observability platform with AI-driven root cause analysis. Its OneAgent automatically discovers AKS workloads, instruments applications, and correlates infrastructure health with user experience. Dynatrace is built for large organizations that want automated triage and deep trace analysis without manual configuration.
Key Features:
- Automatic AKS discovery and instrumentation via OneAgent
- AI-driven root cause analysis linking pod failures to code-level issues
- Full-stack visibility from Kubernetes metrics to application traces
- Smartscape topology maps showing dependencies between pods, services, and databases
- Session replay and real user monitoring correlated with backend traces
Pricing:
Dynatrace charges per host. Full-stack monitoring starts at $74/host/month for infrastructure and application monitoring. A 50-node AKS cluster costs $3,700/month before logs, synthetics, or session replay.
Pricing based on publicly available information as of April 2026. Custom contracts and negotiated rates are not reflected here.
Pros:
- AI-powered root cause analysis reduces manual investigation time
- Automatic instrumentation; minimal setup for AKS workloads
- Strong user experience correlation with backend Kubernetes health
Cons:
- High cost for smaller teams or startups
- Proprietary agent and query language create vendor lock-in
- SaaS-first with limited on-prem flexibility
Best for: Large enterprises with budget for premium tooling and teams that want AI-assisted troubleshooting.
5. New Relic

New Relic is a full-stack observability platform with native Kubernetes monitoring. It tracks AKS cluster health, pod performance, and application traces in a unified interface. New Relic’s Kubernetes integration auto-discovers workloads and links metrics to distributed traces.
Key Features:
- Kubernetes cluster explorer showing node health, pod status, and deployment rollouts
- Golden signals (latency, traffic, errors, saturation) at service and pod level
- Distributed tracing with automatic Kubernetes context tagging
- NRQL queries for custom dashboards and alerting
- Integration with Azure Monitor for control plane logs
Pricing:
New Relic charges per GB of data ingested. Pricing starts at $0.40/GB beyond the 100 GB free tier. A 50-node AKS cluster ingesting 200 GB/month costs approximately $40/month for ingestion alone, but user seats add $99–$549/user/month depending on tier.
Pricing based on publicly available information as of April 2026. Full platform user costs are not reflected in the ingestion-only estimate.
Pros:
- 100 GB free tier covers small AKS clusters
- Single interface for Kubernetes, logs, and APM
- Strong query capabilities with NRQL
Cons:
- Per-seat pricing for full platform access locks out junior engineers on large teams
- NRQL creates vendor lock-in; dashboards and alerts are non-portable
- SaaS-only deployment with no on-prem option
Best for: Teams already using New Relic for APM who want to add Kubernetes visibility without switching platforms.
6. Grafana + Prometheus
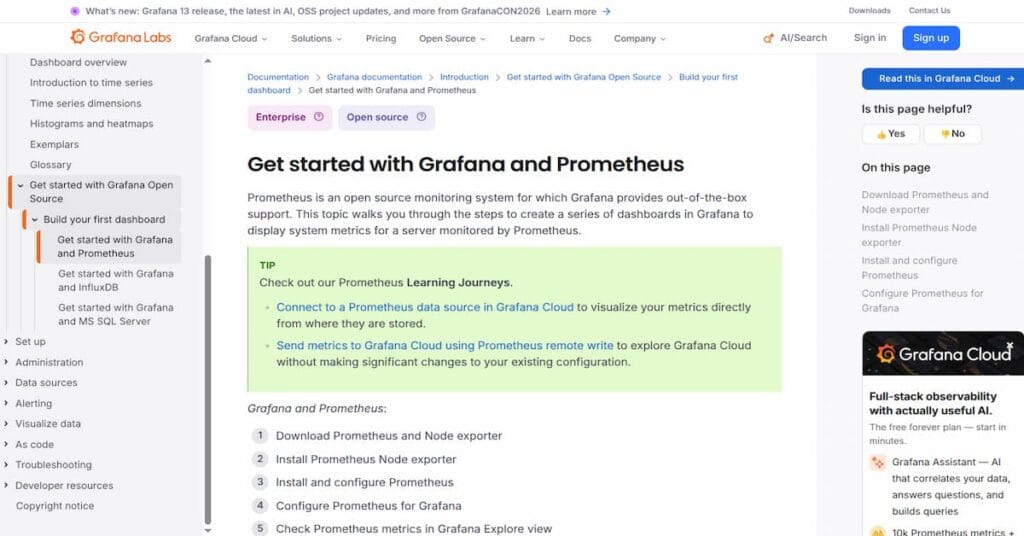
Grafana and Prometheus form the most widely deployed open-source monitoring stack for Kubernetes. Prometheus scrapes metrics from AKS nodes, pods, and services. Grafana visualizes those metrics in customizable dashboards. Both tools are free, self-hosted, and vendor-neutral.
Key Features:
- PromQL queries for high-cardinality filtering by pod label, namespace, or annotation
- Pre-built AKS dashboards from the Grafana community
- Alertmanager for Kubernetes-aware alerting rules
- Seamless integration with kube-state-metrics for cluster-level signals
- Full control over data retention and storage
Pricing:
Prometheus and Grafana are free and open source. Grafana Cloud pricing starts at $0 for the free tier and scales with usage for managed Prometheus, Loki, and Tempo. Self-hosting costs depend on infrastructure. A 50-node AKS cluster running Prometheus and Grafana on Azure VMs costs approximately $200/month in compute and storage.
This estimate models infrastructure costs only. Managed Grafana Cloud pricing varies based on active series and log volume.
Pros:
- Zero vendor lock-in; both tools are open source and portable
- Massive community support with thousands of pre-built dashboards
- Works natively with Kubernetes service discovery
Cons:
- High operational burden; you manage upgrades, storage, and scaling
- No distributed tracing without adding Tempo or Jaeger
- Prometheus struggles with high-cardinality metrics at scale
Best for: Teams with Kubernetes expertise who want full control and can manage Day 2 operations.
7. Elastic APM
Elastic APM is part of the Elastic Stack (ELK). It collects metrics, logs, and traces from AKS clusters and stores them in Elasticsearch. Teams already using Elasticsearch for log aggregation can add APM and Kubernetes monitoring without introducing a new platform.
Key Features:
- Kubernetes metrics collected via Metricbeat
- Distributed tracing with automatic service maps
- Log aggregation from all pods via Filebeat
- Kibana dashboards for visualizing AKS cluster health
- Full-text search across all telemetry types
Pricing:
Elastic APM is free and open source. Elastic Cloud pricing starts at $99/month for the Standard tier. Self-hosting costs depend on infrastructure. A 50-node AKS cluster running Elastic Stack on Azure costs approximately $300/month in compute and storage.
This estimate models self-hosted infrastructure costs. Elastic Cloud pricing varies based on ingestion volume and retention.
Pros:
- Unified storage for logs, metrics, and traces
- Powerful full-text search with Elasticsearch
- Free for self-hosted deployments
Cons:
- Elasticsearch is resource-heavy and requires tuning at scale
- Steep learning curve for teams unfamiliar with ELK
- Distributed tracing is less mature than purpose-built APM tools
Best for: Teams already running Elasticsearch who want to consolidate Kubernetes monitoring into their existing stack.
8. Splunk
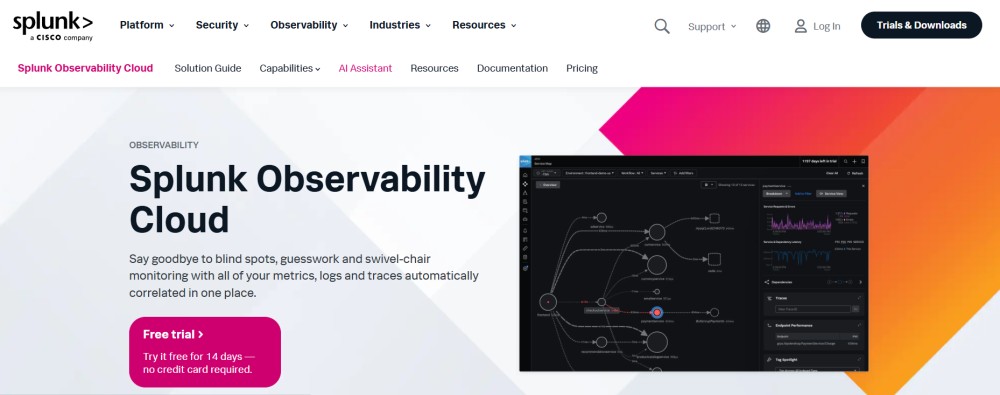
Splunk is an enterprise platform for log analytics, SIEM, and infrastructure monitoring. Its Infrastructure Monitoring product tracks AKS clusters, nodes, pods, and services with real-time dashboards and alerting. Splunk is typically chosen by large organizations with security and compliance requirements.
Key Features:
- AKS cluster monitoring with node, pod, and container-level metrics
- Log aggregation from all Kubernetes workloads
- Integration with Splunk SIEM for security event correlation
- Distributed tracing via OpenTelemetry
- Custom dashboards and alerting rules
Pricing:
Splunk charges per host for Infrastructure Monitoring. Pricing starts at $15/host/month. A 50-node AKS cluster costs $750/month for infrastructure monitoring alone. Logs, APM, and SIEM are priced separately.
Pricing is based on publicly available information as of April 2026. Enterprise discounts and bundled contracts are not reflected here.
Pros:
- Strong security and compliance features
- Deep log search and correlation capabilities
- Enterprise-grade support and SLAs
Cons:
- High cost for infrastructure monitoring and logs
- Requires Splunk expertise to configure effectively
- Primarily log-focused; APM and tracing are add-ons
Best for: Large enterprises with security-first requirements and existing Splunk deployments.
9. SigNoz
SigNoz is an open-source observability platform built natively on OpenTelemetry. It monitors AKS clusters with metrics, logs, and traces in one interface. SigNoz is designed as a self-hosted alternative to commercial APM tools with no vendor lock-in.
Key Features:
- Native OpenTelemetry support for metrics, logs, and traces
- Kubernetes-specific dashboards showing pod, node, and cluster health
- Distributed tracing with service dependency maps
- ClickHouse backend for fast query performance
- Self-hosted or managed cloud deployment
Pricing:
SigNoz is free and open source. SigNoz Cloud pricing starts at $0.30/GB for ingestion. Self-hosting costs depend on infrastructure. A 50-node AKS cluster ingesting 30 GB/month costs $9/month on SigNoz Cloud or approximately $150/month for self-hosted infrastructure.
This estimate models SigNoz Cloud pricing. Self-hosted costs vary based on ClickHouse cluster size and retention.
Pros:
- OpenTelemetry-native with no proprietary agents
- Self-hosted option for full data control
- Active open source community
Cons:
- Smaller feature set compared to enterprise tools
- Requires managing ClickHouse backend for self-hosted deployments
- Limited integrations compared to Datadog or Dynatrace
Best for: OpenTelemetry-first teams who want open source monitoring with managed cloud as an option.
10. AppDynamics
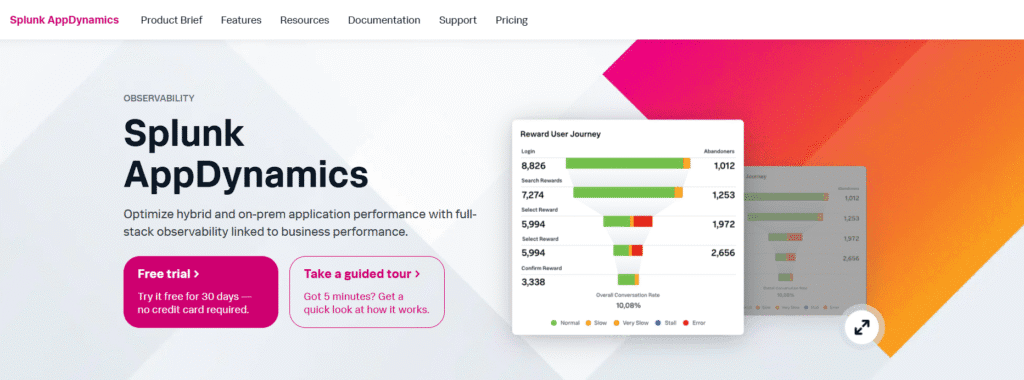
AppDynamics is a Cisco-owned APM platform focused on business transaction monitoring. It tracks AKS infrastructure and correlates Kubernetes health with application-level business metrics. AppDynamics is typically chosen by large enterprises with complex application portfolios.
Key Features:
- Kubernetes monitoring with node, pod, and container visibility
- Business transaction tracking linked to Kubernetes pods
- Automatic baseline detection for performance anomalies
- Integration with Cisco networking and security tools
- Real user monitoring correlated with backend Kubernetes health
Pricing:
AppDynamics charges per vCPU core. Pricing is not publicly available; contact sales for quotes. Industry estimates suggest $50–$100/vCPU/month for full-stack monitoring.
Pricing based on industry estimates. Verify current rates with AppDynamics directly.
Pros:
- Strong business transaction focus
- Deep integration with Cisco ecosystem
- Enterprise-grade support
Cons:
- Opaque pricing with no public rate card
- Cisco-heavy architecture may not fit non-Cisco shops
- High cost for smaller teams
Best for: Large Cisco-dependent enterprises that need business-focused APM.
How to Choose the Right AKS Monitoring Tool
Choosing the right tool depends on five factors: cost model, deployment preference, existing stack, Kubernetes signal depth, and team size.
1. Cost Model
AKS monitoring tools use four pricing models:
- Per-host: Datadog, Dynatrace, Splunk; costs scale with cluster size
- Per-GB ingestion: Azure Monitor, New Relic, CubeAPM; costs scale with telemetry volume
- Open source + infrastructure: Prometheus, Grafana, Elastic, SigNoz; free software, you pay for hosting
- Enterprise quote: AppDynamics; pricing negotiated case by case
For auto-scaling AKS clusters, per-host pricing can triple costs during traffic spikes. Per-GB ingestion pricing is more predictable but requires controlling log verbosity.
2. Deployment Model
SaaS-only tools (Datadog, New Relic, Dynatrace) are fast to deploy but send telemetry outside your Azure subscription. Self-hosted tools (CubeAPM, Prometheus, Grafana, SigNoz) keep data inside your VPC but require managing infrastructure.
If you have data residency requirements or want to avoid egress costs, self-hosted is the only option. If you want zero operational burden, SaaS is the better fit.
3. Kubernetes Signal Depth
Not all tools track the same Kubernetes signals. Azure Monitor gives control plane logs but no distributed tracing. Datadog and Dynatrace track everything but charge for every layer. Open source tools require assembling the stack yourself.
Check what each tool surfaces by default:
- Control plane logs (API server, scheduler, controller manager)
- Node conditions (NotReady, MemoryPressure, DiskPressure)
- Pod-level metrics (CPU, memory, restarts, OOMKills)
- HPA scaling events and reasons
- Kubernetes events linked to metric spikes
If a tool does not surface these by default, you will need custom configuration or additional agents.
4. Existing Stack
If you already use Elasticsearch, adding Elastic APM is simpler than switching to Datadog. If you use Prometheus for metrics, Grafana is the natural choice for visualization. If you use Azure Monitor for Azure resources, Container Insights fits without adding a new platform.
Migration cost and learning curve matter. Pick a tool that integrates with what you already run.
5. Team Size and Budget
Small teams with limited budget benefit from open source tools or low-cost SaaS (SigNoz, CubeAPM). Large enterprises with budget for premium tooling and AI-driven features benefit from Datadog or Dynatrace. Mid-size teams often choose hybrid models like Grafana Cloud or New Relic to balance cost and features.
Frequently Asked Questions
What is the best free AKS monitoring tool?
Prometheus and Grafana are the most widely used free tools for AKS monitoring. Both are open source and provide full Kubernetes metrics coverage. Azure Monitor Container Insights offers a 5 GB free tier but charges beyond that.
Can Azure Monitor replace third-party AKS monitoring tools?
Azure Monitor Container Insights tracks AKS infrastructure health and logs but does not provide distributed tracing or application-level APM. Teams that need full-stack observability typically combine Azure Monitor with tools like Datadog, New Relic, or CubeAPM.
How much does Datadog cost for a 50-node AKS cluster?
A 50-node AKS cluster with Infrastructure Monitoring and APM costs approximately $2,300/month on Datadog before logs, synthetics, or user seats. Costs scale linearly as clusters grow.
What is the cheapest AKS monitoring tool?
CubeAPM at $0.20/GB ingestion offers the lowest total cost for teams that can self-host. Open source tools like Prometheus and Grafana are free but require infrastructure costs. Azure Monitor Container Insights is cheapest for small clusters under 5 GB/month.
Does CubeAPM integrate with Azure Monitor?
CubeAPM ingests metrics and logs from AKS clusters via OpenTelemetry or Prometheus. It does not replace Azure Monitor for control plane logs but provides full-stack observability for application and infrastructure layers.
What metrics should I monitor in AKS?
Essential AKS metrics include node CPU and memory utilization, pod restart counts, OOMKill events, HPA scaling activity, persistent volume usage, and control plane API latency. Application-level metrics like request latency and error rates should be monitored alongside Kubernetes infrastructure.
Can I use Prometheus for AKS monitoring without Grafana?
Prometheus collects and stores metrics but has no built-in visualization layer. Most teams use Grafana to visualize Prometheus data. Alternatives include Azure Managed Grafana or commercial platforms that ingest Prometheus metrics like Datadog or New Relic.
Disclaimer: The information in this article reflects the latest details available at the time of publication and may change as technologies and products evolve. Features, pricing, and plan limits can change over time. Always verify the latest information directly with the vendor before making purchasing or deployment decisions.