










Azure Machine Learning (Azure ML) runs training jobs across distributed compute and deploys models to managed endpoints serving real-time inference requests. Without proper monitoring, a failed training run can burn through GPU hours before anyone notices, or a deployed model can serve degraded predictions for hours while latency metrics climb silently. According to the 2024 CNCF AI Survey, 68% of organizations cite monitoring and observability as their top operational challenge when running ML workloads in production.
This guide covers how Azure ML monitoring works across training jobs, model endpoints, and infrastructure, what metrics and logs to track, how cost compounds with scale, and which observability platforms handle Azure ML telemetry without requiring a second mortgage.
What Is Azure Machine Learning Monitoring?
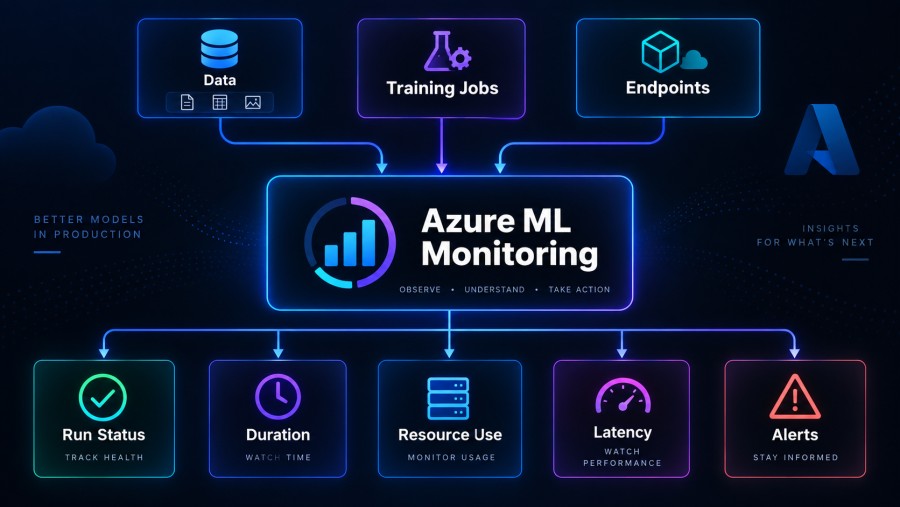
Azure Machine Learning monitoring refers to the practice of tracking performance, resource usage, and operational health across training jobs, deployed models, and the Azure ML infrastructure itself. This includes metrics like GPU utilization during training, endpoint latency during inference, dataset drift, model accuracy degradation, and infrastructure events like pod restarts or cluster autoscaling.
Azure ML generates telemetry across three distinct layers: the training layer (jobs, experiments, compute clusters), the deployment layer (managed endpoints, real-time and batch inference), and the platform layer (workspace activity, quotas, API calls). Each layer produces its own metrics, logs, and events, and without a unified view, teams end up switching between Azure Monitor, Application Insights, and the Azure ML Studio UI to piece together what happened during an incident.
The core challenge is that Azure ML monitoring is not a single toggle you enable. It requires configuring diagnostics settings for the workspace, attaching Application Insights to endpoints, enabling logging on training jobs, and deciding which metrics to export where. Many teams discover this after their first production incident when they realize critical signals were never being captured.
How Azure Machine Learning Monitoring Works
Azure ML monitoring operates through a combination of native Azure services and ML-specific instrumentation. Training jobs emit metrics to Azure Monitor, endpoints route telemetry to Application Insights, and workspace-level logs flow through Azure Diagnostic Settings. Understanding how these layers connect is essential to building a complete monitoring strategy.
Training Job Monitoring
Training jobs in Azure ML run on managed compute clusters or serverless compute. Each job generates metrics covering resource utilization (CPU, GPU, memory), framework-specific signals (loss, accuracy, epoch duration), and infrastructure events (node failures, job cancellations, quota errors).
Azure ML Studio provides a jobs list view where you can filter by experiment, status, and compute target. You can view real-time metrics during training, compare runs side by side, and export logs for debugging. But the Studio UI is not an alerting system. If a training job fails at 3 AM because the compute cluster hit quota limits, no one gets paged unless you configure Azure Monitor alerts separately.
For teams running large-scale hyperparameter sweeps or distributed training across dozens of nodes, tracking job-level metrics becomes critical. A single misconfigured learning rate can waste thousands of dollars in GPU hours. Monitoring training jobs means setting up alerts on job failure, GPU saturation, and training duration outliers so you catch inefficiencies before they compound.
Endpoint Monitoring with Application Insights
When you deploy a model to a managed online endpoint in Azure ML, the endpoint automatically routes telemetry to Application Insights if you enable it during deployment. This captures HTTP request metrics (latency, status codes, throughput), dependency calls (if your model calls external APIs or databases), and custom logging from your scoring script.
Application Insights provides request-level tracing, which means you can see exactly how long each inference request took, which part of your scoring script was slow, and whether any exceptions were raised. But it also means you pay for Application Insights ingestion, which scales with request volume. A high-traffic model endpoint serving 10,000 requests per minute can generate gigabytes of telemetry daily.
The default Application Insights configuration captures everything, which leads to two problems: cost and noise. Most teams eventually tune sampling rates or implement custom logging to reduce ingestion volume, but this decision comes after the first bill shock, not before.
Infrastructure and Workspace Monitoring
Azure ML workspaces generate platform-level logs covering workspace activity (who ran which job, when), quota usage, API calls, and authentication events. These logs flow through Azure Diagnostic Settings and can be routed to Log Analytics, Event Hubs, or a storage account.
For regulated industries or teams with audit requirements, workspace logs are mandatory. They provide the paper trail showing who deployed which model to which endpoint at what time. But parsing these logs requires Kusto Query Language (KQL) and a working understanding of Azure Monitor Logs, which is not a trivial learning curve.
Infrastructure monitoring platforms unify metrics, logs, and traces across training, endpoints, and platform layers, giving teams a single pane of glass instead of three separate Azure services.
What to Monitor in Azure Machine Learning
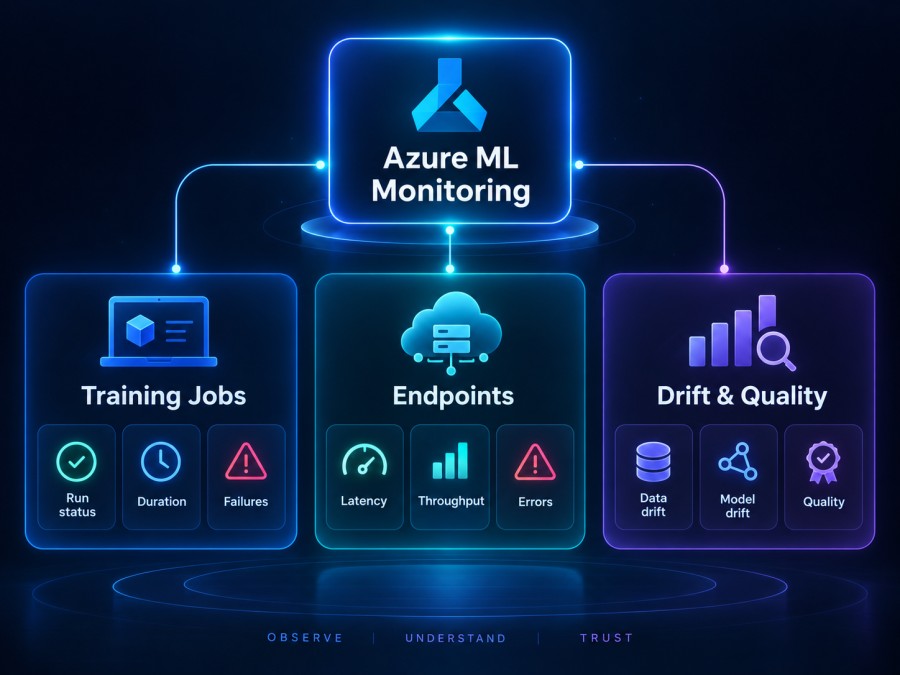
Azure ML monitoring divides into three categories: training observability, deployment observability, and platform health. Each requires different metrics, different alert thresholds, and different response playbooks.
Training Job Metrics
Training jobs produce metrics at the job level, node level, and framework level. Job-level metrics include start time, end time, duration, and final status (completed, failed, canceled). Node-level metrics cover CPU, GPU, memory, disk I/O, and network throughput across the compute cluster. Framework-level metrics depend on your ML library but typically include loss, accuracy, learning rate, and epoch duration.
For distributed training across multiple nodes, you also need to track communication overhead, data loading bottlenecks, and GPU synchronization delays. A training job that spends 60% of its time waiting for data to load from blob storage is burning GPU hours on idle compute.
Key training metrics to monitor:
- GPU utilization percentage per node
- Training job duration compared to historical baseline
- Job failure rate by compute target
- Data loading time as percentage of epoch duration
- Memory usage and OOM (out of memory) events
- Distributed training synchronization lag
A production ML platform running hundreds of training jobs daily should alert on job failure rate anomalies, GPU idle time above 20%, and training duration outliers beyond two standard deviations from the mean.
Endpoint Performance Metrics
Deployed model endpoints generate metrics covering request latency, throughput, error rate, and resource consumption. Real-time endpoints must respond within strict latency SLAs, typically under 100ms for many applications. Batch endpoints prioritize throughput over latency and measure completion time for large inference jobs.
Endpoint latency breaks into three components: model loading time (cold start penalty if the endpoint scales from zero), inference time (actual model computation), and serialization overhead (converting input/output to JSON or other formats). Most latency issues trace back to one of these three.
Key endpoint metrics to monitor:
- P50, P95, P99 request latency (not just average)
- Requests per second and throughput ceiling
- HTTP 4xx and 5xx error rates
- Cold start frequency and duration
- Model memory footprint and container restarts
- Autoscaling lag during traffic spikes
For high-traffic endpoints, teams often implement synthetic monitoring to continuously probe endpoint health from multiple regions, catching availability issues before real users hit them.
Model Drift and Data Quality
Model drift refers to the degradation of model accuracy over time as the input data distribution shifts away from the training data. Azure ML supports model monitoring through data drift detection and model performance tracking, but these features require manual configuration and baseline dataset setup.
Data drift monitoring compares incoming inference data against a reference dataset (typically the training data) and alerts when statistical properties diverge beyond a threshold. This catches scenarios where a fraud detection model trained on 2024 transaction patterns starts receiving 2026 data with entirely different feature distributions.
Model performance monitoring tracks prediction accuracy, precision, recall, or custom business metrics by comparing model outputs against ground truth labels. This only works if you have a feedback loop providing labeled data post-inference, which many production systems lack.
Without drift monitoring, a model can quietly degrade from 92% accuracy to 78% over six months while still serving predictions with no alerts. Teams often discover this during quarterly model audits, not through real-time monitoring.
Azure ML Monitoring Costs and Pricing Model
Azure ML monitoring costs come from multiple Azure services: Azure Monitor metrics ingestion, Log Analytics data retention, Application Insights telemetry, and storage accounts for exported logs. Understanding how these costs compound is essential before enabling verbose logging on high-traffic endpoints.
Azure Monitor and Application Insights Pricing
Azure Monitor charges for metrics ingestion and log ingestion separately. Metrics cost $0.10 per million API calls for custom metrics beyond the free tier. Log Analytics ingestion starts at $3.50 per GB for the first 5 GB per day, with tiered pricing beyond that. Application Insights ingestion costs $2.88 per GB beyond the first 5 GB per month.
For an Azure ML workspace running 50 training jobs daily and 10 production endpoints each serving 5,000 requests per minute, telemetry volume can exceed 100 GB monthly. At $2.88 per GB for Application Insights, that is $288 per month just for endpoint telemetry, before adding training job logs or workspace diagnostics.
Retention adds another layer. Log Analytics default retention is 31 days at no extra cost, but extending to 90 days costs $0.12 per GB per month, and long-term retention beyond two years costs $0.05 per GB per month. A team ingesting 100 GB monthly with 90-day retention pays an additional $12 per month just to keep the data searchable.
Data Transfer and Egress Costs
Azure Monitor and Application Insights data lives in Azure’s cloud. Exporting that data to a third-party SaaS observability tool or even to another Azure region incurs egress charges. Azure egress pricing starts at $0.087 per GB for the first 10 TB per month.
For teams using external APM platforms like Datadog or New Relic, every GB of logs and traces forwarded from Azure Monitor to the SaaS platform costs $0.087 in egress alone, on top of the SaaS platform’s ingestion fees. A 50 TB monthly telemetry stream costs over $4,000 in Azure egress before the SaaS bill even starts.
This is why many teams building ML platforms on Azure choose self-hosted observability tools that run inside their Azure subscription, eliminating egress entirely. CubeAPM runs inside your Azure VPC, captures telemetry from training jobs and endpoints via OpenTelemetry, and stores data in your own blob storage with zero egress cost at $0.2 per GB all-in pricing.
Hidden Costs: Verbose Logging and Default Sampling
Azure ML’s default Application Insights configuration samples 100% of requests, which is useful during initial debugging but financially painful at scale. A model endpoint serving 10,000 requests per minute generates 14.4 million requests daily. At 1 KB average telemetry per request, that is 14 GB per day or 420 GB per month, costing $1,210 per month in Application Insights ingestion alone for a single endpoint.
Most teams eventually configure adaptive sampling to reduce ingestion volume, but this creates a new problem: critical error traces get sampled out. A rare but high-impact failure affecting 0.1% of requests may never appear in your traces if sampling drops below that threshold.
The alternative is structured logging with deliberate cardinality control, capturing only the signals that matter for debugging and alerting, not every HTTP header and response body.
Observability Platforms for Azure ML Monitoring
Azure ML monitoring can be handled entirely within Azure’s native tooling (Azure Monitor, Application Insights, Log Analytics), but many teams adopt third-party observability platforms for better trace correlation, faster query performance, or unified visibility across multi-cloud environments.
Native Azure Monitoring Stack
The native Azure stack consists of Azure Monitor for metrics, Log Analytics for logs, and Application Insights for distributed tracing. This stack integrates tightly with Azure ML and requires no additional agents or exporters. Training job metrics automatically flow to Azure Monitor, endpoint telemetry routes to Application Insights, and workspace logs export via Diagnostic Settings.
The native stack works well for teams fully committed to Azure with no multi-cloud requirements. But it has limitations. Query performance in Log Analytics degrades as data volume grows, especially for high-cardinality queries across millions of training jobs or endpoints. The KQL query language has a steep learning curve compared to SQL-like interfaces. And correlating a model latency spike with an underlying infrastructure issue requires stitching together data from three separate tools.
SaaS Observability Platforms
SaaS platforms like Datadog, New Relic, and Dynatrace offer pre-built integrations with Azure ML, unified dashboards, and automated anomaly detection. These tools ingest telemetry from Azure Monitor and Application Insights via API integration or the OpenTelemetry Collector.
The advantage is a polished UI, faster time to value, and support for multi-cloud or hybrid environments. The disadvantage is cost. Datadog charges $31 per host per month for infrastructure monitoring plus $0.10 per GB for logs beyond the free tier. A 100-node Azure ML compute cluster costs $3,100 per month just for host monitoring before adding any training job or endpoint telemetry.
Egress costs compound the problem. Sending 50 TB monthly from Azure Monitor to Datadog costs $4,350 in Azure egress charges, plus Datadog’s ingestion fees on top.
Self-Hosted and Hybrid Platforms
Self-hosted platforms like Grafana, Prometheus, and CubeAPM run inside your Azure subscription, eliminating egress costs and giving you full control over data retention and compliance.
CubeAPM deploys as a managed service inside your Azure VPC, captures telemetry from Azure ML training jobs and endpoints via OpenTelemetry, and provides distributed tracing, log correlation, and infrastructure metrics in a single platform. Pricing is $0.20 per GB ingested with unlimited retention, no per-host fees, and no egress charges because data never leaves your environment.
For teams with data residency requirements or cost sensitivity, self-hosted observability removes the SaaS tax and egress overhead. For teams that want SaaS convenience without the egress penalty, CubeAPM’s vendor-managed deployment inside your Azure subscription splits the difference.
Best Practices for Azure ML Monitoring
Building a production-grade monitoring strategy for Azure ML requires deliberate choices about what to measure, where to store it, and how to alert on it. These best practices distill lessons from teams running ML platforms at scale.
Enable Diagnostic Settings at the Workspace Level
Azure ML workspaces do not enable diagnostic logging by default. You must explicitly configure Diagnostic Settings to route workspace activity logs, job execution logs, and API audit logs to Log Analytics or a storage account. This takes under five minutes to configure but is skipped by most teams during initial setup.
Without workspace logs, you have no audit trail showing who deployed which model, no record of quota limit errors, and no visibility into workspace API throttling. Enable diagnostics on day one, not after your first compliance audit.
Instrument Training Jobs with Custom Metrics
Azure ML captures basic job metrics automatically (start time, duration, status), but framework-specific metrics like training loss, validation accuracy, and learning rate require explicit logging from your training script. Use MLflow or Azure ML’s native logging APIs to emit custom metrics during training.
Log metrics at the end of each epoch, not every batch, to avoid overwhelming Azure Monitor with millions of data points. A training job with 1,000 batches per epoch logging loss every batch generates 1,000x more metrics than necessary.
Configure Application Insights Sampling for Endpoints
Application Insights default sampling captures 100% of requests, which is unsustainable at scale. Configure adaptive sampling to reduce ingestion volume while preserving traces for errors and outliers. Adaptive sampling intelligently retains traces with long latency or failed status codes while sampling common success cases.
For high-traffic endpoints, aim for 1-5% sampling during steady state and 100% sampling for error conditions. This keeps ingestion costs manageable while ensuring you never lose a critical error trace.
Set Up Alerts for Job Failures and Endpoint Latency
Monitoring is useless without alerts. Configure Azure Monitor alerts for training job failure rate, endpoint P95 latency exceeding SLA thresholds, and model endpoint 5xx error rate above baseline. Route alerts to Slack, PagerDuty, or Microsoft Teams depending on your incident response workflow.
Avoid alert fatigue by setting thresholds based on historical baselines, not arbitrary numbers. If your endpoint P95 latency historically sits at 80ms, alert at 120ms, not 200ms.
Correlate Metrics, Logs, and Traces
The most effective debugging workflows correlate metrics (latency spike), logs (error messages), and traces (request path) in a single view. If your observability stack forces you to switch between three tools to correlate these signals, you lose minutes during every incident.
Real user monitoring platforms that unify metrics, logs, and traces reduce mean time to resolution by eliminating context switching and manual correlation.
Migrating from Native Azure Monitoring to a Unified Platform
Many teams start with Azure Monitor and Application Insights because they are included with Azure ML, then migrate to a unified observability platform when query performance degrades or costs spiral. The migration path depends on whether you choose a SaaS platform or a self-hosted solution.
Step 1: Audit Current Telemetry Volume and Costs
Before migrating, understand how much telemetry you are generating and what it costs. Export billing reports from Azure Monitor and Application Insights covering the past 90 days. Break down costs by telemetry type (metrics, logs, traces), retention tier, and egress charges.
This audit reveals where costs concentrate. If 80% of your Application Insights bill comes from a single high-traffic endpoint, you know where to apply sampling first.
Step 2: Choose a Migration Strategy
You have two options: big-bang cutover or incremental migration. Big-bang means switching all telemetry to the new platform in a single deployment, which is risky but fast. Incremental migration means running dual-write temporarily, sending telemetry to both Azure Monitor and the new platform until you validate the new setup.
Incremental migration is safer for production environments but doubles telemetry egress during the transition period. Budget for 30-60 days of dual-write costs.
Step 3: Deploy OpenTelemetry Collectors
Most modern observability platforms ingest telemetry via OpenTelemetry. Deploy the OpenTelemetry Collector inside your Azure ML workspace to capture metrics, logs, and traces from training jobs and endpoints. Configure the collector to export to your chosen backend.
For self-hosted platforms like CubeAPM, the collector routes telemetry to the CubeAPM instance running in your Azure VPC, eliminating egress costs. For SaaS platforms, the collector forwards telemetry over the public internet, incurring Azure egress charges.
Step 4: Migrate Dashboards and Alerts
Once telemetry flows to the new platform, recreate your critical dashboards and alerts. Do not try to replicate every Azure Monitor dashboard. Start with the top 10 dashboards your team actually uses during incidents.
Alerts require careful translation. Azure Monitor alert thresholds and query logic may not map directly to the new platform’s alerting DSL. Test each alert against historical data to validate it fires correctly.
Step 5: Decommission Azure Monitor
After running in parallel for 30-60 days with no incidents, disable Azure Monitor and Application Insights ingestion to stop accruing costs. Retain historical data in Log Analytics for compliance or audit purposes, but stop sending new telemetry.
For teams with strict data retention policies, export historical logs to cold storage (Azure Blob Storage) before decommissioning Log Analytics.
Disclaimer: The information in this article reflects the latest details available at the time of publication and may change as technologies and products evolve. Features, pricing, and plan limits can change over time. Always verify the latest information directly with the vendor before making purchasing or deployment decisions.
Frequently Asked Questions
What is the difference between monitoring training jobs and monitoring endpoints in Azure ML?
Training job monitoring tracks resource utilization, job duration, and framework metrics during model training. Endpoint monitoring tracks request latency, throughput, and error rates for deployed models serving real-time inference requests.
Does Azure Machine Learning include monitoring by default?
Azure ML captures basic job metrics automatically, but detailed monitoring requires enabling Application Insights for endpoints and configuring Diagnostic Settings for workspace logs. Many signals are not collected by default.
How much does Azure ML monitoring cost?
Azure Monitor and Application Insights charge per GB ingested. A workspace with 50 training jobs daily and 10 production endpoints can generate over 100 GB monthly, costing $300+ per month before retention or egress fees.
Can I use OpenTelemetry with Azure ML?
Yes, Azure ML supports OpenTelemetry via the OpenTelemetry Collector. You can capture telemetry from training jobs and endpoints and route it to any OpenTelemetry-compatible backend.
What is model drift monitoring in Azure ML?
Model drift monitoring detects when incoming inference data diverges from the training data distribution, which can degrade model accuracy over time. Azure ML supports drift detection but requires manual baseline configuration.
How do I reduce Application Insights costs for Azure ML endpoints?
Configure adaptive sampling to reduce telemetry volume, log only essential signals, and avoid verbose logging in production. Sampling rates between 1-5% are common for high-traffic endpoints.
What observability platforms integrate with Azure ML?
Azure ML integrates with native Azure tools (Azure Monitor, Application Insights), SaaS platforms (Datadog, New Relic, Dynatrace), and self-hosted platforms (Grafana, CubeAPM) via OpenTelemetry or Azure integrations.