










Azure Kubernetes Service monitoring is not optional. An AKS cluster that auto-scales from 20 to 80 nodes during a traffic spike can triple your monitoring bill in hours if you are on per-host pricing before the extra nodes complete their first job. Beyond cost, most generic monitoring tools miss Kubernetes-specific signals: HPA scaling events, OOMKill reasons, pod eviction causes, and control plane health.
According to the CNCF Annual Survey 2023, Kubernetes adoption continues to grow, with 96% of organizations either using or evaluating Kubernetes. This makes proper AKS monitoring essential as clusters become more complex. This guide covers what AKS monitoring is, how it works, what metrics and signals matter, and which tools deliver the visibility you need without the operational overhead or cost surprises.
What Is AKS Monitoring?
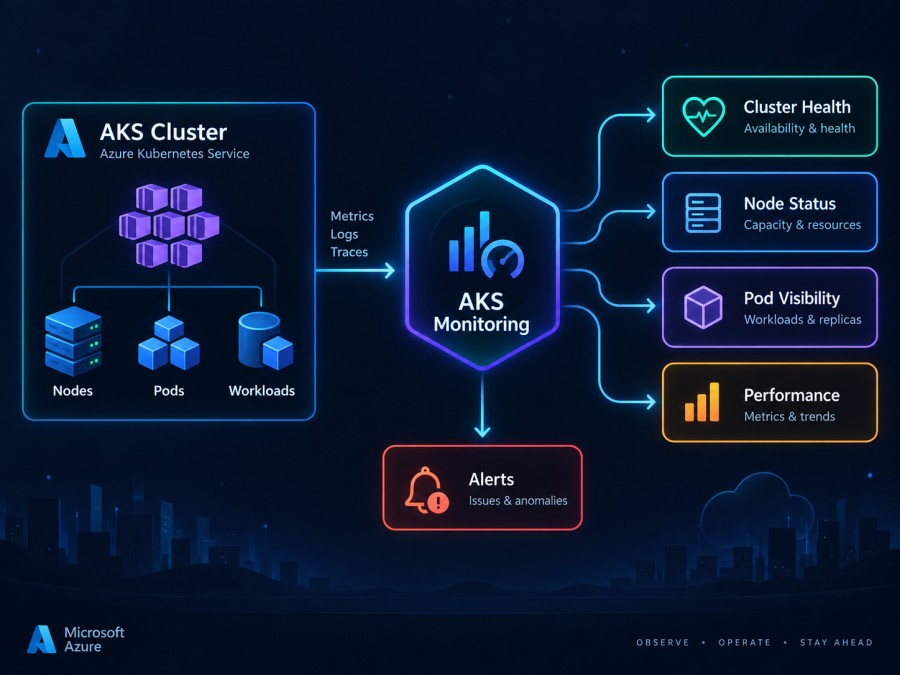
AKS monitoring is the practice of collecting, analyzing, and acting on telemetry data from Azure Kubernetes Service clusters to ensure application availability, performance, and resource efficiency. Unlike traditional VM monitoring, AKS introduces ephemeral pods, dynamic scheduling, multiple abstraction layers, and distributed service communication. This means you must monitor at the cluster level, node level, pod level, container level, and application level simultaneously to understand system behavior.
Azure Kubernetes Service abstracts the control plane. Microsoft manages the API server, scheduler, controller manager, and etcd. You do not patch those components, and you cannot SSH into control plane nodes. This shared responsibility model defines what you can observe directly. The control plane is largely opaque. You see metrics, logs, and some diagnostic signals, but you do not instrument or configure those components yourself.
The data plane is fully observable. You own the worker nodes, node pools, pod lifecycle, networking configuration, and workload telemetry. Effective AKS monitoring focuses primarily on the data plane, while using available control plane signals to infer health and detect platform-level issues.
How AKS Monitoring Works
AKS monitoring operates through multiple telemetry layers that work together to give you visibility from infrastructure up through application transactions. Each layer captures different signals, and proper monitoring requires integrating all of them into a coherent observability pipeline.
Platform Metrics via Azure Monitor
Azure Monitor provides baseline platform metrics for every AKS cluster automatically at no additional cost. These metrics surface through the Azure portal and include CPU utilization, memory working set, network bytes in/out, and disk usage aggregated at cluster and node pool levels. The metrics server deployed in the kube-system namespace scrapes kubelet metrics from each node and exposes them through the Kubernetes Metrics API.
Platform metrics give you a starting view of resource consumption and capacity, but they lack the granularity needed to diagnose pod-level issues, identify which workload is causing CPU throttling, or trace slow database queries. They are useful for capacity planning and high-level alerting, but insufficient for root cause analysis.
Container Insights for Logs and Pod Telemetry
Container Insights is Azure’s managed monitoring solution built on Azure Monitor. Enabling Container Insights deploys the Azure Monitor Agent as a DaemonSet in your cluster. This agent collects stdout and stderr logs from containers, Kubernetes events, performance metrics at pod and container granularity, and inventory data for nodes, pods, and controllers.
Container Insights stores all collected data in a Log Analytics workspace, where you can query it using Kusto Query Language. It provides pre-built workbooks that visualize cluster health, node and pod performance, and container logs in a unified interface. This eliminates the need to manually configure log collection from each container or build custom dashboards from scratch.
The agent overhead is low but measurable. On a typical node, the Azure Monitor Agent consumes 50 to 150 MB of memory and a few millicores of CPU. For teams running hundreds or thousands of pods, this adds up. The real cost is data ingestion. Log Analytics charges per GB ingested, and verbose application logs can generate significant volume. A single chatty microservice logging at debug level can produce gigabytes of logs daily.
Managed Prometheus for Metrics Collection
Azure Monitor managed service for Prometheus provides a fully managed Prometheus-compatible metrics backend. After enabling it, Azure deploys a Prometheus collector as a DaemonSet that scrapes metrics from Kubernetes components, node exporters, and your application’s Prometheus endpoints. Metrics are stored in an Azure Monitor workspace, and you query them using PromQL in Azure Managed Grafana.
Managed Prometheus removes the operational burden of running a self-hosted Prometheus server, managing storage, handling high availability, and tuning retention policies. It integrates natively with Azure Managed Grafana, giving you pre-built dashboards for Kubernetes cluster monitoring without manual setup. However, it introduces dependency on Azure’s managed services, and exporting metrics to a non-Azure system requires additional configuration.
Resource Logs via Diagnostic Settings
AKS control plane logs are available as resource logs through Azure Monitor. These logs include kube-apiserver, kube-controller-manager, kube-scheduler, kube-audit, and cluster autoscaler logs. They are not enabled by default. You must create a diagnostic setting to route these logs to a Log Analytics workspace, storage account, or Event Hub.
Control plane logs are essential for diagnosing cluster-level failures like API server throttling, authentication errors, admission webhook failures, or scheduling bottlenecks. Without them, you have no visibility into why a pod is stuck in Pending state due to resource constraints or why an HPA failed to scale a deployment.
The challenge with control plane logs is volume. The kube audit log, in particular, can generate massive amounts of data. A moderately busy cluster might produce hundreds of gigabytes of audit logs monthly. Azure provides two audit log streams: kube audit logs full and kube audit admin logs. The admin stream filters out read operations and other low-signal events, reducing volume by 90% or more while retaining the signals most teams need for troubleshooting.
Application-Level Monitoring with APM
Platform metrics, logs, and Kubernetes events tell you what is happening at the infrastructure layer. They show CPU spikes, pod restarts, and scheduling failures. They do not tell you why your checkout API is slow, which database query is taking 2 seconds, or why 5% of requests are returning 500 errors. Application performance monitoring tools bridge this gap.
APM tools instrument your application code to capture distributed traces, measure transaction latencies, track error rates, and correlate application behavior with underlying infrastructure metrics. In AKS, this means tracing requests as they move across pods, services, and external dependencies like databases or third-party APIs. OpenTelemetry has become the standard instrumentation layer. It provides vendor-neutral SDKs for capturing traces, metrics, and logs from applications running in Kubernetes.
Several observability platforms support OpenTelemetry and integrate with AKS. Some run entirely in your VPC, keeping telemetry data inside your cloud environment. Others operate as SaaS platforms where telemetry is sent to the vendor’s infrastructure. The choice depends on data residency requirements, cost model preferences, and how much operational control your team wants.
What Metrics and Signals Matter in AKS
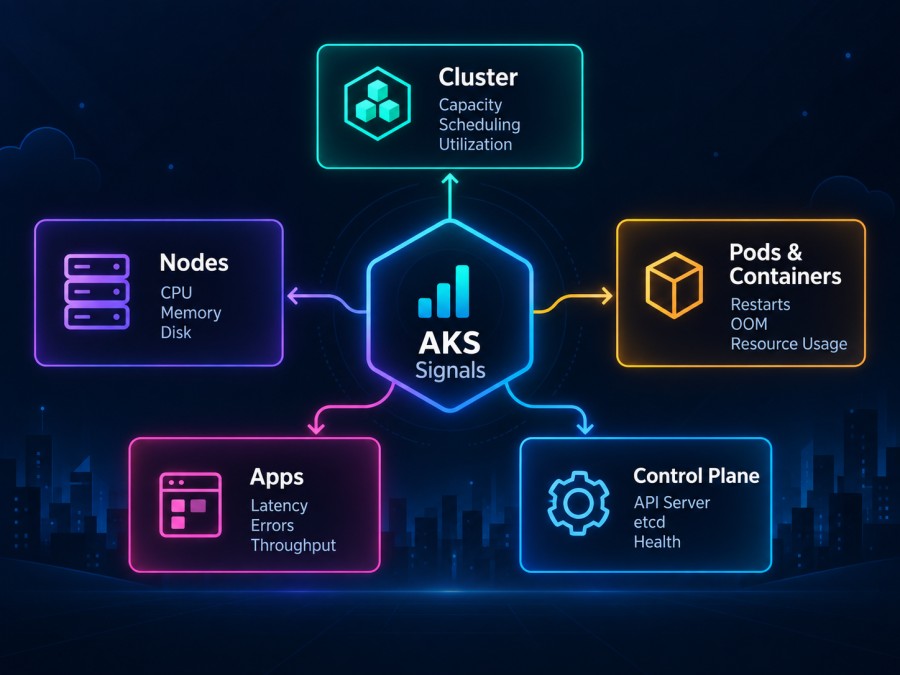
Not all metrics are equally useful. Collecting everything creates noise, drives up ingestion costs, and slows down query performance. Effective AKS monitoring focuses on signals that directly indicate problems or predict failures.
Cluster-Level Metrics
Cluster-level metrics provide the broadest view of resource availability and capacity. You should track total allocatable CPU and memory across all nodes, current resource requests and limits summed across all pods, and the percentage of cluster capacity in use. If your cluster is running at 85% CPU allocation, you are close to resource exhaustion. New pods may fail to schedule, or the cluster autoscaler may add nodes, triggering a cost spike.
The cluster autoscaler metrics reveal scaling behavior. Monitor cluster_autoscaler_nodes_count, cluster_autoscaler_unschedulable_pods_count, and cluster_autoscaler_scale_up_events_total. A rising count of unschedulable pods indicates that your cluster lacks capacity to run waiting workloads. Frequent scale-up events suggest that your node pools are undersized for the workload, or that burst traffic patterns are triggering expensive auto-scaling cycles.
Node Level Metrics
Nodes are the compute layer where pods run. Node health directly impacts pod stability. Track CPU utilization, memory utilization, disk pressure, and network throughput per node. Kubernetes uses node conditions to signal problems. A node with MemoryPressure=True is running low on memory. Pods on that node are at risk of eviction. A node with DiskPressure=True is running out of disk space, which can prevent new pods from starting or cause existing pods to crash if they cannot write logs or temporary files.
Monitor pod eviction events. When a node experiences resource pressure, kubelet evicts pods to reclaim resources. The evicted pods are rescheduled to other nodes, but if evictions happen frequently, it indicates that your nodes are undersized or that workloads lack proper resource requests and limits. You should see eviction counts per node and correlate them with node resource utilization to identify hotspots.
Pod and Container Metrics
Pods are the scheduling unit in Kubernetes, but containers inside pods consume the actual resources. Track CPU usage, memory working set, and restart count per container. A container that restarts repeatedly is crashing, often due to application errors, memory limits set too low, or failed health checks.
CPU throttling is a common but invisible problem. Kubernetes enforces CPU limits by throttling containers that exceed their quota. A container can be throttled even when node CPU utilization is low. Monitor container_cpu_cfs_throttled_seconds_total to detect throttling. High throttling means your CPU limits are too restrictive, causing artificial slowdowns. The fix is either raising the limit or optimizing the application to use less CPU.
Memory limits behave differently. If a container exceeds its memory limit, Kubernetes kills it with an OOMKill. The pod restarts, and users may experience errors or latency spikes during the restart. Monitor OOMKill events through kube state metrics using kube_pod_container_status_terminated_reason. OOMKills indicate that your memory limits are set too low or that your application has a memory leak.
Application Performance Metrics
Beyond infrastructure, you need visibility into application behavior. Track request rate, error rate, and duration for every service and endpoint. These are the RED metrics: Rate, Errors, Duration. They give you a health snapshot of each service. A sudden drop in request rate might indicate that upstream services stopped sending traffic. A spike in error rate signals a deployment issue or infrastructure failure. Increased latency means something in the request path slowed down.
Distributed tracing shows how requests flow across services. In a microservices architecture, a single user request might touch 10 services before completing. If the request is slow, tracing tells you which service introduced the delay. Without tracing, you are left guessing. Tracing requires instrumentation, either through OpenTelemetry SDKs or APM agent libraries, and it generates significant data volume. Sampling strategies reduce volume while retaining enough traces to diagnose issues.
Control Plane Health Signals
The AKS control plane is managed by Azure, but its health affects your workloads. Monitor API server request latency and error rates through Azure platform metrics. High API server latency or elevated 5xx error rates indicate that the control plane is under stress, which can delay pod scheduling, service discovery, or configuration updates.
Audit logs reveal control plane interactions. Track failed authentication attempts, unauthorized API calls, and admission webhook rejections. These logs are essential for security monitoring and compliance. A sudden increase in failed API requests from a specific service account might indicate a misconfigured workload or a compromised credential.
Best Practices for AKS Monitoring
Effective AKS monitoring requires intentional configuration choices. Default settings often collect too much data or miss critical signals. Follow these practices to build a monitoring system that delivers value without runaway costs.
Enable Diagnostic Settings with Filtered Logs
AKS does not enable control plane logs by default. Create a diagnostic setting to route logs to a Log Analytics workspace. Use the kube audit admin log stream instead of kube audit logs to reduce volume by 90%. The admin stream filters out low-signal read operations and retains the events most teams need for troubleshooting authentication failures, policy violations, and admission webhook issues.
If your compliance requirements demand full audit logs, route them to Azure Blob Storage for long term retention instead of Log Analytics. Blob Storage costs $0.015 per GB per month compared to Log Analytics ingestion at $2.99 per GB. You can query archived logs when needed, but you avoid paying ingestion and retention costs for data you rarely access.
Set Proper Resource Requests and Limits
Every container should have resource requests and limits defined. Requests guarantee a minimum amount of CPU and memory. Limits cap maximum usage. Without requests, Kubernetes cannot make informed scheduling decisions, leading to pods landing on overloaded nodes. Without limits, a single runaway container can starve other workloads on the same node.
Monitor the ratio of resource usage to requests. If a container consistently uses 80% or more of its CPU request, it is under-provisioned. If it uses 20% or less, it is overprovisioned, wasting cluster capacity. Use Vertical Pod Autoscaler to recommend right-sized requests based on observed usage, or analyze metrics over time to tune manually.
Use HPA and Cluster Autoscaler Together
The Horizontal Pod Autoscaler scales the number of pod replicas based on CPU, memory, or custom metrics. The cluster autoscaler adds or removes nodes when pods cannot be scheduled or when nodes are underutilized. Use both together to handle traffic spikes without manual intervention. Monitor HPA scaling events and cluster autoscaler scale up/down events to understand how your cluster responds to load.
Set conservative scale-up thresholds for HPA. Scaling too aggressively causes unnecessary pod churn and can trigger rapid cluster autoscaler scale-ups, increasing costs. Set scale-down delays to prevent flapping. A common configuration is to scale up quickly (within 1 to 2 minutes) but scale down slowly (10 to 15 minutes) to avoid destabilizing the cluster during temporary traffic dips.
Implement Structured Logging
Unstructured logs are hard to parse and expensive to store. Use structured logging formats like JSON so that each log line contains key-value pairs instead of free text. This allows log analysis tools to extract fields, filter by specific keys, and aggregate across dimensions. For example, logging {"level":"error","service":"checkout","latency_ms":1250} is far more useful than ERROR: checkout service slow.
Avoid logging at debug level in production unless actively troubleshooting. Debug logs can generate 10x or more volume compared to info-level logs. If you need debug logs for a specific service, enable them temporarily and revert after the issue is resolved.
Correlate Metrics, Logs, and Traces
Metrics tell you something is wrong. Logs provide context. Traces show the end-to-end path. Effective troubleshooting requires correlating all three. When you see elevated error rates in a service metric, jump to logs filtered by that service and time window. If logs show database timeout errors, pull traces for failed requests to see which query is slow.
Modern observability platforms link these signals automatically. For example, clicking on a slow trace might surface related logs and metrics for the same time window and pod. This correlation eliminates the need to manually reconstruct context across multiple tools and dashboards.
Tools and Implementation
AKS monitoring can be implemented using Azure native tools, open source platforms, or commercial observability solutions. Each approach has trade-offs in cost, complexity, and feature depth.
Azure Native Monitoring Stack
Azure provides a fully integrated monitoring stack: Azure Monitor for platform metrics and logs, Container Insights for pod and container telemetry, managed Prometheus for Kubernetes metrics, and Azure Managed Grafana for visualization. This stack requires minimal setup, integrates natively with AKS, and operates as a managed service with no infrastructure to maintain.
The downside is cost at scale. Log Analytics charges $2.99 per GB ingested after the first 5 GB daily. Managed Prometheus pricing starts at $0.228 per million samples ingested. A moderately busy cluster generating 50 GB of logs daily and 500 million Prometheus samples monthly can easily incur $5,000 to $10,000 in monitoring costs. Add data retention beyond the default 30 days, and costs climb further.
For teams with strict data residency or compliance requirements, Azure Monitor stores telemetry in Microsoft-managed infrastructure. You can select a region, but the data is not in your VPC. If your organization requires telemetry to remain within your own cloud environment, Azure native tools do not satisfy that constraint.
Open Source Observability Platforms
Open source tools like Prometheus, Grafana, Loki, and Tempo give you full control over your monitoring stack. You deploy them inside your AKS cluster, configure scrape targets, define dashboards, and manage retention policies. There are no per GB ingestion fees, no seat licenses, and no vendor lock-in. You own the data pipeline end to end.
The trade-off is operational overhead. You must size storage for Prometheus TSDB, configure remote write for long-term retention, set up high availability for Grafana, manage Loki ingesters and compactors, and handle version upgrades. For teams with deep Kubernetes expertise, this is manageable. For smaller teams or those without dedicated platform engineering resources, it becomes a distraction from building product features.
High cardinality data poses a challenge in self-hosted Prometheus. Kubernetes generates metrics with many label combinations: pod name, namespace, node, service. Querying these metrics efficiently requires careful cardinality management and sometimes downsampling or pruning old series. Without tuning, query performance degrades as metric volume grows.
Commercial Observability Platforms
Commercial observability platforms provide managed monitoring with deeper integrations, better UX, and enterprise features like anomaly detection, automatic trace sampling, and advanced alerting. Many platforms support OpenTelemetry natively, making it easy to send telemetry from AKS workloads.
Some platforms operate as SaaS, where telemetry is sent to the vendor’s cloud. Others support on-premises or bring-your-own-cloud deployment models, where the platform runs inside your VPC, and data never leaves your infrastructure. The latter model is common for regulated industries like healthcare and finance where data residency and compliance drive architectural choices.
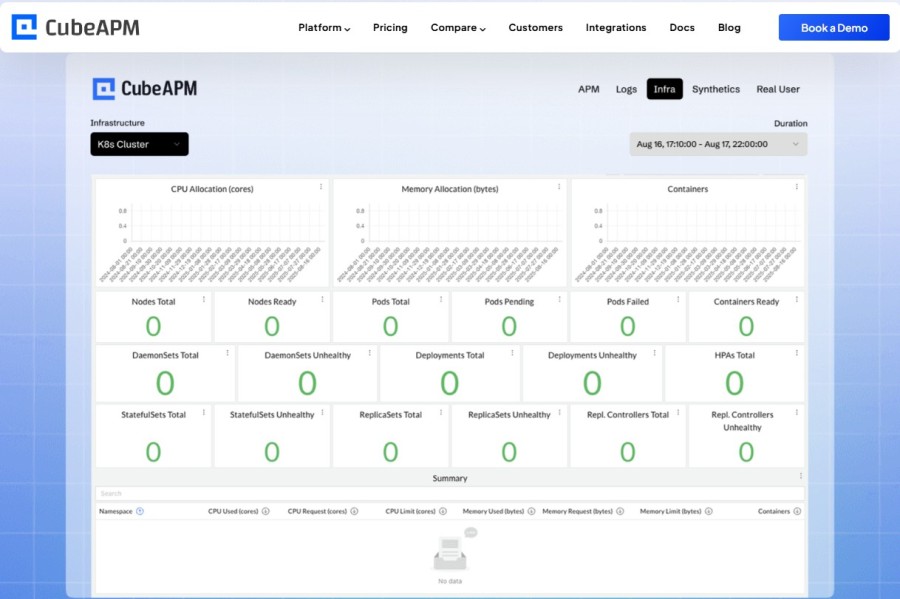
CubeAPM is an example of a platform designed for teams that want full-stack observability inside their own cloud. It deploys in your VPC, collects metrics, logs, and traces via OpenTelemetry, and provides APM, infrastructure monitoring, and log management in a unified interface. Because it runs on your infrastructure, there are no data egress costs, no per-seat fees, and no external dependencies during incidents. Pricing is based on data ingested at $0.20 per GB, which includes unlimited retention and unlimited users. For teams running large AKS clusters, this pricing model can deliver significant savings compared to SaaS platforms that charge per host, per user, or per feature.
Other platforms like Datadog, Dynatrace, and New Relic offer broad feature sets, deep integrations with cloud providers, and polished UIs. They excel in multi-cloud environments and provide turnkey solutions for teams that want to minimize operational overhead. The cost models vary widely. Datadog charges per host and per product APM, logs, infrastructure monitoring. Dynatrace uses host-based pricing with tiered plans. New Relic recently shifted to a consumption-based model with compute capacity units.
When evaluating tools, consider total cost of ownership. A platform with a low advertised price per GB might have hidden costs in data transfer fees, indexing charges, or seat licenses. A self-hosted open-source stack might be free in software costs but expensive in engineering time and infrastructure. Run a cost model based on your actual telemetry volume, team size, and retention requirements before committing.
Frequently Asked Questions
What is the difference between AKS monitoring and Kubernetes monitoring?
AKS monitoring specifically refers to monitoring Azure Kubernetes Service clusters, which are managed Kubernetes environments on Azure. Kubernetes monitoring is the broader practice of monitoring any Kubernetes cluster, whether on AWS EKS, Google GKE, on-premises, or self-managed. The core monitoring principles are the same, but AKS monitoring often integrates with Azure native tools like Azure Monitor and Container Insights.
How do I monitor AKS control plane health?
Enable diagnostic settings to route control plane logs to a Log Analytics workspace. Focus on kube apiserver, kube controller manager, and kube audit admin logs. Monitor API server latency and error rates through Azure Monitor platform metrics. High latency or elevated 5xx errors indicate control plane stress. Audit logs reveal authentication failures, unauthorized requests, and admission webhook issues.
What causes high monitoring costs in AKS?
High costs typically come from verbose logging, collecting full audit logs instead of filtered admin logs, or ingesting high cardinality metrics without sampling. Log Analytics charges per GB ingested, so applications logging at debug level or chatty microservices can generate gigabytes daily. Review log levels, filter unnecessary logs, and consider routing low-priority logs to cheaper storage like Azure Blob.
How do I detect pod OOMKills in AKS?
Monitor `kube_pod_container_status_terminated_reason` from kube state metrics. Filter for reason equals OOMKilled. OOMKills indicate that a container exceeded its memory limit. Either increase the memory limit or investigate the application for memory leaks. Correlate OOMKill events with memory usage metrics to confirm whether the limit is too low or the application is consuming excessive memory.
Should I use Container Insights or managed Prometheus?
Use both. Container Insights collects logs, Kubernetes events, and basic performance metrics. Managed Prometheus collects deeper Kubernetes metrics and application metrics exposed via Prometheus endpoints. Together, they provide full visibility. Container Insights is better for log analysis and inventory tracking. Managed Prometheus is better for querying time series metrics and building custom dashboards in Grafana.
How do I reduce Kubernetes metric cardinality?
Limit the number of unique label combinations in your metrics. Avoid labels with unbounded values like pod name or request ID. Use metric relabeling in Prometheus to drop unnecessary labels or aggregate metrics before storing. Set retention policies to prune old series. If using managed Prometheus, configure scrape intervals and filtering rules to reduce the volume of ingested samples.
What is the best way to monitor AKS workloads without vendor lock-in?
Use OpenTelemetry for instrumentation. OpenTelemetry is vendor-neutral and supports exporting telemetry to any compatible backend. Deploy an OpenTelemetry Collector in your cluster to receive, process, and route telemetry to your chosen observability platform. This approach decouples instrumentation from the backend, making it easy to switch platforms or send telemetry to multiple destinations simultaneously.