










Most engineering leaders will tell you their team has strong observability. Then a real incident hits, three people are staring at three different dashboards, and nobody can agree on what actually happened first. That gap between how mature a team believes it is and how mature it actually is shows up at the worst possible time, usually during a postmortem nobody wanted to write.
According to Elastic’s 2026 report, only 11 percent of IT leaders describe their observability practice as expert. Another 49 percent call it mature, and 7 percent are still in the early stages. Most organizations sit somewhere in the uncomfortable middle, further along than day one but nowhere near where their tooling budget suggests they should be.
Maturity here has nothing to do with how many dashboards a team has open or how many vendors appear on the invoice. It comes down to something simpler: how well telemetry signals connect to each other, and how much of the response to a problem happens before a customer notices, not after.
This article walks through the four practical stages of observability maturity, how to figure out honestly where your organization sits today, the mistakes that keep teams stuck at a stage longer than they should be, and what actually needs to change to move up.
What Is an Observability Maturity Model?
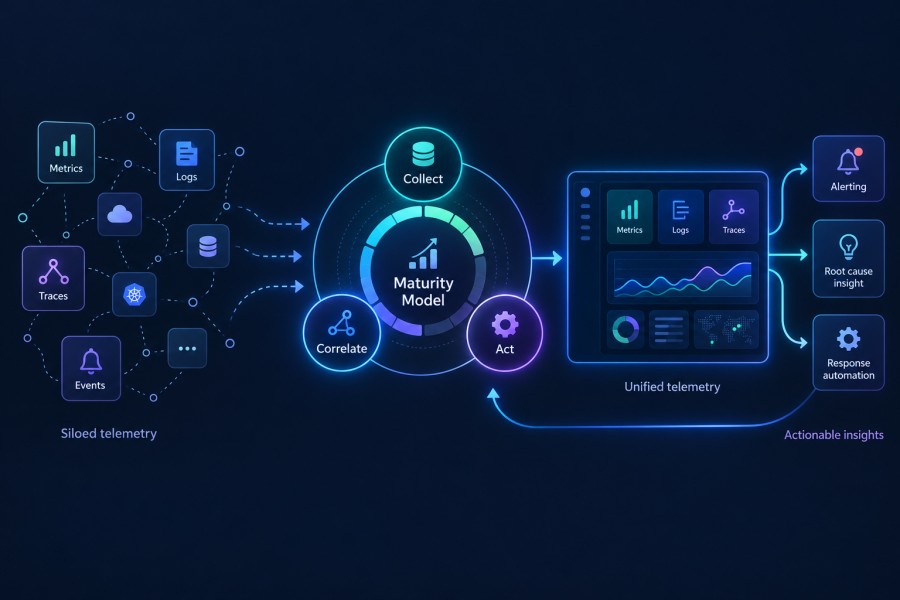
An observability maturity model is a staged framework for assessing one specific thing: how effectively an organization collects, correlates, and acts on telemetry data. It is not a checklist of tools to buy. A team can own every major observability platform on the market and still sit at an early stage if none of that data talks to each other.
Monitoring and observability get used a lot interchangeably, and that blurs the point of a maturity model before it even starts. Monitoring tells a team that something is wrong. Observability tells them why. A maturity model measures how far an organization has moved from the first answer toward the second.
Some frameworks include an earlier stage before basic monitoring, usually described as having no structured monitoring at all and relying entirely on user reports. That stage is real, but it barely qualifies as a starting point for a mature conversation. This model begins at Basic Monitoring, which is where the overwhelming majority of teams reading this already stand.
Why the model matters beyond engineering
Where this framework earns its value is not in engineering meetings. It shows up in budget conversations.
- A platform team asking for headcount or tooling spend has a stronger case when they can point to a specific stage.
- Naming the exact gap holding them back is more convincing than a general request for more visibility.
- Showing what closing that gap looks like in measurable terms, like MTTR or incident volume, turns the task into a business case instead of a wish list.
Without that framing, observability investment reads as vague, and vague requests are the first thing cut when budgets tighten.
The Four Stages of Observability Maturity
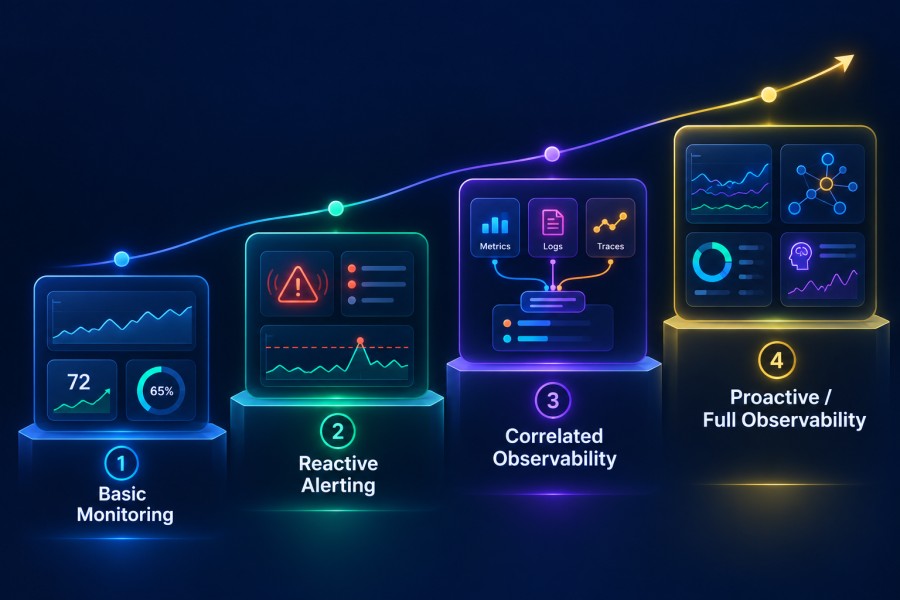
Stage 1: Basic Monitoring
At this stage, monitoring exists, but it exists in pieces. Each team runs its own tools, often chosen independently, with little coordination on what gets tracked or how.
- Dashboards live in silos, one per team or per system, with no shared view across the stack.
- Logging is inconsistent; some services log heavily, others barely at all.
- Alerts fire on raw thresholds like CPU or memory, with little regard for whether the spike actually affects users.
- Troubleshooting is reactive by default: someone gets paged, opens three or four tools, and manually pieces together a timeline.
Teams at this stage usually know something is wrong quickly. They rarely know why without a lot of manual digging first. MTTR here tends to be measured in hours, sometimes longer if the right person is not immediately reachable.
Stage 2: Centralized Telemetry
This is usually the point where teams start standardizing, often driven by a painful incident that exposed just how scattered their visibility had become.
- Metrics, events, logs, and traces (MELT) get collected consistently instead of ad hoc
- A central dashboard or platform becomes the default place to look, rather than one of several
- KPIs get defined explicitly: response time, error rate, saturation, rather than tracked informally
- OpenTelemetry adoption often begins here, as teams standardize instrumentation across services instead of relying on whatever each framework ships with by default
The improvement is real. Finding the right data takes far less time than it did at Stage 1. But the signals still mostly sit next to each other rather than inside each other. A trace and a log from the same incident might both be visible, but connecting them still takes a person doing the work manually.
Stage 3: Correlated Observability
This is the stage where the model’s name starts to earn its keep. Metrics, logs, and traces stop being three separate things a team checks in sequence and become one connected picture.
- A spike in a metric links directly to the trace that explains it, and the trace links to the logs from the exact request that misbehaved
- Root cause analysis moves from a manual, multi-tool exercise to something closer to a few clicks.
- On-call engineers stop guessing which system caused an issue and start confirming it directly from correlated data.
The impact on incident response is measurable, not theoretical. According to Elastic Observability Labs, organizations with mature observability practices report better MTTR outcomes 71 percent of the time, compared to just 40 percent of organizations still in early stages. That gap is almost entirely explained by correlation. Having the data is not the same as having it connected.
Stage 4: Proactive and Predictive Observability
At the final stage, the posture shifts from responding faster to preventing the incident from reaching users in the first place.
- Anomaly detection flags unusual behavior before it crosses an alerting threshold
- SLO-driven alerting replaces static thresholds, so alerts reflect actual user impact rather than arbitrary numbers.
- Observability data feeds directly into capacity planning, release decisions, and cost forecasting, not just incident response.
Very few organizations operate consistently at this stage, and that is fine. What separates genuinely proactive teams from teams that simply have more dashboards is not the volume of data. It is whether that data changes a decision before something breaks, not just after.
Which Stage Is Your Organization Actually In?
Most teams overestimate where they sit. Owning a modern observability platform feels like progress, but the platform is not the maturity; how the team uses it is. A few honest questions usually settle the question faster than any framework diagram.
- Check how MTTR has trended over the last two or three quarters. Flat or rising MTTR despite new tooling is a strong sign the team is stuck between Stage 1 and Stage 2, tools without correlation
- Notice whether responding to an alert requires opening more than one tool to understand what happened. If it does, the organization has not reached Stage 3 yet, regardless of what the marketing page for its observability platform claims
- Look at how alerts get triaged. If most alerts still require a person to manually decide whether they matter, the team is operating reactively, which caps maturity below Stage 4 no matter how sophisticated the dashboards look
- Ask whether observability data has changed a planning decision recently, a capacity forecast, a release delay, or a cost optimization. If the honest answer is no, the organization is using observability data defensively, not proactively
None of this requires a formal audit. A team can usually answer these honestly in a single meeting, and the answers tend to be more accurate than any self-reported maturity score, because they are grounded in what actually happened during the last few incidents rather than what the team intended to build.
Common Pitfalls That Stall Maturity Progress
Buying tools before defining the questions
Teams often start with a platform decision instead of a problem statement. A new observability tool gets purchased because a competitor uses it, or because a vendor made a strong pitch, without first agreeing on what question the team actually needs answered during an incident. The result is more data, not more clarity, and the maturity level stays exactly where it was.
Treating OpenTelemetry adoption as the finish line
Instrumenting services with OpenTelemetry feels like a major milestone, and it is a real one. But standardized instrumentation only gets an organization to Stage 2. Correlating that data, connecting a trace to the log and metric from the same incident, is a separate piece of work that does not happen automatically just because the data now shares a common format.
Fragmented ownership across teams
Infrastructure, application, and security teams frequently run entirely separate observability stacks, each optimized for their own use case. During a cross-cutting incident, that fragmentation means nobody has the full picture, and reconstructing it means pulling three teams into a call to compare notes manually. This is one of the most common reasons organizations plateau at Stage 2 for years.
Cost blowouts that force a step backward
As telemetry volume grows, so does the bill. Teams that do not plan for that growth often respond by sampling aggressively or dropping entire categories of data, sometimes the exact data that made correlation possible in the first place. What looks like a cost optimization is often a quiet regression in maturity, and it frequently goes unnoticed until the next major incident, when the missing data becomes obvious at the worst possible time.
What Moving Up a Maturity Level Actually Requires
From Stage 2 to Stage 3: building real correlation
Getting telemetry centralized is the easy part. Correlating it is where most teams underestimate the work involved.
- Signals need to share context from the moment they are collected: consistent trace IDs, consistent service and resource attributes, applied uniformly across every service, not just the ones instrumented first
- Retrofitting correlation onto a stack that was not built for it usually means reworking instrumentation across dozens of services, which is a multi-quarter effort, not a weekend project.
- Teams that skip this step often end up with a platform that can technically display traces, logs, and metrics side by side, without the underlying data actually linking them together
This is the stage where architecture decisions made years earlier start to matter a great deal. A platform built to treat OpenTelemetry data as a first-class citizen from day one carries far less of this retrofitting burden than one where OTLP support was added on top of an existing proprietary format.
From Stage 3 to Stage 4: earning the right to be proactive
Moving from correlated to predictive observability is less about tooling and more about trust in the data.
- Anomaly detection only works when the underlying telemetry is clean and consistent; noisy or incomplete data trains a system to ignore real problems.
- SLO-driven alerting requires the organization to agree, often across teams, on what actually counts as a violation worth waking someone up for
- This stage tends to fail organizationally before it fails technically; teams that have not built trust in Stage 3’s correlated data will not trust an automated system making decisions on top of it.
Where architecture decides how hard this gets
The jump to Stage 3 specifically depends on whether a platform’s underlying architecture was designed around OpenTelemetry from the start.
For example, CubeAPM (a full-stack observability platform) ingests traces, metrics, and logs natively over OTLP rather than converting them from a separate proprietary format after the fact. That architecture is a starting point, not a guarantee; an organization still has to do the work of building consistent trace IDs and resource attributes across its own services.
What it changes is where that work begins. The correlation effort starts from a foundation that already speaks one consistent protocol across every signal, instead of stitching together formats that were never designed to share context in the first place.
The practical difference shows up in effort, not outcome. Two teams can both reach Stage 3.
- One gets there by rebuilding instrumentation around a platform that was never built for correlation.
- The other gets there by extending a pipeline that was OTel native from day one.
The destination looks the same on a slide. The amount of engineering time it took to arrive is not comparable.
Conclusion
Observability maturity is not a certificate a team earns once and keeps forever. It is a direction, and most organizations will always have a next stage ahead of them, even the ones operating at Stage 4 today.
The real measure of progress was never how many tools sit in the stack. It is whether MTTR is actually trending down, whether incidents get caught before a customer notices, and whether telemetry data is shaping decisions before something breaks rather than explaining it afterward.
Getting there starts with an honest look at where the organization actually stands today, not where the tooling budget suggests it should be. From there, the path forward is less about adding another platform and more about making the data already being collected actually work together.
If correlation is the gap holding your team back from Stage 3, it is worth looking at whether your current stack was built for it from the start. CubeAPM runs natively on OTLP for traces, metrics, and logs, which is a reasonable place to start that evaluation.
FAQ
What is the difference between monitoring and observability maturity?
Monitoring tells a team that something is wrong. Observability tells them why. Maturity measures how far an organization has progressed from the first capability toward the second, based on how well its telemetry is collected, correlated, and acted on, not on how many monitoring tools it owns.
How many stages are in an observability maturity model?
This model uses four stages: Basic Monitoring, Centralized Telemetry, Correlated Observability, and Proactive and Predictive Observability. Some frameworks add an earlier stage for organizations with no structured monitoring at all, but most teams evaluating their maturity are already past that point.
What is the fastest way to move from basic monitoring to full observability?
There is no shortcut past Stage 2; centralizing metrics, logs, and traces has to happen first. After that, the fastest path to Stage 3 is standardizing on consistent trace IDs and resource attributes across every service from the start, rather than retrofitting correlation onto services instrumented independently over time.
Does OpenTelemetry adoption automatically improve observability maturity?
Only partially. It solves collection, giving every service a consistent way to emit telemetry, which is most of what Stage 2 requires. It does not solve correlation on its own. A team still has to deliberately wire trace IDs and resource attributes through every service so a metric, trace, and log from the same incident can actually be linked, which is the specific work Stage 3 depends on.
How is observability maturity measured?
The most reliable indicators are trend-based, not tool-based. Falling MTTR, fewer alerts requiring manual triage, and observability data actively influencing planning decisions like capacity or cost forecasting are stronger signals of maturity than the number of platforms in use.
Disclaimer: This article reflects observability maturity benchmarks and statistics available as of the publish date. Survey findings and industry maturity figures change as new reports are released. Verify current statistics against the original source reports, linked above, before using them in planning or budget conversations