










Production AI is a humbling experience. You push an LLM-powered feature live, the monitoring dashboards show green, and three days later, a user screenshots your chatbot confidently fabricating a return policy that does not exist. The HTTP response was 200. The latency was under a second. Every traditional metric looked fine. The model was just quietly wrong.
This is the core problem that conventional observability was never built to solve. And it is more widespread than most engineering teams acknowledge. According to a 2026 Elastic survey of over 500 IT decision-makers, 85% of organizations currently use GenAI for observability, with that number projected to reach 98% within two years. Yet the gap between deploying AI and actually understanding its behavior in production remains enormous.
OpenTelemetry has become the industry’s answer to that gap. This guide covers the GenAI semantic conventions, the metrics that actually matter for LLM systems, distributed tracing for agentic workflows, MCP instrumentation, and how to run a self-hosted pipeline that keeps prompt data off third-party platforms.
Why Traditional APM Fails AI Systems?
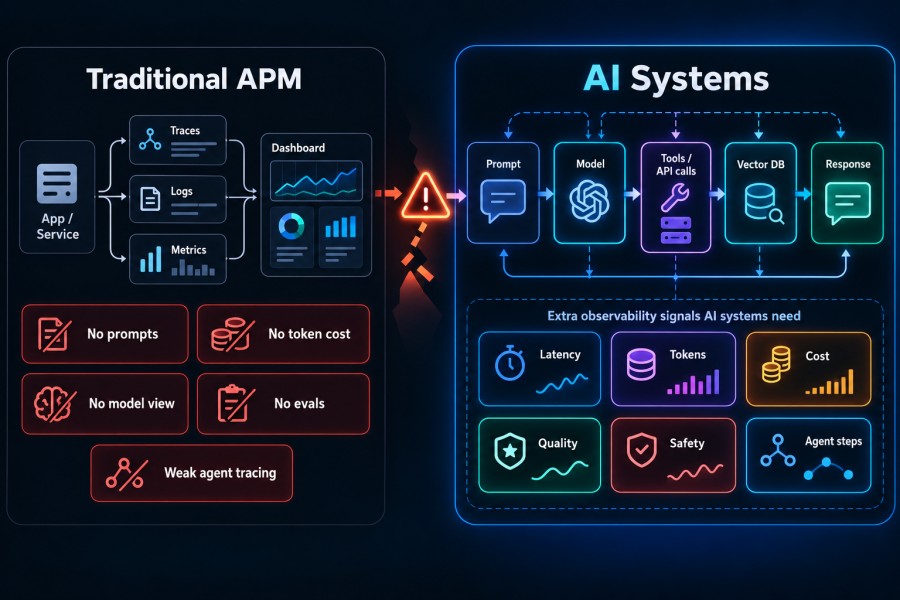
Before getting into instrumentation strategy, it helps to be precise about exactly where traditional APM falls apart.
- Traditional application performance monitoring was designed around three assumptions: code is deterministic, failure surfaces as an exception or error code, and outputs can be validated before production. LLM-based systems violate all three.
- Determinism is gone. The same prompt sent twice to the same model returns different outputs. Without capturing the exact input, model parameters, temperature setting, and sampling seed at the moment of the call, post-incident analysis is guesswork.
- Failure is silent. An API can return a 200 status code while delivering a completely fabricated answer. There is no equivalent of a stack trace for a hallucination. The system did not crash. It reasoned incorrectly. As Braintrust notes, APM would report that interaction as successful.
- Cost scales with output, not compute time. Unlike a database call billed by milliseconds, an LLM call is billed by tokens consumed. A verbose system prompt or a user who pastes a 10,000-word document can cost 100x more than a normal interaction, and that cost is completely invisible to CPU and memory dashboards.
- Agentic complexity compounds everything. A single user message in a modern AI application might trigger an embedding model call, three vector database queries, two LLM invocations, a tool call to an external API, and a retry when that tool times out. An APM tool that only sees the outer HTTP boundary tells you the request took 38 seconds. It cannot tell you that 30 of those seconds came from a single slow retrieval step on the second LLM call.
A June 2026 IBM study of 2,000 C-level technology executives found that two-thirds are held accountable for AI systems they do not fully control, and 85% lack full visibility into real-time AI spend. That is an observability problem, and OpenTelemetry is the most credible path through it.
OpenTelemetry’s Graduation and Its Significance for AI
In May 2026, the Cloud Native Computing Foundation announced the graduation of OpenTelemetry, cementing its status as the essential, unified observability standard for complex systems. The graduation matters because it signals API stability. Organizations can instrument their infrastructure on OTel and reasonably expect that the contracts will hold.
The download numbers reflect real adoption, not hype. The OTel Python package surpassed 1.3 billion downloads in the past twelve months, and the JavaScript package crossed 1.36 billion, with both setting new monthly records in April 2026. Python is the primary language for AI development. That number is not incidental.
OpenTelemetry also holds the second-highest project velocity among over 240 CNCF projects, behind only Kubernetes. Organizations including Anthropic, Bloomberg, and Capital One already rely on it to monitor and secure their systems.
The technical reason OpenTelemetry suits AI workloads is its unified signal model. Logs, metrics, and traces flow through the same SDK and the same Collector pipeline. A single user request to an AI agent produces all three: a trace that maps the reasoning chain, metrics that count tokens and measure latency, and log events that capture prompt content when enabled. Keeping those signals correlated through a shared trace context is exactly what OpenTelemetry does by design.
The GenAI Semantic Conventions: A Common Language for AI Telemetry
The most practically important development for AI teams is the OpenTelemetry GenAI Special Interest Group, which has been working since April 2024 to define standard attribute schemas for AI workloads.
The GenAI SIG started with a focused goal: define a standard set of attributes for LLM client calls covering model name, token usage, and latency, so that different instrumentation libraries produce consistent telemetry. It has since expanded to cover agent orchestration, MCP tool calling, content capture, and quality evaluation: six layers in all.
As of June 2026, the GenAI semantic conventions carry Development status, with most individual attributes still marked experimental. That should not stop teams from adopting them. The foundation is stable enough to build on today, and major vendors have already aligned to them. Datadog began native support at OTel v1.37, mapping gen_ai.* attributes directly into its LLM Observability product. Grafana’s AI Observability stack receives GenAI traces in Tempo and logs in Loki, both over OTLP.
The contributor list for the GenAI SIG reads like an industry roll call. Amazon, Elastic, Google, IBM, Microsoft, Langtrace, OpenLIT, and Traceloop are all upstream contributors. When this many vendors collaborate on a schema before it is finalized, building on it is the safest engineering bet available.
Span Structure for LLM Calls
When an application calls an LLM, the instrumentation emits a span. The span name follows the pattern {operation.name} {gen_ai.system}, for example chat anthropic or chat openai, making traces human-readable in any OTel-compatible backend.
The span carries standardized attributes. From the official OTel spec:
- gen_ai.request.model: the model used, for example gpt-4o or claude-3-7-sonnet
- gen_ai.usage.input_tokens and gen_ai.usage.output_tokens: token counts per call
- gen_ai.response.finish_reasons: why the model stopped generating, such as stop, tool_calls, or length
The finish reason attribute deserves more attention than it usually gets. A finish reason of length means the model hit its context window and truncated the response. The API returned 200. The user received an incomplete answer. Without this attribute, that failure mode is completely invisible in production. A finish reason of content_filter means a safety guardrail fired. Both require different operational responses, and neither shows up in a traditional error rate metric.
By default, no prompt content is captured with GenAI telemetry, since prompts can contain sensitive data. Content capture via gen_ai.input.messages, gen_ai.output.messages, and gen_ai.system_instructions is opt-in. This is the right default for any team operating under data privacy requirements.
Agent Span Types
The spec defines four span operation types specifically for agents: create_agent, invoke_agent, invoke_workflow, and execute_tool. The span kind matters operationally. An invoke_agent span carries CLIENT kind when the agent runs remotely, for example through an OpenAI Assistants API or AWS Bedrock Agent, and INTERNAL kind when it runs inside your own process, such as a LangChain or CrewAI agent.
This distinction matters for latency attribution. A remote agent invocation includes network overhead that belongs on the caller side. An in-process agent step is pure compute overhead inside your own service boundary. Collapsing both into the same span kind obscures where time actually goes.
Standard Metric Instruments
The conventions define two primary metric instruments that teams should emit for every LLM call:
- gen_ai.client.token.usage: a counter tracking token consumption by model and token type (input vs. output)
- gen_ai.client.operation.duration: a histogram recording LLM call duration in seconds
These metric names are standardized across providers. A team that migrates from OpenAI to Anthropic does not need to rebuild dashboards or rewrite alert rules. The attribute key changes from gen_ai.system: openai to gen_ai.system: anthropic, but the metric name and schema stay the same. Datadog, Honeycomb, Grafana, and OpenObserve all auto-detect these metric names. That portability is the practical value of semantic conventions at scale.
AI Model Observability Metrics: What Actually Matters
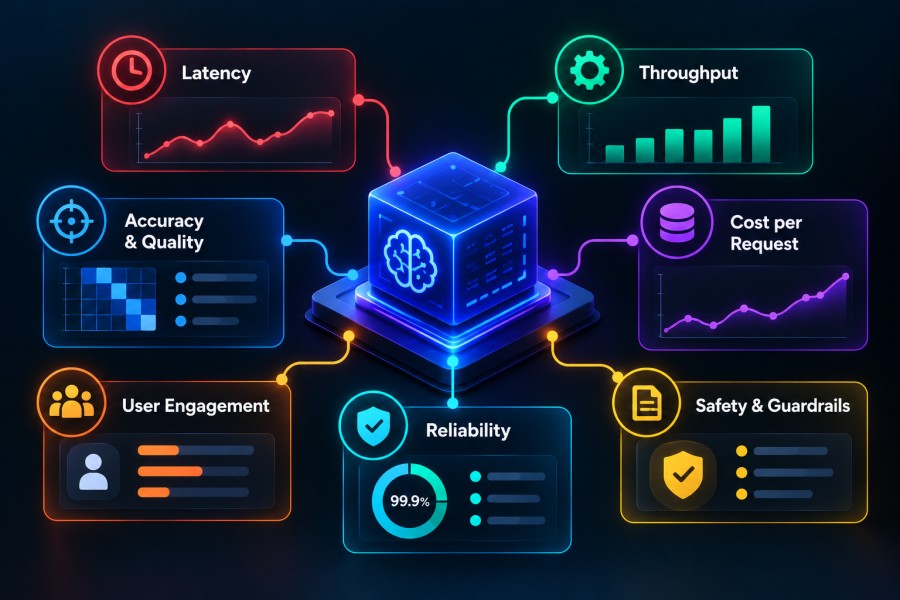
Observability for AI workloads requires two categories of metrics that traditional APM tools were never designed to capture. The first covers inference performance: the speed and resource efficiency of model calls. The second covers model behavior: the quality, consistency, and safety of what the model produces.
Inference Performance Metrics
Time to First Token (TTFT). TTFT measures the time from when a request is submitted to when the model returns the first token, including request queuing time, prefill time, and network latency. For streaming applications, this is the metric users feel most directly. A 200ms TTFT feels instant. Anything above two to three seconds breaks the sense of real-time interaction.
The longer the input prompt, the higher the TTFT. The attention mechanism must process the entire input sequence and build a key-value cache before generation begins. This creates a practical tradeoff between context richness and responsiveness. RAG systems that stuff large documents into the context window pay a TTFT penalty that needs to be tracked and bounded with SLOs.
Inter-Token Latency (ITL). ITL measures the time between consecutive tokens during generation, directly affecting perceived responsiveness in streaming UIs. An agent that streams 500 tokens at 60ms ITL takes 30 seconds to complete delivery regardless of how fast TTFT was. ITL degrades under load as GPU compute is shared across concurrent inference requests.
Tokens Per Second (TPS). Standard benchmarks track TPS at p50 and p90 for both total throughput and decode throughput separately, giving both median and tail performance. For teams running self-hosted models, TPS is the primary scaling signal: when p90 TPS starts dropping, it is time to add GPU capacity or optimize batch configuration.
Queue Depth and Wait Time. Five core metrics cover most production issues for self-hosted LLMs: TTFT, TPS, queue length, GPU memory headroom, and KV-cache hit rate. Queue depth is frequently ignored in early deployments and consistently becomes the first bottleneck in production. A single long-context request can monopolize GPU memory and block dozens of shorter requests queued behind it.
KV-Cache Hit Rate. Prompt caching reduces both latency and token cost for repeated content: system prompts, document contexts, conversation history prefixes. A low cache hit rate on a high-traffic endpoint is a direct cost optimization signal. Tracking it as a metric and correlating it against token spend helps teams prioritize which prompts to cache first.
GPU Memory Utilization. For teams running self-hosted models, GPU memory headroom determines whether a burst of long-context requests causes out-of-memory errors or context truncation. Tracking peak GPU memory and p90 GPU utilization separately reveals whether performance degradation under load is compute-bound or memory-bound, which points to very different remediation paths.
Model Behavior Metrics
This is the harder category, and the one most observability setups skip entirely. These signals determine whether an AI observability strategy is actually producing trustworthy results, not just fast and cheap ones.
Faithfulness and Hallucination Rate. For RAG systems, faithfulness measures whether the model’s answer is grounded in the retrieved documents. Teams add this as a custom span attribute, populated by a post-response evaluator, that records a score per request. Over time, this becomes a model quality SLO: if faithfulness drops below a threshold after a prompt change or model upgrade, an alert fires.
Output Length Distribution. Monitoring the distribution of output token counts by query type reveals truncation patterns and model verbosity drift. If average output length for a class of queries suddenly doubles after a system prompt change, that is a cost signal. If it drops sharply, that may indicate the model is hitting the context limit and truncating instead of completing.
Model Drift. Embedding drift can be tracked by monitoring when embeddings of new content start veering far from the original training distribution. This matters after model version upgrades or fine-tuning runs. What appears to be a configuration change can produce subtle but real shifts in output behavior that only become visible through embedding-space analysis over time.
Context Coherence in Multi-Turn Conversations. Logging entire sessions as linked traces, connected through a shared session ID attribute, makes it possible to detect context drift before users start reporting it. Agents that start ignoring earlier instructions or shift tone unexpectedly are exhibiting coherence failures that appear nowhere in a request-level error rate.
Safety Filter Trigger Rate. For applications with guardrails or content classifiers, tracking the rate at which responses get flagged gives a real-time view of model safety posture. A spike in filter triggers after a prompt change is an early warning signal, not just a compliance event.
Token Cost Attribution. Token counts are proxy cost figures. The actual spend depends on the model, provider, and whether prompt caching was used. Teams that attach cost attribution as span attributes, broken down by service name, user cohort, or feature flag, can answer questions like which product feature is driving 40% of the monthly LLM bill, and then make informed decisions about model selection or prompt optimization.
Tracing Multi-Step AI Agent Workflows
Single LLM calls are relatively straightforward to instrument once the semantic conventions are in place. The real complexity arrives with agentic systems, where a user request fans out across a graph of operations spanning multiple models, tools, and services.
A single user request in a modern LLM application might pass through an embedding model, a vector database, a retriever, a reranker, a prompt template, an LLM, an output parser, and sometimes an agent loop that calls tools along the way. Each step has its own latency contribution, token cost, and failure mode. An outer HTTP trace that shows “request took 45 seconds” is nearly useless for debugging any of it.
OpenTelemetry handles this through span hierarchies. The top-level invoke_agent span becomes the root. Each LLM call inside the agent becomes a child chat span. Each tool invocation becomes a child execute_tool span. Each vector database query becomes a retrieval span with gen_ai.data_source.* attributes. The resulting trace is a full decision graph of the agent’s reasoning: not just what happened, but when, in what order, and what each step cost.
Auto-Instrumentation for Agent Frameworks
For the most common frameworks, getting this instrumentation in place is minimal work. In Python, OpenAI tracing can start with a single line, OpenAIInstrumentor().instrument(), after which semconv-compliant spans are produced automatically with no manual span creation.
This works because LangChain exposes a callback system and LlamaIndex exposes a dispatcher hierarchy. Both are designed so external tools can observe execution without modifying application code. OpenLLMetry hooks into these systems and emits OpenTelemetry spans automatically. Auto-instrumentation libraries now support over 40 AI frameworks, including LangChain, LlamaIndex, CrewAI, and the OpenAI Agents SDK.
The tracing overhead from OTel’s asynchronous batch processing stays below 1% of application performance. Since LLM calls themselves take between one and thirty seconds in most production scenarios, the instrumentation cost is immeasurable in practice.
Failure Patterns Unique to Agent Traces
Agent systems fail in ways that look like success from the outside. Several failure patterns surface in trace data with the right instrumentation.
Redundant tool calls. An agent that calls the same tool twice with identical inputs wastes both tokens and latency. This pattern appears in trace data as duplicate sibling spans under an invoke_agent root with matching input attributes. Alerting on this at the span level is more precise than any metric-based approach.
Retry storms. When a tool fails, and the agent retries without a backoff or cap, the trace shows a fan of execute_tool spans with error attributes accumulating in real time. Without a per-tool retry rate metric, this becomes a billing event before an engineer notices.
Reasoning depth explosions. Some agent frameworks allow recursive self-delegation or unbounded reflection loops. Tracking maximum span depth and total LLM call count per user request provides the guardrails that framework-level logic alone cannot enforce.
Context loss across turns. Multi-turn agent conversations can lose parent trace context if sessions are not explicitly managed. When a user interacts with an agent across multiple turns, each turn may start a new trace unless the application explicitly propagates a session-level context. The fix is to propagate a custom session.id attribute through all spans in a conversation, enabling post-hoc correlation even when trace context breaks.
Tracing MCP Servers: The New Observability Frontier
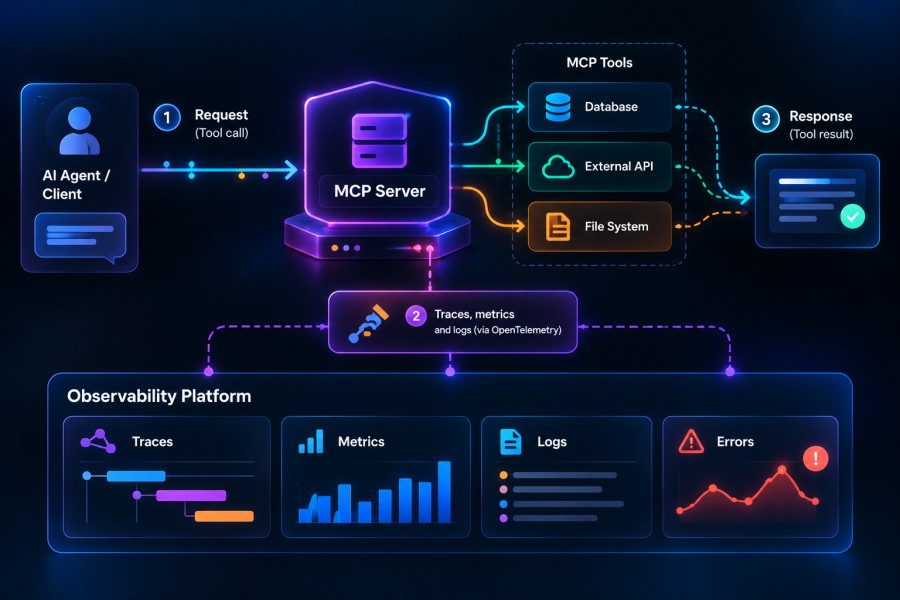
Model Context Protocol has become the standard way to connect AI agents to tools and data sources, and it introduces an instrumentation surface that most observability guides have not yet addressed properly.
MCP servers sit at a critical junction: they are the bridge between AI agents and infrastructure. Unlike a traditional API where a human triggers a request and can see the response, MCP tool calls are initiated by an AI model. The human is often not in the loop at all. AI agents decide when and how to call tools, making load profiles completely unpredictable compared to a traditional API.
The OTel solution for MCP instrumentation uses the same execute_tool span defined in the GenAI agent conventions. Each tool invocation on the MCP server gets wrapped in a span carrying the tool name, input arguments (redacted if they contain PII), response status, and duration.
The critical piece is context propagation across the MCP boundary. For HTTP-based MCP transports such as SSE and Streamable HTTP, trace context propagates naturally via HTTP headers, connecting the calling agent’s span directly to the MCP server’s span. For stdio-based transports, trace context must be passed explicitly through tool call parameters or environment variables.
The result is a single trace showing the complete chain: agent reasoning, tool selection, MCP server execution, and downstream service calls. When something breaks, you see the entire path rather than arriving at the MCP server’s logs in isolation and trying to correlate timestamps manually.
Grafana’s AI Observability dashboard provides pre-built MCP observability panels showing tool performance, call latency histograms, success rates, and invocation counts per tool. That is useful as a reference for what the data should look like, even for teams running a different backend.
According to Galileo’s survey data, teams with stronger AI observability and evaluation practices report 2.2x better reliability than teams without them. MCP instrumentation is one of the areas where that reliability gap is most visible.
The OTel Collector as an AI Telemetry Policy Layer
Teams running at any meaningful scale use the OpenTelemetry Collector for more than data routing. For AI workloads specifically, the Collector becomes a policy enforcement point between instrumented applications and the observability backend.
PII redaction before export. Prompt content and completion text, when captured, often contain names, account numbers, medical information, or legal content. A Collector processor that scans gen_ai.input.messages and gen_ai.output.messages attributes and replaces recognized PII patterns with structured placeholders before export is a compliance requirement in regulated industries. Doing redaction at the Collector rather than in application code means the policy applies uniformly across all services, regardless of which team wrote them.
Adaptive sampling for cost control. AI agent traces are verbose. A single multi-step agent interaction can produce dozens of spans. At scale, storing every span for every request is expensive. Tail-based sampling in the Collector, where sampling decisions are made after the full trace is assembled, lets teams keep 100% of traces containing errors, slowness beyond a threshold, or high token costs, while sampling down normal-path traces. This maximizes debugging value while controlling storage costs.
Cost attribution enrichment. The Collector can enrich spans with business context before they reach the backend: attaching user cohort labels, feature flag states, or billing tier attributes from an external lookup. This kind of enrichment would be expensive and repetitive if implemented in every instrumented service separately.
Provider-aware routing. Teams using multiple LLM providers can route telemetry by gen_ai.system attribute: traces from OpenAI go to one backend, traces from self-hosted models go to another. As Datadog notes, Collector-level processors enforce data policies before telemetry leaves the network, which keeps governance consistent across every service in the pipeline.
Running a Self-Hosted AI Observability Pipeline
For teams that cannot send prompt data or model outputs to a third-party SaaS platform, a self-hosted observability pipeline is the only viable architecture. The components are well-defined, and the assembly is straightforward.
- Instrumentation layer. Auto-instrumentation via OpenLLMetry or the OTel Python SDK produces GenAI-compliant spans with no changes to LLM call code. Custom spans cover application-specific logic: prompt selection, retrieval pipeline steps, post-processing, and evaluation scores.
- Collector. A self-hosted OTel Collector handles PII redaction, tail-based sampling, and routing. The Collector configuration is infrastructure-as-code, version-controlled, and auditable. For teams already running Kubernetes, the OpenLIT Operator provides zero-code injection of OpenTelemetry instrumentation into AI workload pods without image rebuilds or code changes.
- Backend. CubeAPM is an OpenTelemetry-native APM built for self-hosted deployment. It receives all three telemetry signals directly over OTLP, which means all gen_ai.* span attributes from LLM and agent traces arrive without schema translation or vendor-specific agents. Teams can filter traces by model name, finish reason, token count range, or any custom attribute added to their spans. Cost attribution queries, latency breakdowns by agent step, and error rate views by tool name all use the same query interface as traditional application traces.
CubeAPM’s ingestion-based pricing means AI workloads do not face a penalty for the trace verbosity that agentic systems naturally produce. A system generating 50 spans per user session does not cost more per user than one generating 5. That pricing model aligns with how AI observability data actually behaves in production.
The self-hosted architecture keeps sensitive telemetry within the organization’s network boundary. When prompt content capture is enabled for debugging, data flows from the instrumented service through the on-premises Collector to the on-premises CubeAPM instance. None of it crosses an internet boundary, satisfying the data residency requirements that financial services, healthcare, and government teams routinely face.
What the GenAI Conventions Do Not Cover
The OTel GenAI semantic conventions are comprehensive for infrastructure-level AI observability. They deliberately stop short of output quality, and that gap is intentional. Output quality is application-specific: a faithfulness score for a legal research agent means something different than a faithfulness score for a customer support bot. The GenAI conventions do not cover output evaluation, safety scoring, or content quality assessment by design.
The practical path is to add quality signals as custom span attributes alongside the standard ones. A post-response evaluator that scores the output for faithfulness, toxicity, or policy compliance can attach those scores as custom.eval.faithfulness, custom.eval.toxicity, and so on. Those attributes become filterable dimensions in the observability backend, enabling dashboards that show quality metrics alongside token cost and latency in the same trace view.
This approach works precisely because the OTel data model treats attributes as open-ended key-value pairs. Teams are not constrained to what the semantic conventions define. The conventions provide the shared foundation that makes telemetry interoperable across providers and backends. Custom attributes build the application-specific layer on top.
The GenAI SIG Roadmap: Where This Is Heading
The OTel GenAI SIG roadmap is structured in three horizons. Near term: ship OTel instrumentation libraries for OpenAI and other GenAI clients in Python and JavaScript. Mid-term: extend coverage to embeddings, image and audio generation, and popular orchestration frameworks. Long term: full instrumentation for complex multi-step scenarios including RAG pipelines, agent frameworks, and multi-agent coordination.
The multi-agent coordination layer is the one to watch. Current conventions handle a single agent invoking tools well. The harder problem is a hierarchy where an orchestrator agent delegates to specialist sub-agents that each maintain their own context and tool access. Tracing that graph reliably, with correct parent-child span relationships across asynchronous boundaries, requires conventions that are still being drafted as of mid-2026.
The community recognized early that proprietary, vendor-specific approaches to AI observability would fragment the ecosystem and lock teams into inflexible solutions. That recognition drove the GenAI SIG in the first place, and it is why OpenTelemetry is the right foundation rather than one of the proprietary AI observability SDKs that tie instrumentation to a single vendor’s platform.
Teams that build on OpenTelemetry now absorb future GenAI convention expansions through library version updates. Teams that build on proprietary instrumentation face a migration at some point, because the ecosystem is converging on the OTel standard whether individual vendors support it yet or not.
Conclusion
OpenTelemetry for AI workloads is not a future roadmap item. It is a production discipline, and the teams who treat it as one today have a meaningful operational advantage over those still watching dashboards that show green while their models silently fail.
The work is layered. Start with auto-instrumentation for LLM calls using the GenAI semantic conventions. Add agent spans for orchestration logic. Instrument MCP servers with propagated trace context so tool calls are visible end-to-end. Build quality metrics as custom span attributes alongside the standard ones. Run the pipeline through a self-hosted Collector with PII redaction and tail-based sampling. And choose a backend that receives all three OTel signals natively over OTLP, keeps data within your network boundary, and scales with AI trace verbosity without penalizing it.
That is what production-grade AI observability looks like in 2026. The tools are available. The standards are stable enough to build on. The question is how long your team waits before treating AI infrastructure with the same operational rigor the rest of your stack already demands.
FAQs
What is OpenTelemetry for AI workloads?
OpenTelemetry for AI workloads refers to using the OTel SDK and GenAI Semantic Conventions to instrument large language model applications and AI agent systems. It captures traces, metrics, and logs for LLM inference calls, token usage, latency, cost, and agent tool interactions in a vendor-neutral format that any OTLP-compatible backend can receive.
What AI model observability metrics should teams track with OpenTelemetry?
Teams should track inference performance metrics including time to first token, inter-token latency, tokens per second, queue depth, KV-cache hit rate, and GPU memory utilization. Beyond infrastructure metrics, they should also track model behavior signals such as hallucination or faithfulness rates, output length distribution, model drift via embedding analysis, safety filter trigger rates, and token cost attribution by feature or user segment.
Are the OpenTelemetry GenAI semantic conventions production-ready?
As of mid-2026, the GenAI semantic conventions carry Development status, with most individual attributes still marked experimental. The foundation is stable enough for production adoption, and major vendors, including Datadog and Grafana, already support them natively. Teams should use the OTEL_SEMCONV_STABILITY_OPT_IN environment variable with the value gen_ai_latest_experimental to adopt the latest version while maintaining backward compatibility.
How does OpenTelemetry trace multi-step AI agent workflows?
OpenTelemetry uses span hierarchies to represent agentic workflows. The top-level invoke_agent span is the root. Each LLM invocation becomes a child chat span, each tool call becomes a child execute_tool span, and each retrieval step becomes a child retrieval span. This hierarchy produces a full trace of the agent’s reasoning chain, showing exactly where latency accumulates and where errors originate.
How does OpenTelemetry handle MCP server tracing?
MCP tool invocations get wrapped in execute_tool spans using the GenAI agent conventions. Trace context propagates through HTTP headers for HTTP-based MCP transports, connecting the calling agent’s span directly to the MCP server’s span. For stdio-based transports, context must be passed explicitly. The result is a single trace spanning the full chain from agent reasoning through tool execution to downstream service calls.
Disclaimer: The information in this article reflects the state of OpenTelemetry, the GenAI semantic conventions, and third-party vendor support as of June 2026. The OpenTelemetry GenAI conventions are under active development, and specific attribute names, metric instruments, span types, and stability statuses may change as the spec matures. Pricing figures, vendor feature availability, and download statistics are sourced from public announcements and official documentation at the time of writing and may have since been updated. Always verify details against official sources before implementing in production.