









Honeycomb.io is an observability platform built for high-cardinality debugging, distributed tracing, and production investigation. It is especially useful for engineering teams that need to ask new questions during incidents instead of relying only on fixed dashboards.
Honeycomb.io pricing is based mainly on events per month. Its Free plan includes up to 20M events/month, while Pro starts at $130 per 100M events and scales up to 1.5B events/month. Honeycomb also supports OpenTelemetry, BubbleUp, SLOs, Canvas AI Copilot, MCP, Refinery, and Honeycomb Metrics, which became generally available in March 2026.
This review covers Honeycomb’s 2026 pricing, event-based billing, key features, real-world cost factors, user feedback, and how it compares with alternatives such as CubeAPM, Datadog, Grafana Cloud, New Relic, and Coralogix.
What Is Honeycomb.io?
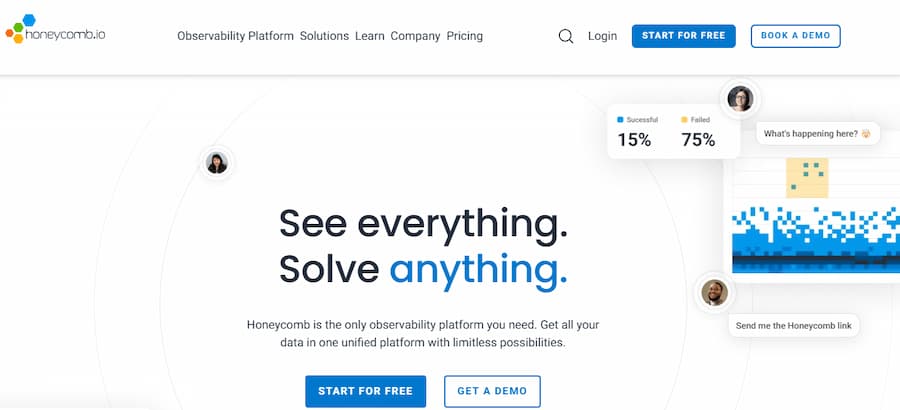
Honeycomb.io is an observability platform for debugging complex production systems. It helps engineering teams analyze traces, events, metrics, and service behavior so they can find issues across distributed applications.
Honeycomb’s core model is event-based. In distributed tracing, each span counts as one event, so usage depends heavily on request volume, trace depth, and how much telemetry the team sends. Honeycomb datasets include 60-day fixed retention, based on the date events are ingested.
The platform now includes distributed tracing, BubbleUp, SLOs, OpenTelemetry support, Honeycomb Metrics, Canvas AI Copilot, Honeycomb MCP, Refinery sampling, and Private Cloud options for AWS environments. Honeycomb Metrics became generally available in March 2026, and Honeycomb Private Cloud runs the platform inside a customer’s AWS cloud account.
Honeycomb is best known for:
- Distributed tracing
- High-cardinality event analysis
- BubbleUp anomaly correlation
- OpenTelemetry-native ingestion
- SLOs and burn-rate alerting
- Service maps on Enterprise
- Honeycomb Metrics
- Canvas AI Copilot
- Honeycomb MCP
- Refinery sampling
- Private Cloud deployment options for AWS environments
Honeycomb’s current platform pages and pricing page list distributed tracing, log analytics, time series metrics, frontend observability, telemetry pipeline, Private Cloud, SLOs, service map, BubbleUp, OpenTelemetry, Canvas, MCP, and anomaly detection as part of its product ecosystem.
Honeycomb Key Features
Honeycomb supports distributed tracing across services, requests, and dependencies. This is one of its strongest use cases because each trace can show how a request moves through a system and where latency, errors, or bottlenecks appear.
Honeycomb is built for high-cardinality debugging. Teams can query rich telemetry fields such as service, endpoint, region, customer ID, deployment version, and feature flag without treating every new field as a separate pricing item. Honeycomb’s pricing page says users can send high-signal telemetry with unlimited custom fields.
BubbleUp helps teams find what changed during an incident. It compares abnormal traffic with normal traffic and highlights the fields most connected to the issue, such as a specific endpoint, region, user group, or deployment.
Honeycomb supports OpenTelemetry ingestion, making it easier for teams to use open instrumentation instead of vendor-specific agents. This is useful for teams that want telemetry portability and less long-term lock-in.
Honeycomb Metrics became generally available in March 2026. It adds native time-series metric storage for infrastructure metrics and works alongside Honeycomb’s event-based model. Honeycomb says teams can send OpenTelemetry metrics to Honeycomb without re-instrumenting.
Honeycomb includes triggers and SLOs for reliability tracking. Free includes 2 triggers, Pro includes 100 triggers and 2 SLOs, and Enterprise starts with 300 triggers and 100 SLOs, according to Honeycomb’s pricing page.
Honeycomb includes AI-assisted investigation features such as Canvas AI Copilot and Honeycomb MCP. These are listed across Honeycomb’s pricing tiers, though teams should verify exact access and limits before buying.
Refinery is Honeycomb’s sampling tool for controlling event volume before data reaches Honeycomb. It is especially important for high-volume environments because Honeycomb pricing is based on ingested events.
Honeycomb Private Cloud is for teams that need stronger data control than standard SaaS. Honeycomb describes Private Cloud as a way to run Honeycomb inside a customer’s AWS environment, which can help with data residency and governance needs.
Honeycomb Pricing in 2026
Honeycomb pricing is primarily based on events per month. Honeycomb defines events as the base unit of usage, and all successful events ingested by Honeycomb count against the event-per-month limit. Events sampled before ingestion, such as through Refinery or another sampling method, do not count against the EPM limit.
Honeycomb Published Plans
| Plan | Published pricing | Event allowance |
| Free | Free | Up to 20M events/month |
| Pro | Starts at $130/month | Up to 1.5B events/month |
| Enterprise | Custom | Variable |
How Honeycomb Counts Events
Honeycomb’s pricing depends on events per month. An event is the basic unit Honeycomb uses to measure usage. For normal application telemetry, an event represents a unit of work, such as handling an HTTP request.
For trace data, each span counts as one event. So if one trace has 150 spans, Honeycomb counts that as 150 events. This is why trace depth matters so much. A small app with shallow traces may stay within a lower event volume, while a busy microservice system can generate many more events from the same number of user requests.
Events sampled before reaching Honeycomb do not count against the monthly event limit. This includes events sampled through Refinery, Beelines, or other application-level sampling methods.
What this means for cost
Honeycomb can be predictable when teams understand their event volume. But costs can grow when traffic increases, traces become deeper, or teams send too much low-value telemetry. For larger environments, sampling becomes important because it reduces the number of events Honeycomb ingests and bills against the monthly limit.
Honeycomb includes 60-day fixed retention for all datasets. Retention is based on when events are ingested by Honeycomb, not the timestamp inside the event. Teams that need retention beyond 60 days must discuss that separately with Honeycomb.
Retention
Honeycomb’s standard retention is 60 days across datasets. This applies even when a team changes plans, because Honeycomb says it keeps existing data up to the 60-day retention period.
Burst protection
Honeycomb includes burst protection to help with sudden traffic spikes. If a team sends more than expected on a specific day, burst protection can stop all excess events from immediately counting against the monthly event limit. This helps protect teams from short, abnormal ingestion spikes.
Overage and throttling
Honeycomb can warn teams when usage is trending above the monthly event limit. For Free and Pro teams, repeated overages can lead to throttling if the team does not reduce usage or upgrade. This is why teams should monitor event volume closely, especially after adding new services, deeper traces, or more OpenTelemetry attributes.
Why this matters
Honeycomb’s pricing can stay predictable when event volume is understood and controlled. But teams with fast traffic growth, deep traces, or poor sampling can hit limits faster than expected. For larger environments, cost control usually depends on good instrumentation, sampling, and regular usage reviews.
What Does Honeycomb Really Cost?
The scenarios below are directional editorial estimates based on Honeycomb’s public pricing as of May 26, 2026. They are not official Honeycomb quotes. Actual cost depends on event volume, trace depth, sampling, Metrics usage, retention needs, Enterprise terms, and contract discounts.
Honeycomb cost depends mainly on how many events your team sends. In distributed tracing, each span counts as one event. So a single user request can generate many billable events if it touches several services, databases, queues, or internal functions. Honeycomb also notes that events sampled before ingestion do not count against the monthly event limit.
For these scenarios, host count is used only as a workload-size proxy. The real pricing driver is monthly event volume, which changes based on request rate, trace depth, sampling, and instrumentation choices.
| Team size | Hosts | Directional event volume |
| Small team | 10 hosts | ~22M events/day, ~660M events/month |
| Growing team | 50 hosts | ~70M events/day, ~2.1B events/month |
| Mid-market team | 250 hosts | ~310M events/day, ~9.3B events/month |
Scenario 1: Small Team, ~660M Events/Month
Situation
A small engineering team runs several production services with OpenTelemetry tracing enabled across the application, database calls, cache operations, and API requests. The team needs distributed tracing, high-cardinality debugging, SLOs, and faster incident investigation without paying per user or per host.
Why teams at this stage consider Honeycomb
Teams at this stage may evaluate Honeycomb because fixed dashboards and basic logs are no longer enough for production debugging. Honeycomb helps engineers investigate issues by service, endpoint, deployment version, customer segment, region, or trace path.
Estimated profile
| Configuration | Detail |
| Monthly event volume | ~660M events/month |
| Trace depth | Moderate-to-deep tracing |
| Sampling | Limited sampling assumed |
| Pricing basis | Public Honeycomb Pro reference rate |
Estimated monthly cost
Disclaimer: This is a directional editorial estimate based on Honeycomb’s public pricing, not an official Honeycomb quote. Actual cost depends on event volume, trace depth, sampling, retention, and plan terms.
| Component | Calculation | Monthly cost |
| Events | 660M ÷ 100M = 6.6 units | |
| Rate | 6.6 × $130 | ~$858 |
| Total estimated cost | ~$858/month |
What this scenario shows
At around 660M events/month, Honeycomb can still fit within the public Pro range. The main cost driver is event volume, not infrastructure size. Teams can reduce spend by sampling routine traffic before ingestion.
Scenario 2: Growing Team, ~2.1B Events/Month
Situation
A growing SaaS team has more production traffic, more services, and deeper traces across APIs, background jobs, databases, queues, and customer-facing workflows. As more spans are captured per request, monthly event volume rises quickly.
Why teams at this stage consider Honeycomb
Teams at this stage may consider Honeycomb because incidents often involve multiple services. Honeycomb’s high-cardinality queries and BubbleUp can help engineers identify whether an issue is tied to a specific endpoint, customer group, deployment, region, or service path.
Estimated profile
| Configuration | Detail |
| Monthly event volume | ~2.1B events/month |
| Trace depth | Deep tracing across services |
| Sampling | Limited sampling assumed |
| Pricing basis | Directional model using public Pro reference rate |
Estimated monthly cost
Disclaimer: This workload exceeds Honeycomb’s public Pro event range. The estimate below is only a directional model. Actual pricing would likely require Honeycomb Enterprise terms.
| Component | Calculation | Monthly cost |
| Events | 2.1B ÷ 100M = 21 units | |
| Rate | 21 × $130 | ~$2,730 |
| Total estimated cost | ~$2,730/month |
What this scenario shows
At around 2.1B events/month, the team moves beyond Honeycomb’s public Pro range. Refinery or another sampling strategy becomes important because reducing low-value trace volume can materially lower billable events.
Scenario 3: Mid-Market Team, ~9.3B Events/Month
Situation
A mid-market engineering team runs a large distributed application with deep OpenTelemetry tracing across many services, APIs, background workers, queues, databases, and customer workflows. The team needs fast production investigation, SLO tracking, and governance controls at scale.
Why teams at this stage consider Honeycomb
Teams at this size may evaluate Honeycomb because they need to debug complex service interactions quickly. Honeycomb helps engineers explore issues across service, customer, region, endpoint, version, and trace path instead of relying only on predefined dashboards.
Estimated profile
| Configuration | Detail |
| Monthly event volume | ~9.3B events/month |
| Trace depth | Deep tracing across many services |
| Sampling | Limited sampling assumed |
| Pricing basis | Enterprise-scale directional model |
Estimated monthly cost
Disclaimer: This workload is well above Honeycomb’s public Pro range. Honeycomb Enterprise pricing is custom, so this estimate is only a directional model based on the public Pro reference rate.
| Component | Calculation | Monthly cost |
| Events | 9.3B ÷ 100M = 93 units | |
| Rate | 93 × $130 | ~$12,090 |
| Total estimated cost | ~$12,090/month |
What this scenario shows
At mid-market scale, Honeycomb pricing becomes an Enterprise discussion. Buyers should model event volume carefully, test sampling, ask about overage terms, confirm retention needs, and compare the final quote with alternatives that offer flatter pricing or self-hosted deployment, such as CubeAPM.
What Actually Drives Honeycomb Costs?
Honeycomb pricing looks simple because it is based on events per month. But the real cost depends on how much telemetry your applications generate, how deep your traces are, and how much data is sampled before ingestion.
Event volume is the main pricing driver. Honeycomb’s pricing page lists Free at up to 20M events and Pro starting at $130 per 100M events, with Pro usage available up to 1.5B events. Enterprise uses volume-based pricing.
The more events your services send, the higher the monthly cost. This is why a busy application with fewer services can sometimes cost more than a larger but quieter environment.
In Honeycomb, each span in a distributed trace counts as one event. So a request with 10 spans creates 10 events, while a request with 100 spans creates 100 events. Honeycomb’s docs give a clear example: one trace with 150 spans counts as 150 events.
This makes trace depth a major cost factor for microservice teams. Deep traces are useful for debugging, but they also increase event volume.
Sampling is the main way to control Honeycomb cost at scale. Honeycomb says events sampled before ingestion do not count against the monthly event limit.
Refinery is Honeycomb’s trace-aware sampling proxy. It can help teams keep important traces, such as errors or slow requests, while reducing routine traffic before it reaches Honeycomb.
Honeycomb now supports metrics through Honeycomb Metrics. The current pricing page lists time-series data point allowances alongside events: Free includes 100M time-series data points, while Pro starts with 500M time-series data points and scales up to 7.5B.
This means teams using Honeycomb for both traces and infrastructure metrics should model both event volume and metrics data points.
Honeycomb docs say datasets have 60-day fixed retention. Retention is based on when Honeycomb receives the event, not the timestamp inside the event. Teams that need longer retention should verify options directly with Honeycomb.
Honeycomb can warn teams when usage trends above the monthly event limit. For Free and Pro teams, continued overages can lead to throttling if usage is not reduced or the plan is not upgraded. Honeycomb’s troubleshooting docs explain that throttling may discard 9 out of 10 spans, which can leave traces with missing spans.
Additional Costs Buyers Should Plan For
Honeycomb’s public pricing is clear at the plan level, but the total cost can still change based on instrumentation, sampling, metrics, retention, and deployment needs. These are the areas buyers should check before committing.
Honeycomb works best when teams send useful, well-structured telemetry. That usually means adding OpenTelemetry instrumentation, choosing the right span attributes, and avoiding noisy low-value events. Honeycomb counts each span in a trace as an event, so poor instrumentation can increase cost without improving debugging value.
Sampling is not just a cost feature. It needs planning. Honeycomb says events sampled before ingestion do not count against the monthly event limit, which makes sampling important for high-volume teams. But teams still need to configure sampling rules carefully so they keep important traces like errors, slow requests, and unusual behavior.
Refinery can help control event volume, but it is still something your team has to run and maintain. It adds operational work around deployment, configuration, scaling, and monitoring. For larger environments, include this effort in the total cost of ownership, not just the Honeycomb subscription.
Honeycomb now includes Honeycomb Metrics, but metrics still have plan limits. The pricing page lists up to 100M metrics data points/month on Free and up to 7.5B data points/month on Pro. Teams sending infrastructure metrics to Honeycomb should model metrics usage separately from event volume.
Honeycomb docs say datasets have 60-day fixed retention. If your team needs longer retention for compliance, audits, or long-term debugging, confirm that with Honeycomb during the buying process.
Honeycomb Private Cloud is available for teams that need stronger data control, but it can add infrastructure cost. Honeycomb’s pricing page lists Private Cloud support under Enterprise, and its docs describe Private Cloud architecture for AWS environments. Buyers should include the related cloud infrastructure and operational requirements in their budget.
Honeycomb User Reviews
Honeycomb is reviewed positively for tracing, high-cardinality debugging, and production investigation. As of May 2026, G2 shows 4.5/5 from 35 reviews, Gartner Peer Insights lists 4.7 stars from 109 reviews, and TrustRadius shows 7.2/10 from a much smaller review sample.
What Users Praise
Users often praise Honeycomb for trace investigation and application observability. A G2 reviewer described Honeycomb as the primary place their team uses for distributed trace access, while another reviewer said Honeycomb helps developers and infrastructure teams see production system behavior more clearly.
Honeycomb’s high-cardinality model is one of the most praised parts of the platform. Users value being able to explore production issues across fields such as service, endpoint, version, customer segment, and region instead of relying only on fixed dashboards. G2 reviewer feedback specifically mentions high dimensionality and high-cardinality data as part of Honeycomb’s value.
Reviewers also like Honeycomb’s query engine. One G2 reviewer said the querying engine is powerful and helps teams understand systems through correlation and anomaly detection. This lines up with Honeycomb’s product positioning around BubbleUp and exploratory debugging.
Several G2 reviews mention Honeycomb’s team and support as positives. One reviewer said Honeycomb’s team is “amazing to work with,” while another said the team is highly engaged and acts like a partner during observability adoption.
What Users Criticize
The following points reflect user-review and market-feedback themes. They should be treated as buyer feedback, not universal product limitations.
Cost can rise without sampling
Cost is one of the clearest user concerns. A G2 reviewer said adding all infrastructure events to Honeycomb can become expensive without sampling. This fits Honeycomb’s event-based pricing model because each ingested span counts as an event, so large trace volumes can increase spend quickly.
Learning curve for new teams
Honeycomb can require a mindset shift for teams used to classic dashboards and log-first monitoring. Its value comes from asking exploratory questions over rich event data, which means teams need to learn how to instrument well, query well, and use high-cardinality fields correctly.
SLO visualization limits
One G2 reviewer praised Honeycomb’s query engine but said they wanted better SLO visualization, especially the ability to view multiple budget burns across SLOs in a custom time frame.
Summary Rating Breakdown, May 2026
| Platform | Rating |
| G2 | 4.5/5 from 35 verified reviews |
| Gartner Peer Insights | 4.7 stars from 109 reviews |
| TrustRadius | 7.2/10 from 2 reviews and ratings |
| Capterra / Software Advice | Useful for supporting review signals, but verify the live listing before citing |
| Use only as anecdotal feedback from specific threads |
Honeycomb Alternatives: How It Compares to Competitors
Honeycomb is strongest for high-cardinality debugging, distributed tracing, and event-based incident investigation. But it is not always the best fit for every team. Some buyers may need broader infrastructure monitoring, stronger log management, self-hosted deployment, security features, or a different pricing model.
Honeycomb vs CubeAPM
Honeycomb is a SaaS observability platform focused on event-based debugging and trace investigation. CubeAPM is a managed, self-hosted observability platform built for teams that want APM, logs, infrastructure monitoring, RUM, synthetics, error tracking, Kubernetes monitoring, and telemetry control inside their own cloud or data center. CubeAPM’s official site says APM and log data do not leave the customer cloud.
| Category | Honeycomb | CubeAPM |
| Deployment | SaaS; AWS Private Cloud | Self-hosted, managed |
| Pricing model | Events per month | Per-GB model |
| Main strength | Trace investigation | Full-stack observability |
| Data control | SaaS by default | Data stays in customer cloud |
| Best for | Deep debugging | Compliance and cost control |
Honeycomb vs Datadog
Datadog is broader than Honeycomb. It covers infrastructure monitoring, APM, logs, RUM, synthetics, security, network monitoring, and many other products. Datadog’s pricing is also more modular, with separate billing units across products; its official pricing list shows examples such as Infrastructure Pro at $15 per host/month and many product-specific charges. Honeycomb is narrower but more focused on high-cardinality investigation and event-based debugging.
| Category | Honeycomb | Datadog |
| Deployment | SaaS; AWS Private Cloud | SaaS |
| Pricing model | Events per month | Multiple product meters |
| Main strength | Debugging depth | Platform breadth |
| Cost risk | High event volume | Add-ons and modules |
| Best for | Engineering investigation | All-in-one monitoring |
Honeycomb vs Grafana Cloud
Grafana Cloud is a better fit for teams already using Grafana, Prometheus, Loki, Tempo, and the open-source observability ecosystem. Its pricing is usage-based across signals, including metrics by billable series, logs/traces by GB, and visualization by monthly active users. Honeycomb is more opinionated around exploratory trace and event investigation, while Grafana Cloud is stronger for dashboard-heavy teams that want open-source-compatible workflows.
| Category | Honeycomb | Grafana Cloud |
| Deployment | SaaS; AWS Private Cloud | SaaS |
| Pricing model | Events per month | Usage by signal |
| Main strength | Trace debugging | Dashboards and OSS stack |
| Query style | Guided exploration | PromQL, LogQL, TraceQL |
| Best for | High-cardinality issues | Grafana/Prometheus teams |
Honeycomb vs New Relic
New Relic is a broad full-stack observability platform covering APM, infrastructure, logs, RUM, synthetics, and many other capabilities. Its pricing combines data ingest with user-based pricing; New Relic’s official pricing page lists 100GB/month of free data ingest, while its docs say data is billed by GB ingested after the free allowance. Honeycomb is simpler to understand for trace-heavy teams because it prices mainly around events, not user seats.
| Category | Honeycomb | New Relic |
| Deployment | SaaS; AWS Private Cloud | SaaS |
| Pricing model | Events per month | Data ingest + users |
| Main strength | Trace investigation | Full-stack coverage |
| Setup style | Instrumentation-led | Easier out of box |
| Best for | Complex debugging | Broad observability |
Honeycomb vs Coralogix
Coralogix is stronger for teams with heavy logs, long retention needs, and cost control across logs, traces, and metrics. Its official pricing lists logs at $0.42/GB, traces at $0.16/GB, and metrics at $0.05/GB, with data stored in the customer’s bucket. Honeycomb is stronger for engineering teams that need high-cardinality trace analysis and exploratory debugging rather than log-heavy observability.
| Category | Honeycomb | Coralogix |
| Deployment | SaaS; AWS Private Cloud | SaaS with customer storage |
| Pricing model | Events per month | Per GB by signal |
| Main strength | Trace debugging | Log cost control |
| Security fit | Not SIEM-first | Stronger security focus |
| Best for | Distributed systems | Logs and retention |
Is Honeycomb the Right Choice?
Honeycomb Works Best For
Honeycomb is strongest when production issues cross service boundaries and cannot be solved through static dashboards alone.
Honeycomb’s OpenTelemetry support makes it a natural fit for teams standardizing on OTel instrumentation.
Honeycomb’s event model is built for asking new questions during incidents instead of relying only on predefined metrics.
Canvas, MCP, and Honeycomb Intelligence make Honeycomb relevant for teams experimenting with AI-assisted production investigation.
Honeycomb May Not Be the Best Fit For
Honeycomb Private Cloud helps with AWS-based deployment needs, but teams that need self-hosting across other environments may prefer platforms such as CubeAPM or SigNoz.
Honeycomb now supports Metrics, but teams looking mainly for standard dashboards, host monitoring, and prebuilt infrastructure views may find Datadog, Grafana Cloud, New Relic, or CubeAPM easier to evaluate.
Honeycomb is not a SIEM. Teams that need security observability should evaluate platforms with dedicated SIEM or security modules.
Conclusion
Honeycomb.io is a strong observability platform for teams that care deeply about production debugging. Its event-based model, high-cardinality queries, BubbleUp, OpenTelemetry support, Refinery sampling, Canvas AI Copilot, Honeycomb MCP, and Metrics support make it a serious option for engineering teams running complex distributed systems.
Its pricing is also easier to understand than many host-based platforms because the main unit is events per month. Free includes up to 20M events/month, and Pro starts at $130/month, with public pricing references for $130 / 100M events up to 1.5B events/month.
The main caution is scale. Since every span counts as an event, Honeycomb cost can rise quickly in deeply instrumented environments. Teams should model trace depth, request volume, sampling strategy, Metrics usage, and retention needs before committing.
For teams that want deep engineering investigation and are comfortable with event-based pricing, Honeycomb is worth shortlisting. For teams that care more about full data control, self-hosted deployment, and simpler flat per-GB pricing, CubeAPM is a strong alternative to evaluate alongside Honeycomb.
FAQs
1. How much does Honeycomb cost in 2026?
Honeycomb’s Free plan includes up to 20M events/month. Pro starts at $130/month and supports up to 1.5B events/month. Honeycomb also lists Pro pricing as starting at $130 / 100M events. Enterprise pricing is custom.
2. How does Honeycomb count events?
Honeycomb counts each span in a distributed trace as one event. A trace with 150 spans counts as 150 events.
3. Does Honeycomb charge per user?
Honeycomb’s pricing page lists unlimited seats and unlimited querying. Its main pricing model is based on event volume, not per-user pricing.
4. Does Honeycomb support private cloud deployment?
Yes. Honeycomb Private Cloud runs Honeycomb in the customer’s cloud account and is focused on AWS environments.
5. What is the best Honeycomb alternative?
CubeAPM is a strong Honeycomb alternative for teams that want self-hosted, vendor-managed observability with telemetry kept inside their own infrastructure. Datadog, New Relic, Grafana Cloud, and Coralogix are also strong alternatives depending on the team’s needs.