










Azure DevOps pipelines automate build, test, and deployment workflows across thousands of engineering teams. When a pipeline fails, the impact spreads fast: blocked deployments, delayed releases, developers context-switching to debug infrastructure instead of shipping features. According to the 2024 State of DevOps Report, elite DevOps teams deploy 973 times more frequently than low performers, but that velocity collapses the moment pipeline reliability drops. Monitoring build and release failures is how teams maintain that velocity at scale.
This guide covers what Azure DevOps pipeline monitoring is, how build and release failures happen, what signals to track, and how to set up monitoring that catches issues before they block production deployments. By the end, you will know how to instrument pipelines for visibility, diagnose failure root causes faster, and reduce mean time to recovery when pipelines break.
What Is Azure DevOps Pipeline Monitoring?
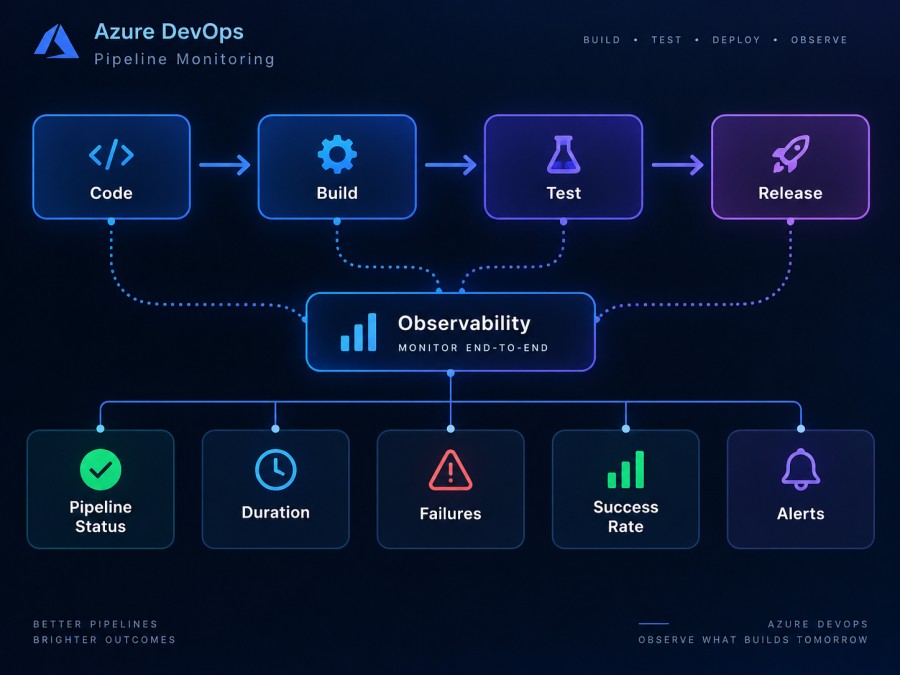
Azure DevOps pipeline monitoring is the practice of tracking pipeline execution status, performance, and failure patterns in real time to detect issues early, diagnose root causes quickly, and maintain reliable CI/CD workflows.
Pipelines orchestrate multiple moving parts: agent pools, source control, build tasks, test suites, artifact storage, deployment environments, and external dependencies like package registries or cloud APIs. A failure in any layer can block the entire delivery chain. Monitoring gives teams visibility into which layer failed, why it failed, and how often similar failures occur.
Without monitoring, pipeline failures surface only when a developer checks the pipeline UI or when a deployment deadline is missed. With monitoring, alerts fire the moment a build fails, logs are automatically collected, and teams have the context needed to fix the issue within minutes instead of hours.
Azure DevOps includes built-in analytics for pipeline pass rates, duration trends, and task-level failures. But most teams outgrow these basic views as pipeline complexity increases. Production-grade monitoring requires correlation between pipeline events and the infrastructure, application logs, and deployment targets those pipelines touch.
Why Build and Release Failures Happen in Azure DevOps
Build and release failures in Azure DevOps pipelines stem from six common failure modes. Understanding these patterns helps teams design monitoring that catches the right signals.
Agent availability and resource exhaustion
Pipelines run on agents, either Microsoft-hosted or self-hosted. When agents are offline, busy, or running out of disk space, jobs queue indefinitely or fail with resource errors. Microsoft-hosted agents have a 60-minute timeout for private repositories and 360 minutes for public repositories. Self-hosted agents have no default timeout unless explicitly configured via timeoutInMinutes in the pipeline YAML.
A pipeline failing with “No agent could be found with the following capabilities” means the agent pool lacks an agent that matches the job’s demands. A pipeline hanging at the queue stage for 10+ minutes usually means all agents are busy or the pool is under-provisioned for current workload.
Flaky tests and test infrastructure failures
Test failures account for a large share of pipeline failures, but not all test failures are real bugs. Flaky tests, tests that pass or fail inconsistently without code changes, create noise and erode trust in CI. Azure DevOps pipeline analytics surfaces flaky test trends, but only if test results are published using the PublishTestResults task.
Test infrastructure failures are different. These occur when the test environment itself fails: database connection timeouts, external API unavailability, or Kubernetes test pods stuck in CrashLoopBackOff. These failures look like test failures in the pipeline UI, but the root cause is infrastructure, not code.
Dependency resolution failures
Pipelines pull dependencies from NuGet, npm, Maven, PyPI, or private artifact feeds. When a package version is unavailable, a feed is unreachable, or credentials expire, dependency resolution fails early in the build. The error message often appears in the build log as “Could not resolve package” or “401 Unauthorized” when accessing a private feed.
Azure DevOps artifact feeds have their own availability and rate limits. If a pipeline is configured to restore packages from an upstream source like npmjs.org and that source is down, the pipeline fails even if the Azure DevOps infrastructure is healthy.
Deployment target unavailability
Release pipelines deploy to environments: Azure App Services, Kubernetes clusters, VMs, or third-party platforms. When a deployment target is unreachable, misconfigured, or lacks capacity, the release fails at the deployment stage. Common causes include expired service principals, incorrect firewall rules, Kubernetes clusters at node capacity, or App Service slots that are stopped.
Azure DevOps displays these as deployment task failures, but the actual fix requires changes outside Azure DevOps: rotating credentials, scaling infrastructure, or opening network paths.
Timeout failures
Pipelines have multiple timeout layers: job timeout, step timeout, and agent timeout. The default job timeout is 60 minutes for Microsoft-hosted agents. If a build step runs longer than expected, due to slow network, large artifact uploads, or inefficient build scripts, the job times out and fails.
Timeout failures are often misdiagnosed as infrastructure problems when the real issue is inefficient pipeline design: lack of caching, redundant dependency restores, or missing parallelization in test execution.
Pipeline permission and authorization issues
Azure DevOps enforces authorization at multiple levels: repository access, service connection permissions, agent pool permissions, and environment approvals. A pipeline failing with “This pipeline needs permission to access a resource before this run can continue” means the pipeline lacks explicit authorization to use a service connection, agent pool, or protected environment.
This happens most often after a new service connection is created or when pipelines are moved to a new project. The fix requires manually authorizing the pipeline via the Azure DevOps UI or configuring open access on the resource.
What to Monitor in Azure DevOps Pipelines
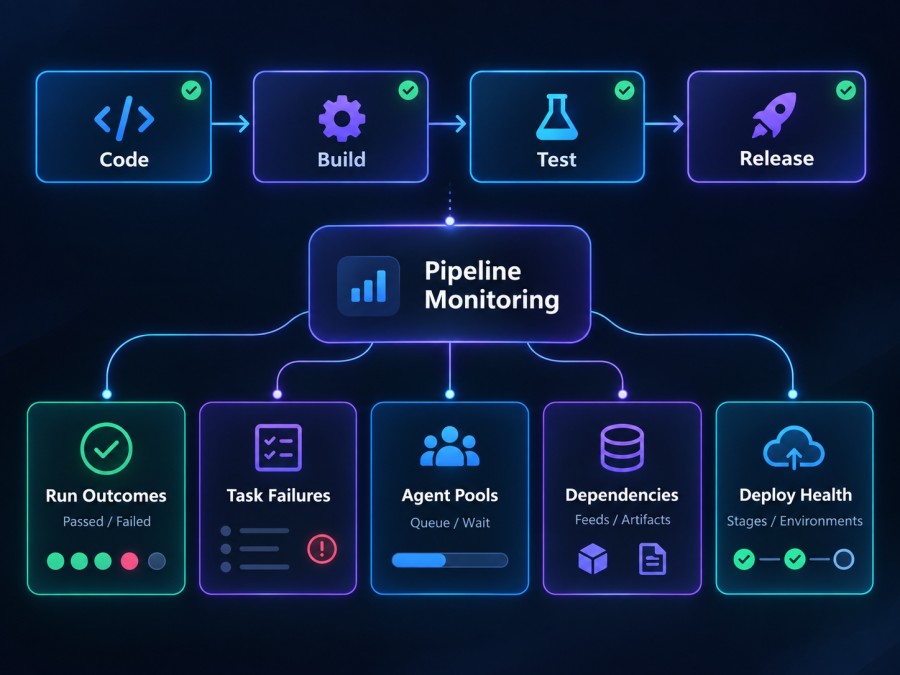
Effective pipeline monitoring tracks five signal categories: execution outcomes, task-level failures, agent health, dependency resolution, and deployment success. Each category requires specific metrics and alerts.
Pipeline execution outcomes
Track the pass rate, failure rate, and cancellation rate of each pipeline over a rolling 7 day or 30-day window. A sudden drop in pass rate below 80% indicates a systemic issue, either in the pipeline logic, infrastructure, or external dependencies.
Azure DevOps pipeline analytics provides this data natively under the Analytics tab for each pipeline. The report shows failure trends by stage, making it easy to identify whether failures cluster in build, test, or deployment stages.
Monitor pipeline duration alongside pass rate. A pipeline that suddenly takes 2x longer to complete, even when passing, signals a performance regression: slower agents, network issues, or inefficient caching.
Task-level failure attribution
When a pipeline fails, the root cause is always a specific task: NuGetCommand, DotNetCoreCLI, Kubernetes, PublishTestResults, or a custom script. Monitoring should aggregate task failure counts across all pipelines to surface which tasks fail most often.
Azure DevOps pipeline reports include a “Top failing tasks and their failed runs” section under the pass rate report. This list shows task name, failure count, and links to failed runs. Use this to prioritize fixes: if the same task fails across 10 pipelines, the issue is likely a shared dependency or configuration problem, not pipeline-specific logic.
Agent pool health and job wait time
Agent pool monitoring tracks three metrics: number of agents online, number of agents busy, and job wait time. Job wait time is the duration between a job entering the queue and starting execution on an agent. Wait times above 5 minutes indicate under-provisioned agent pools or agents stuck in a busy state.
For self-hosted agents, monitor agent status via the Azure DevOps REST API or by scraping the agent pool page. An agent that shows “Offline” requires investigation: the agent service may have crashed, network connectivity to Azure DevOps may be lost, or the host machine may be out of resources.
Microsoft-hosted agents do not surface wait time metrics as clearly because the agent pool is shared across all Azure DevOps organizations. If Microsoft-hosted pipelines are queuing longer than normal, check the Azure DevOps service status page for incidents affecting hosted agents.
Dependency resolution and artifact feed health
Track the success rate of dependency restore tasks: NuGetCommand@2, npm install, Maven, DotNetCoreCLI restore. A failure in these tasks blocks the entire pipeline. Monitor the HTTP response codes returned by artifact feeds: 401 errors indicate expired credentials, 404 errors indicate missing packages, and 503 errors indicate feed unavailability.
If your pipelines use Azure Artifacts feeds, monitor feed storage quota usage. Feeds have storage limits based on your Azure DevOps plan. When a feed reaches its quota, new artifact pushes fail, breaking pipelines that publish build outputs.
Deployment stage success and environment health
Release pipelines deploy to environments: Dev, QA, Staging, Production. Monitor deployment success rate per environment and per deployment task. A deployment task that succeeds in Dev but fails in Production 40% of the time indicates environment-specific configuration drift.
Track deployment duration alongside success rate. A deployment that normally completes in 3 minutes but suddenly takes 15 minutes suggests infrastructure saturation: Kubernetes cluster node pressure, App Service cold starts, or database connection pool exhaustion.
For Kubernetes deployments, correlate Azure DevOps deployment failures with Kubernetes events and pod status. A deployment marked as successful in Azure DevOps but showing CrashLoopBackOff pods in the cluster means the deployment task succeeded but the deployed application failed post-deployment health checks.
How to Set Up Azure DevOps Pipeline Monitoring
Setting up pipeline monitoring involves native Azure DevOps tools, REST API integrations, and external observability platforms. The approach depends on team size, pipeline complexity, and integration requirements.
Using Azure DevOps built-in analytics
Azure DevOps provides pipeline analytics under the Analytics tab for each pipeline. This includes a pass rate report, test pass rate report, and pipeline duration report. These reports aggregate data over the last 7, 14, 30, or 180 days and can be filtered by branch.
The pass rate report shows failure trends by day and lists the top failing tasks with links to failed runs. Use this as a starting point to identify chronic pipeline issues. The duration report shows the top 10 tasks by duration, helping you spot inefficient steps that slow down the entire pipeline.
For centralized visibility across multiple pipelines, create a custom dashboard in Azure DevOps under Overview > Dashboards. Add widgets for build history, deployment status, and release pipeline overview. The Build History widget displays a histogram of recent builds color-coded by success or failure. The Deployment Status widget shows deployment pass rates across multiple environments.
Configuring pipeline failure notifications
Azure DevOps includes built-in notifications for pipeline events. Navigate to Project Settings > Notifications to configure team-wide notifications. Select “A build fails” to receive an email or service hook notification every time a build fails.
For granular control, create personal notifications under User Settings > Notifications. You can configure notifications for specific pipelines, branches, or failure conditions: build fails, build succeeds after failing, or build duration exceeds threshold.
Service hooks integrate Azure DevOps notifications with external systems. Navigate to Project Settings > Service Hooks and create a new subscription for Web Hooks, Slack, Microsoft Teams, or custom HTTP endpoints. When a pipeline fails, Azure DevOps posts the failure details to the configured endpoint, enabling real-time alerts in your team’s communication tool.
Monitoring pipelines via Azure DevOps REST API
The Azure DevOps REST API provides programmatic access to pipeline run data, enabling custom monitoring dashboards and alert logic. The Pipelines Runs API returns a list of pipeline runs with status, result, start time, and finish time.
Example API call to list recent runs for a pipeline:
GET https://dev.azure.com/{organization}/{project}/_apis/pipelines/{pipelineId}/runs?api-version=7.1Response includes run ID, state (inProgress, completed), result (succeeded, failed, canceled), and links to logs. Use this data to build custom dashboards, track failure rates over time, or trigger alerts based on failure patterns.
For task-level failure attribution, use the Timeline API to retrieve the execution timeline for a specific build. The timeline includes every task, its result, start time, and error messages. Parse this data to identify which tasks fail most often across your pipeline portfolio.
Integrating with external observability platforms
Azure DevOps monitoring becomes more powerful when pipeline telemetry is correlated with application logs, infrastructure metrics, and deployment targets. Infrastructure monitoring platforms ingest pipeline events as structured logs or traces, enabling queries like “show all pipeline failures that occurred within 10 minutes of a Kubernetes node going NotReady.”
Most observability platforms support Azure DevOps integration via service hooks or custom exporters. Configure a Webhook service hook in Azure DevOps to POST pipeline events to an HTTP endpoint managed by your observability tool. Include pipeline name, run ID, result, duration, and branch in the payload.
For teams running pipelines at scale, exporting pipeline run data to a centralized data store (Azure Data Explorer, ClickHouse, or Elasticsearch) enables long term trend analysis and failure pattern detection that native Azure DevOps analytics cannot provide.
Monitoring self-hosted agents
Self-hosted agents require dedicated monitoring because agent failures directly cause pipeline failures. Monitor agent process health, disk space, CPU usage, and network connectivity to Azure DevOps.
Each self-hosted agent runs a service on the host machine. On Linux, the service is vsts.agent.{organization}.{agent-name}.service. On Windows, it appears in the Services console as “Azure Pipelines Agent.” Monitor this service to ensure it stays in a running state. If the service stops, the agent goes offline and pipelines queue indefinitely.
Disk space exhaustion is a common cause of agent failures. Build outputs, test artifacts, and dependency caches accumulate in the agent’s _work directory. Monitor disk usage and configure pipeline cleanup policies to delete old build directories after each run. Azure DevOps supports workspace cleanup via the clean option in the checkout step.
Network connectivity between the agent and Azure DevOps is critical. Agents poll Azure DevOps every few seconds to check for new jobs. If the agent cannot reach dev.azure.com due to firewall rules, proxy misconfigurations, or DNS failures, the agent goes offline. Monitor outbound HTTPS connectivity from agent hosts to Azure DevOps endpoints.
Diagnosing Pipeline Failures Faster
When a pipeline fails, diagnosis speed determines how fast the team recovers. Effective diagnosis requires structured log analysis, task-level error identification, and correlation with external system state.
Reading pipeline logs effectively
Azure DevOps logs every task’s stdout and stderr in the pipeline run summary. Click the failed task to view its log output. Errors appear highlighted in red. Common error patterns include:
Error: Could not find a part of the pathindicates missing files or an incorrect working directory401 Unauthorizedindicates expired credentials or incorrect service connection configurationThe remote name could not be resolvedindicates DNS or network connectivity failureerror MSB1009: Project file does not existindicates an incorrect path in the build taskTask <task-name> failed with exit code 1indicates the task’s underlying command failed; check the command’s own error output above this message
For verbose logs, enable system diagnostics by setting system.debug to true in the pipeline variables. This outputs additional diagnostic information from Azure DevOps agents, helping identify issues with agent configuration or task execution environment.
Using the Azure DevOps error analysis page
Azure DevOps includes an error analysis page accessible from the pipeline run summary. Hover over the error line and select the View analysis icon. The analysis page shows:
- Run time details: when the task started, how long it ran, and what error code it returned
- Agent information: agent name, pool, OS, and capabilities
- Task documentation: link to the task’s official documentation
- Related runs: links to recent runs of the same pipeline for comparison
This page consolidates context needed for diagnosis without switching between multiple tabs. Use it as the first stop when investigating a failure.
Correlating pipeline failures with infrastructure events
Pipeline failures often correlate with infrastructure changes or incidents. A deployment pipeline that fails at 2:15 PM may coincide with a Kubernetes node going NotReady at 2:10 PM. Without correlation, teams waste time debugging the pipeline logic when the issue is infrastructure.
Integrate pipeline run events with your infrastructure monitoring system to enable time-based correlation. When a pipeline fails, query your infrastructure logs for events in the same time window: node failures, pod restarts, disk pressure, or network errors. Tools like CubeAPM, Datadog, or Grafana support this correlation natively by ingesting pipeline telemetry alongside infrastructure metrics.
Tools for Azure DevOps Pipeline Monitoring
Azure DevOps native tools provide basic pipeline monitoring, but most teams augment these with external platforms for deeper visibility, alerting, and long-term trend analysis.
Azure DevOps native analytics
Azure DevOps pipeline analytics, available under the Analytics tab, tracks pass rate, test pass rate, and duration trends. These reports are useful for identifying chronic issues and measuring improvement over time. The reports filter by branch, making it easy to compare main branch stability versus feature branch pass rates.
Dashboards in Azure DevOps aggregate widgets for build history, deployment status, and release pipeline health. Create a dedicated dashboard for each team or project and pin it to a shared monitor in the team area. This passive visibility helps teams notice failure trends without actively checking pipeline status.
CubeAPM
CubeAPM provides full-stack observability for applications, infrastructure, and CI/CD pipelines, including Azure DevOps. It runs on your infrastructure, giving you complete data control with no telemetry leaving your cloud. Pipeline run events from Azure DevOps are ingested as structured logs or traces, enabling correlation with application logs, infrastructure metrics, and Kubernetes events.
Set up monitoring by configuring an Azure DevOps service hook to POST pipeline events to CubeAPM’s HTTP endpoint. Each pipeline run generates a trace span with attributes like pipeline name, run ID, result, duration, and branch. Query pipeline failures using CubeAPM’s trace search and correlate them with infrastructure events like Kubernetes node NotReady conditions or database connection spikes.
CubeAPM’s alerting engine supports anomaly detection on pipeline duration and failure rate. Define alerts that fire when pipeline pass rate drops below 80% over a 1-hour window or when a specific task fails more than 3 times in 30 minutes. Alerts route to Slack, PagerDuty, or email with full context: failed task name, error message, and links to logs.
Pricing is $0.20/GB for all data ingested, with unlimited retention and no per-user fees. Self-hosted deployment means no public cloud egress costs. For teams running hundreds of pipelines generating gigabytes of telemetry daily, this flat pricing model avoids the cost explosions common with SaaS APM platforms.
Datadog
Datadog supports Azure DevOps integration via its CI Visibility product, which ingests pipeline run data and correlates it with application and infrastructure telemetry. Configure the Azure DevOps integration by installing the Datadog agent on self-hosted build agents or using API based ingestion for Microsoft-hosted agents.
Datadog surfaces pipeline pass rates, duration trends, and failure attribution in pre-built dashboards. Alerts fire when pipeline failure rates exceed thresholds. The platform correlates pipeline failures with APM traces from deployed applications, making it easier to identify whether a deployment caused a production incident.
Pricing starts at $15/month per pipeline for CI Visibility, in addition to infrastructure and APM costs. For teams already using Datadog for application monitoring, adding CI Visibility integrates pipeline health into the same observability platform.
Grafana and Prometheus
Grafana and Prometheus are commonly used together for Azure DevOps pipeline monitoring when teams need open-source flexibility. Export pipeline run data from Azure DevOps via REST API or service hooks to a custom exporter that publishes metrics to Prometheus. Common metrics include azdo_pipeline_runs_total, azdo_pipeline_failures_total, and azdo_pipeline_duration_seconds.
Grafana dashboards visualize these metrics alongside infrastructure data from Kubernetes, VMs, or cloud services. Alerting rules in Prometheus fire when pipeline failure rates exceed defined thresholds. This approach requires building and maintaining the exporter and metrics pipeline, but offers full control over data retention and query logic.
For teams already invested in the Prometheus and Grafana ecosystem, this is the lowest cost option. For teams new to observability, the setup and maintenance overhead is significant compared to managed platforms.
Splunk
Splunk ingests Azure DevOps pipeline data via HTTP Event Collector or the Splunk Add-on for Azure DevOps. Pipeline run logs, task results, and agent telemetry are indexed in Splunk, enabling full text search and anomaly detection.
Splunk excels at log aggregation and SIEM use cases, making it a strong choice for organizations that already use Splunk for security and compliance logging. Pipeline monitoring becomes a natural extension of existing Splunk infrastructure.
Pricing is based on data ingestion volume, starting at approximately $150/GB/year for Splunk Cloud. For pipeline monitoring alone, Splunk’s cost model is expensive compared to alternatives, but for teams already licensed for Splunk, incremental cost is low.
Best Practices for Reducing Pipeline Failures
Reducing pipeline failure rates requires intentional design: efficient caching, agent capacity planning, flaky test isolation, and proactive timeout configuration.
Implement dependency caching
Dependency restore tasks (npm install, NuGet restore, Maven) are slow and failure-prone when packages are downloaded from external registries every run. Azure DevOps supports pipeline caching to reuse dependencies across runs.
Add a Cache@2 task before the restore step to cache node_modules, .nuget/packages, or Maven .m2 directories. Cache hits skip the restore step entirely, reducing pipeline duration by 30 to 50% and eliminating failures caused by transient registry unavailability.
Scale agent pools proactively
Under-provisioned agent pools cause job queue times to spike, delaying feedback and frustrating developers. Monitor job wait time and agent utilization weekly. If wait times consistently exceed 2 minutes or agent utilization stays above 80%, add more agents to the pool.
For self-hosted agents, automate agent provisioning using infrastructure as code: Terraform, ARM templates, or Ansible. Scale agent count based on pipeline run frequency and expected concurrency during peak hours.
For Microsoft-hosted agents, consider purchasing additional parallel jobs if your organization frequently hits the concurrency limit. The free tier includes 1 parallel job with a 60-minute timeout. Paid plans start at $40/month for 1 additional parallel job.
Isolate flaky tests
Flaky tests erode trust in CI and cause unnecessary pipeline failures. Azure DevOps test analytics surfaces flaky test trends under the Test Pass Rate report. Identify tests that fail intermittently and either fix the underlying race condition or isolate them into a separate test suite that runs outside the critical path.
Mark flaky tests with a [Flaky] attribute or custom tag, then configure the test task to allow failures in that category without failing the pipeline. This keeps the main pipeline stable while giving teams time to fix flaky tests without blocking deployments.
Configure appropriate timeouts
Pipeline jobs have default timeouts, but these defaults do not fit every workload. A build that restores 2 GB of dependencies or runs 10,000 tests needs a longer timeout than a simple linting job. Set timeoutInMinutes explicitly at the job level:
jobs:
- job: Build
  timeoutInMinutes: 90
  steps:
- script: dotnet buildFor tasks that interact with external systems (deployments, API calls), set task level timeouts to fail fast instead of waiting for the job timeout:
- task: AzureCLI@2
  timeoutInMinutes: 10
  inputs:
    azureSubscription: 'my-subscription'
    scriptType: 'bash'
    scriptLocation: 'inlineScript'
inlineScript: 'az webapp restart --name myapp --resource-group myrg'This prevents a single hanging task from blocking the agent for the full job timeout.
Use pipeline templates for consistency
Pipeline YAML sprawl creates maintenance burden and increases failure risk. Common tasks (dependency restore, unit tests, security scans) get copied across pipelines, and when a shared dependency changes, every pipeline breaks.
Use Azure DevOps pipeline templates to centralize shared logic. Define templates for build, test, and deploy stages, then reference them from individual pipelines:
trigger:
- main
resources:
  repositories:
  - repository: templates
    type: git
    name: MyProject/pipeline-templates
stages:
- template: templates/build-template.yml@templates
- template: templates/test-template.yml@templatesWhen a template changes, all pipelines using it inherit the change automatically. This reduces duplication and ensures fixes apply consistently across the entire pipeline portfolio.
Conclusion
Azure DevOps pipeline monitoring transforms reactive firefighting into proactive reliability engineering. By tracking execution outcomes, task-level failures, agent health, and deployment success, teams catch issues early, diagnose root causes faster, and maintain high-velocity CI/CD workflows even as complexity scales.
Effective monitoring requires more than Azure DevOps native analytics. Integrating pipeline telemetry with infrastructure monitoring, application logs, and deployment targets gives teams the full context needed to resolve failures in minutes instead of hours. Tools like CubeAPM provide that unified visibility while keeping telemetry data inside your infrastructure, avoiding the cost and compliance challenges of SaaS only platforms.
Start by enabling Azure DevOps pipeline analytics, configuring failure notifications, and monitoring agent pool health. As pipelines grow in number and complexity, integrate with external observability platforms to correlate pipeline failures with the infrastructure and applications they deploy.
Disclaimer: The information in this article reflects the latest details available at the time of publication and may change as technologies and products evolve. Features, pricing, and plan limits can change over time. Always verify the latest information directly with the vendor before making purchasing or deployment decisions.
Frequently Asked Questions
How do I troubleshoot Azure DevOps pipeline failures?
Start by viewing the failed task’s log output in the pipeline run summary. Look for error messages, exit codes, and preceding warnings. Use the error analysis page to see agent details and task documentation. If the error is unclear, enable verbose logging by setting system.debug to true in pipeline variables, then rerun the pipeline.
What causes Azure DevOps pipelines to fail with permission errors?
Permission errors occur when the pipeline lacks authorization to access a resource like a service connection, agent pool, or protected environment. Navigate to the resource settings in Azure DevOps and explicitly authorize the pipeline under the Security or Permissions tab. Alternatively, enable open access for the resource if your organization policy allows it.
How do I monitor self-hosted Azure DevOps agents?
Monitor agent service health, disk space, CPU usage, and network connectivity to Azure DevOps. Check that the agent service is running, the agent shows online in the agent pool, and the host has sufficient disk space in the agent work directory. Use Azure DevOps REST API to programmatically query agent status and integrate with infrastructure monitoring tools.
How do I reduce Azure DevOps pipeline execution time?
Enable dependency caching using the Cache task to reuse restored packages across runs. Parallelize test execution by splitting tests into multiple jobs. Remove unnecessary tasks and consolidate redundant dependency restores. Use Microsoft-hosted agents with sufficient compute resources or scale self-hosted agent pools to reduce queue wait time.
What is the best way to get alerted when Azure DevOps pipelines fail?
Configure built-in notifications under Project Settings Notifications to receive email alerts when builds fail. For real time alerts, create a service hook that posts failure events to Slack, Microsoft Teams, or a custom webhook endpoint. For advanced alerting with anomaly detection, integrate pipeline telemetry with an observability platform like CubeAPM or Datadog.
How do I correlate Azure DevOps pipeline failures with infrastructure issues?
Export pipeline run events to your infrastructure monitoring system using service hooks or REST API integrations. When a pipeline fails, query infrastructure logs for events in the same time window such as Kubernetes node failures, database connection spikes, or VM disk pressure. Tools that ingest both pipeline and infrastructure telemetry enable automatic correlation.
Why do Azure DevOps pipelines fail with timeout errors?
Pipelines fail with timeout errors when a job or task runs longer than the configured timeout limit. Microsoft-hosted agents have a default 60 minute job timeout for private repositories. Check the pipeline YAML for explicit timeoutInMinutes settings and increase them if the workload requires longer execution. For tasks that interact with external systems, set task level timeouts to fail fast.