










Apache Spark Streaming processes data in micro-batches measured in seconds, not minutes. When a Spark Streaming job slows down or fails mid-stream, the impact cascades fast. A delayed batch can trigger backpressure, stall downstream consumers, and force manual intervention during peak traffic. Without real-time visibility into batch processing times, task failures, and executor resource saturation, most teams only discover problems after user-facing services start timing out.
According to the 2024 CNCF Survey, 71% of organizations use streaming data in production, yet most rely on Spark UI and basic JMX metrics that surface symptoms but not root causes. This guide compares 9 Spark Streaming monitoring tools across deployment model, cost structure, metric granularity, and how well they surface the specific signals Spark jobs generate: batch scheduling delay, task deserialization time, shuffle read/write bottlenecks, and executor GC pressure.
Quick Comparison: 9 Spark Streaming Monitoring Tools at a Glance
| Tool | Best For | Pricing Model | Deployment | Spark-Native Metrics |
|---|---|---|---|---|
| CubeAPM | Self-hosted teams, unified observability | $0.20/GB ingested | On-prem/VPC | Full via OTel/Prometheus |
| Datadog | Multi-cloud enterprises, breadth | $15–$31/host + APM fees | SaaS only | Strong via agent |
| Dynatrace | AI-assisted root cause, enterprise | $50/vCPU core/mo+ | SaaS + on-prem | Strong via OneAgent |
| New Relic | Managed platform, broad integrations | $0.40/GB + per-user fees | SaaS only | Good via agent |
| Grafana + Prometheus | OSS-first teams, custom dashboards | Free OSS / Grafana Cloud usage-based | Self-hosted/Cloud | Excellent via JMX exporter |
| Elastic APM | ELK stack users, log correlation | Free OSS / $99/mo hosted | Self-hosted/Cloud | Good via Metricbeat |
| AppDynamics | Cisco-heavy enterprises, business metrics | $50/vCPU core/mo+ | SaaS + on-prem | Good via Java agent |
| Instana | Auto-discovery, microservices | Host-based | SaaS + on-prem | Good via agent |
| Apache Spark UI | Built-in debugging, dev/test | Free | Included with Spark | Native but limited |
Pricing based on public rate cards, early 2026. Enterprise discounts and negotiated rates not reflected.
1. CubeAPM
Best for: Teams that want unified Spark metrics, logs, and traces in one self-hosted platform with predictable ingestion-based pricing and no data egress.
CubeAPM is an OpenTelemetry-native observability platform that runs inside your VPC or on-prem. For Spark Streaming, it ingests metrics via Prometheus exporters or OpenTelemetry collectors, correlates them with application traces and logs, and surfaces job-level, stage-level, and executor-level visibility in a single dashboard. Because it deploys on your infrastructure, there are no public cloud egress fees when pulling metrics from Spark clusters running in AWS, GCP, or Azure.
Key Features:
- Native support for Prometheus JMX exporter metrics from Spark
- Correlates Spark metrics with distributed traces and application logs
- Unlimited retention with no per-metric or per-host fees
- Self-hosted deployment keeps Spark telemetry inside your network
- Pre-built dashboards for batch delay, task failures, and executor resource usage
Pricing: $0.20/GB ingested across all telemetry types. A Spark cluster generating 500GB of metrics, logs, and traces monthly costs ~$80/month. No per-host or per-user fees. View CubeAPM pricing.
Pros:
- Predictable flat-rate pricing with no surprise overages
- Full data residency for regulated industries
- Unified view of Spark metrics, application traces, and infrastructure
- Fast onboarding using existing Prometheus or OTel agents
Cons:
- Requires BYOC or on-prem deployment
- Teams must manage underlying infrastructure
- No autonomous anomaly detection for Spark-specific patterns
Best for: Teams running Spark on Kubernetes or bare metal that need full observability without SaaS vendor lock-in or unpredictable per-host pricing.
2. Datadog
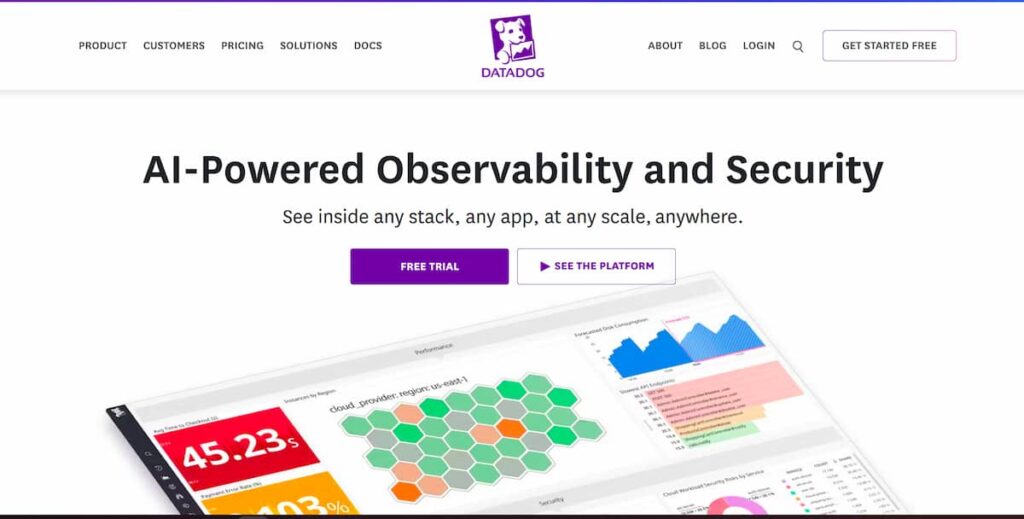
Best for: Multi-cloud enterprises that want managed Spark monitoring with 700+ integrations and do not need on-prem deployment.
Datadog is a SaaS observability platform with strong Spark integration via its Java agent and JMX metric collection. It surfaces Spark executor metrics, task-level latency, and streaming batch delays in pre-built dashboards. Datadog correlates Spark metrics with application traces, Kafka lag, and infrastructure performance, making it easier to trace a Spark job slowdown back to upstream data source issues or downstream database bottlenecks.
Key Features:
- Pre-built Spark Streaming dashboards with batch delay and task failure tracking
- Deep Kafka integration for end-to-end stream monitoring
- Auto-discovery of Spark executors and drivers across clusters
- Correlates Spark metrics with APM traces and logs
- Alerting on batch processing time, executor memory pressure, and task retries
Pricing: Infrastructure monitoring starts at $15/host/month. APM adds $31/host/month. A 50-host Spark cluster costs $2,300/month before custom metrics or log indexing fees. Datadog pricing details.
Pricing models a production-ready setup with high availability. Smaller deployments or negotiated enterprise contracts may cost less.
Pros:
- Fully managed SaaS with no infrastructure burden
- Strong Kafka and stream source integrations
- Rich alerting and anomaly detection
- Broad ecosystem support
Cons:
- Per-host pricing compounds fast at scale
- SaaS-only deployment rules out teams with data residency requirements
- Custom metrics incur additional fees beyond base pricing
Best for: Teams that prioritize managed services and breadth over cost, and do not need on-prem deployment.
3. Dynatrace
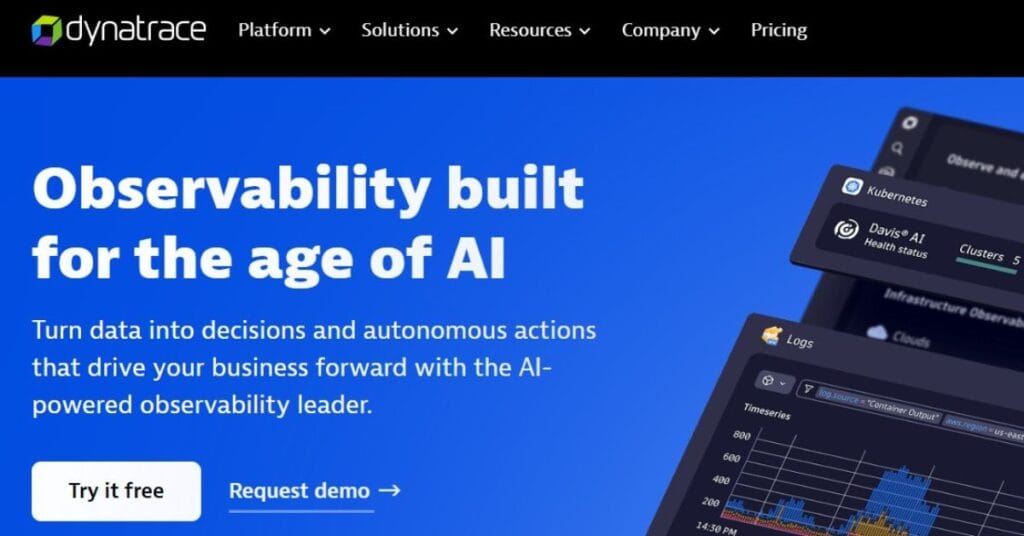
Best for: Enterprises that want AI-assisted root cause analysis for Spark jobs and can budget for premium pricing.
Dynatrace uses its Davis AI engine to automatically correlate Spark job failures with infrastructure events, dependency latency, and code-level performance issues. Its OneAgent auto-instruments Spark applications and surfaces executor-level metrics, task failures, and GC pressure without manual configuration. Dynatrace excels at tracing cascading failures across Spark Streaming pipelines, Kafka brokers, and downstream databases.
Key Features:
- Davis AI correlates Spark metrics with infrastructure and code-level issues
- OneAgent auto-instruments Spark without manual JMX exporter setup
- Real-time alerting on batch processing delays and task retries
- Deep integration with Kubernetes for Spark-on-K8s deployments
- Unified view of Spark, Kafka, and database performance
Pricing: Starts at $50/vCPU core/month. A 50-node Spark cluster with 8 vCPUs per node costs approximately $20,000/month. Dynatrace pricing overview.
Enterprise pricing varies based on total infrastructure monitored and negotiated contracts.
Pros:
- AI-driven root cause analysis reduces MTTR
- Auto-instrumentation simplifies setup
- Strong Kubernetes and cloud-native support
- On-prem deployment available
Cons:
- Premium pricing puts it out of reach for cost-sensitive teams
- Heavy instrumentation can add latency in high-throughput jobs
- Proprietary query language creates vendor lock-in
Best for: Large enterprises with complex Spark pipelines that justify premium pricing for AI-assisted troubleshooting.
4. New Relic

Best for: Teams that want Spark monitoring inside a broader managed observability platform and can accept SaaS-only deployment.
New Relic monitors Spark via its Java agent and JMX integration. It surfaces job-level metrics, executor resource usage, and batch processing delays in customizable dashboards. New Relic correlates Spark metrics with distributed traces and logs, making it easier to connect a slow Spark job to upstream API latency or downstream database contention.
Key Features:
- Pre-built Spark dashboards with batch delay and task failure tracking
- Correlates Spark metrics with APM traces and logs
- Alerting on batch processing time and executor memory pressure
- Integrates with Kafka, HDFS, and cloud storage sources
- NRQL query language for custom metric analysis
Pricing: $0.40/GB ingested beyond the 100GB free tier. A Spark cluster generating 1TB of metrics and logs monthly costs $400/month for data ingest, plus per-user fees starting at $99/user/month for full platform access. New Relic pricing calculator.
Pricing based on publicly available information as of April 2026. Enterprise discounts and custom contracts not reflected.
Pros:
- Managed SaaS with no infrastructure burden
- Strong integration ecosystem
- Unified observability across Spark, infrastructure, and applications
- Good documentation and community support
Cons:
- SaaS-only deployment rules out on-prem teams
- NRQL query language creates vendor lock-in
- Per-user fees compound as teams grow
Best for: Teams already using New Relic for APM that want to add Spark monitoring without introducing a second vendor.
5. Grafana + Prometheus
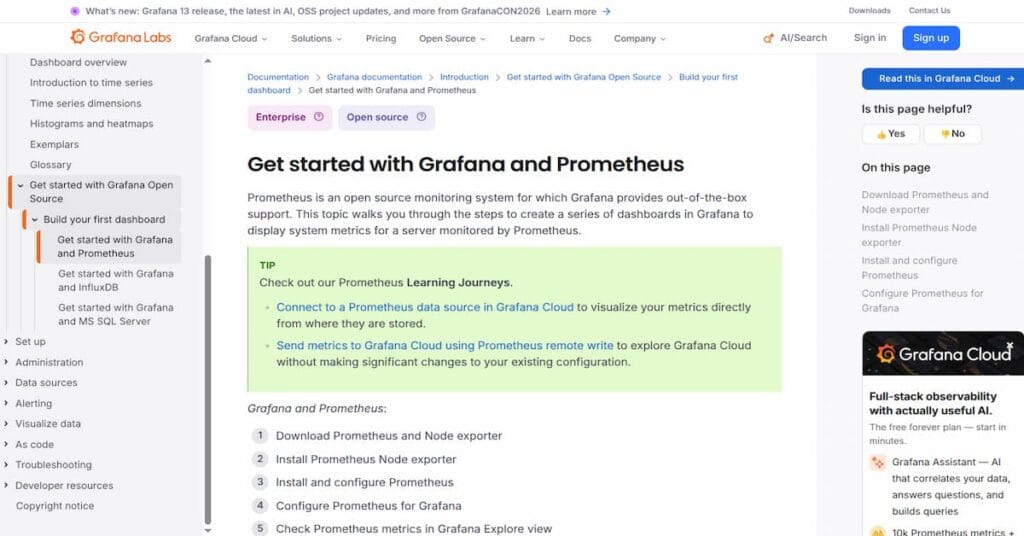
Best for: OSS-first teams that want full control over Spark metrics, custom dashboards, and zero vendor lock-in.
Grafana and Prometheus form the most popular open-source stack for Spark monitoring. Prometheus scrapes Spark metrics via the JMX exporter, stores them in a time-series database, and Grafana visualizes them in custom dashboards. This combination gives teams full control over metric retention, query performance, and data residency. The trade-off is operational complexity; you manage the entire stack.
Key Features:
- Full control over metric collection and retention
- Custom dashboards for any Spark metric exposed via JMX
- Alertmanager for threshold-based and anomaly-based alerts
- Native Kubernetes support via Prometheus Operator
- Vendor-neutral exporters work with any Spark deployment
Pricing: Free for self-hosted OSS. Grafana Cloud starts at $49/month for hosted Prometheus and Grafana, with usage-based pricing for metrics ingested. Grafana Cloud pricing.
Pricing for Grafana Cloud based on the April 2026 public rate card. Self-hosted deployments incur infrastructure and operational costs.
Pros:
- Zero vendor lock-in with fully open-source stack
- Complete control over data and dashboards
- Strong Kubernetes and cloud-native support
- Active community and ecosystem
Cons:
- Requires operational expertise to deploy, scale, and maintain
- No built-in correlation with application traces or logs
- Alert fatigue without careful tuning
- High-cardinality metrics can strain Prometheus at scale
Best for: Teams with strong DevOps expertise that prioritize control and cost over managed services.
6. Elastic APM
Best for: Teams already using the ELK stack for logs that want to add Spark metrics and traces without introducing a new vendor.
Elastic APM integrates with Elasticsearch, Logstash, and Kibana to provide unified observability for Spark Streaming jobs. Metricbeat collects Spark metrics via JMX, Filebeat ingests Spark logs, and Elastic APM correlates both with application traces. This gives teams a single interface to search logs, query metrics, and trace distributed requests across Spark jobs and downstream services.
Key Features:
- Unified logs, metrics, and traces in Kibana
- Metricbeat collects Spark metrics via JMX exporter
- Correlates Spark metrics with application traces
- Self-hosted or Elastic Cloud deployment
- ML-based anomaly detection in Elastic Cloud
Pricing: Free for self-hosted OSS. Elastic Cloud starts at $99/month for the standard tier. Elastic Cloud pricing.
Pricing based on early 2026 public information. Self-hosted deployments incur infrastructure costs.
Pros:
- Unified platform for logs, metrics, and traces
- Strong search and query capabilities
- Self-hosted option for data residency
- Good Kubernetes and cloud-native support
Cons:
- Steep learning curve for teams new to the ELK stack
- Resource-intensive at scale
- Limited out-of-the-box Spark dashboards
- Requires manual tuning for optimal performance
Best for: Teams already invested in the ELK stack that want to extend it to Spark monitoring.
7. AppDynamics
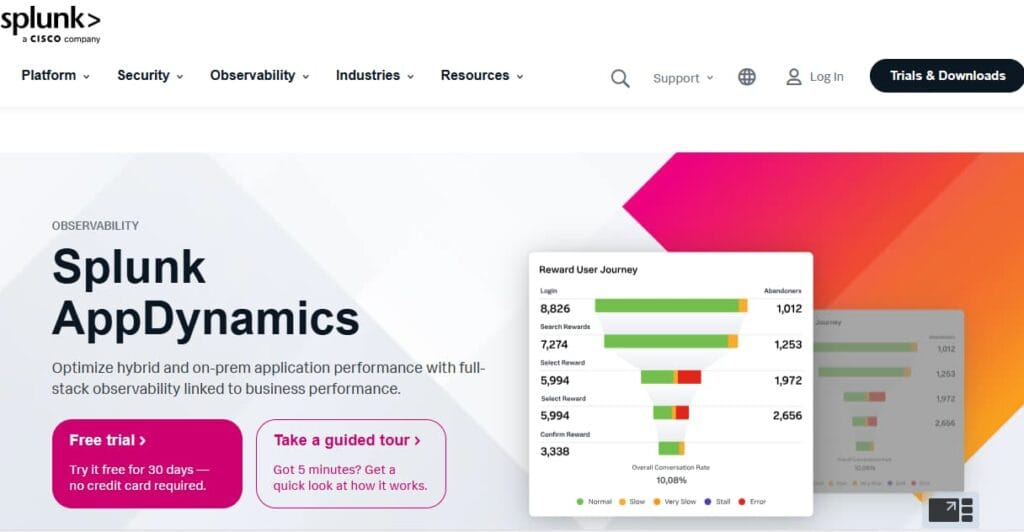
Best for: Cisco-heavy enterprises that need business transaction monitoring correlated with Spark job performance.
AppDynamics monitors Spark via its Java agent and correlates job performance with business metrics like transaction volume, revenue impact, and SLA compliance. It surfaces Spark executor metrics, task failures, and batch delays in the context of business transactions, making it easier to prioritize fixes based on customer impact rather than technical severity alone.
Key Features:
- Business transaction monitoring correlated with Spark metrics
- Java agent auto-instruments Spark applications
- Alerting on batch processing delays and task failures
- Deep integration with Cisco infrastructure
- On-prem and SaaS deployment options
Pricing: Starts at $50/vCPU core/month. A 50-node Spark cluster costs approximately $20,000/month. AppDynamics pricing overview.
Enterprise pricing varies based on infrastructure scale and negotiated contracts.
Pros:
- Business-focused metrics beyond technical telemetry
- Strong Cisco ecosystem integration
- On-prem deployment available
- Good support for hybrid cloud
Cons:
- Premium pricing limits accessibility
- Heavy agent overhead in high-throughput jobs
- Proprietary query language creates lock-in
- Complex setup compared to lighter-weight tools
Best for: Large Cisco-centric enterprises that need business transaction correlation with Spark performance.
8. Instana
Best for: Microservices-heavy teams that want auto-discovery and dependency mapping for Spark Streaming pipelines.
Instana automatically discovers Spark clusters, maps dependencies between Spark jobs and upstream/downstream services, and surfaces performance bottlenecks in real time. Its agent auto-instruments Spark applications and correlates metrics with distributed traces across the entire stack. Instana excels at visualizing how Spark jobs interact with Kafka, databases, and APIs in complex microservices architectures.
Key Features:
- Auto-discovery of Spark clusters and dependencies
- Real-time dependency mapping across services
- Correlates Spark metrics with distributed traces
- Alerting on batch delays and task failures
- SaaS and on-prem deployment options
Pricing: Host-based pricing starts around $75/host/month. A 50-host Spark cluster costs approximately $3,750/month. Pricing varies by contract and infrastructure scale.
Pricing is based on typical enterprise contracts as of April 2026. Custom pricing available.
Pros:
- Auto-discovery reduces manual configuration
- Strong microservices and Kubernetes support
- Real-time dependency mapping
- Low agent overhead
Cons:
- Per-host pricing compounds at scale
- Limited customization compared to OSS tools
- Proprietary platform creates vendor lock-in
- Requires agent deployment across all services
Best for: Teams running Spark in microservices architectures that need automatic dependency mapping.
9. Apache Spark UI
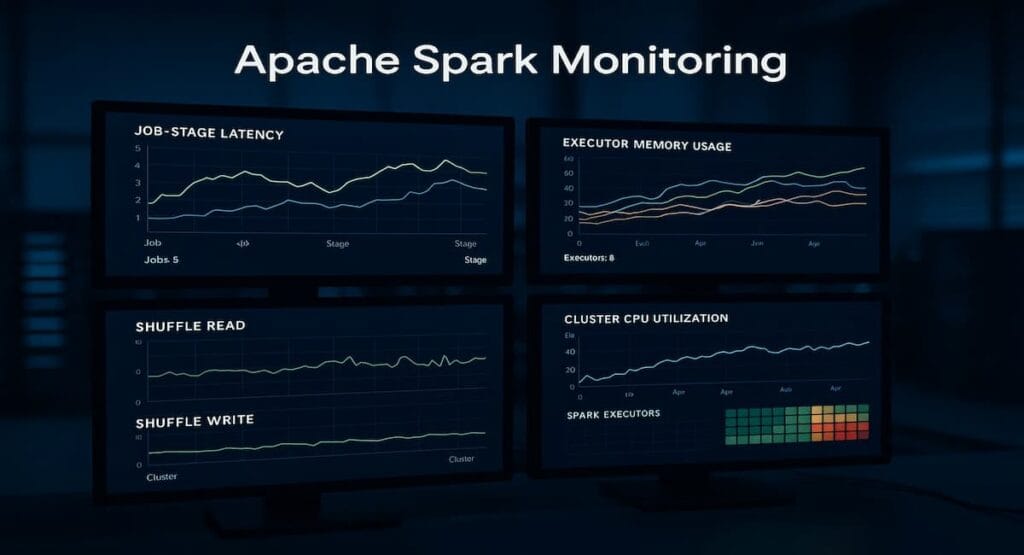
Best for: Built-in debugging during development and simple production workloads that do not require historical metric retention.
Apache Spark UI is the built-in web interface included with every Spark deployment. It surfaces job-level metrics, stage timelines, executor resource usage, and task failures in real time. While limited compared to dedicated monitoring platforms, it provides immediate visibility into running jobs without additional tooling. Most teams use Spark UI for debugging during development and supplement it with external monitoring in production.
Key Features:
- Built-in with every Spark deployment
- Real-time job, stage, and task metrics
- Executor resource usage and GC stats
- SQL query execution plans
- Streaming batch delay and processing time
Pricing: Free; included with Apache Spark.
Pros:
- Zero setup or additional cost
- Direct access to all Spark internal metrics
- Good for debugging during development
- No external dependencies
Cons:
- No historical metric retention
- Limited alerting capabilities
- No correlation with logs or traces
- UI only accessible while the job is running
- No multi-cluster visibility
Best for: Development environments and simple production workloads where real-time debugging is sufficient.
How to Choose the Right Spark Streaming Monitoring Tool
Choosing the right tool depends on five primary factors: deployment model, cost structure, metric depth, integration ecosystem, and team expertise.
Deployment model: If you have data residency requirements, HIPAA compliance, or need to keep telemetry inside your VPC, on-prem or self-hosted options like CubeAPM, Grafana, or Elastic APM are required. SaaS-only tools like Datadog and New Relic are ruled out immediately.
Cost structure: Per-host pricing from vendors like Datadog, Dynatrace, and AppDynamics compounds fast as Spark clusters scale. Ingestion-based pricing from CubeAPM or New Relic offers more predictability. Open-source tools like Grafana and Elastic have no licensing fees but require infrastructure and operational investment.
Metric depth: All tools surface basic Spark metrics via JMX exporters, but correlation with traces and logs varies widely. CubeAPM, Datadog, and Dynatrace offer unified observability. Grafana and Elastic require manual integration with tracing backends like Tempo or Jaeger.
Integration ecosystem: Teams already using Datadog for infrastructure, New Relic for APM, or Elastic for logs benefit from extending those platforms to Spark. Introducing a new vendor adds operational overhead.
Team expertise: Open-source tools like Grafana and Elastic offer maximum control but require operational expertise to deploy, scale, and maintain. Managed SaaS platforms reduce operational burden but introduce vendor lock-in.
Ask: Do we need on-prem deployment? What is our budget at scale? Do we need unified logs, metrics, and traces? Are we already invested in a monitoring platform? Do we have the expertise to manage open-source tooling?
Frequently Asked Questions
Which is better Spark or Flink?
Spark Streaming uses micro-batching and is better for batch-heavy workloads, complex transformations, and teams already invested in the Spark ecosystem. Flink uses true stream processing and is better for low-latency event processing, stateful computations, and complex event time handling. The choice depends on latency requirements and existing infrastructure.
Does Netflix use Apache Spark?
Yes, Netflix uses Apache Spark for large-scale data processing, ETL pipelines, and machine learning workloads. They process petabytes of data daily using Spark on AWS EMR and have contributed to Spark development.
What is the alternative to Spark streaming?
The main alternatives are Apache Flink for true stream processing, Apache Kafka Streams for lightweight stream processing tightly coupled with Kafka, and cloud-native services like AWS Kinesis Data Analytics or Google Cloud Dataflow for managed stream processing.
How do I monitor Spark Streaming batch delays?
Monitor the `streaming.lastReceivedBatch_processingDelay` and `streaming.lastCompletedBatch_processingDelay` metrics via JMX exporters. Most infrastructure monitoring tools surface these metrics in pre-built dashboards. Set alerts when processing delay exceeds batch interval to detect backpressure early.
What metrics are most important for Spark Streaming?
The critical metrics are batch processing delay, task failure rate, executor memory usage, GC time, shuffle read/write time, and records processed per second. These surface whether jobs are keeping up with incoming data, where bottlenecks exist, and when resource limits are approaching.
Can I use Prometheus to monitor Spark?
Yes, Prometheus collects Spark metrics via the JMX exporter. Deploy the JMX exporter as a Java agent alongside Spark, configure it to expose Spark metrics in Prometheus format, and configure Prometheus to scrape the exporter endpoint. Grafana visualizes the metrics.
How does CubeAPM monitor Spark Streaming?
CubeAPM ingests Spark metrics via Prometheus exporters or OpenTelemetry collectors, correlates them with application traces and logs, and surfaces job-level visibility in unified dashboards. It runs on your infrastructure with no data egress and uses predictable $0.20/GB pricing across all telemetry types.
Disclaimer: The information in this article reflects the latest details available at the time of publication and may change as technologies and products evolve. Features, pricing, and plan limits can change over time. Always verify the latest information directly with the vendor before making purchasing or deployment decisions.