Modern applications run on microservices, containers, and serverless functions across cloud and hybrid setups. It boosts scalability, but also makes troubleshooting harder for teams. For instance, when one request touches dozens of services, finding the root cause becomes difficult.
Distributed tracing solves this by following a request across frontends, backends, and external APIs to reveal performance bottlenecks. By 2022, 47% of organizations were already using tracing, with 70% of the rest planning adoption within two years.
CubeAPM stands out as the best distributed tracing tool with an OpenTelemetry-native, cost-efficient option that unifies tracing, metrics, logs, and RUM—making it one of the best choices for teams seeking visibility with pricing transparency.
In this guide, we compare the top 8 distributed tracing tools of 2025, covering features, pricing, pros/cons, and use cases.
Top Distributed Tracing Tools
- CubeAPM
- Datadog
- New Relic
- Dynatrace
- SigNoz
- Sentry
- Elastic Observability
- Honeycomb
What Is a Distributed Tracing Tool?
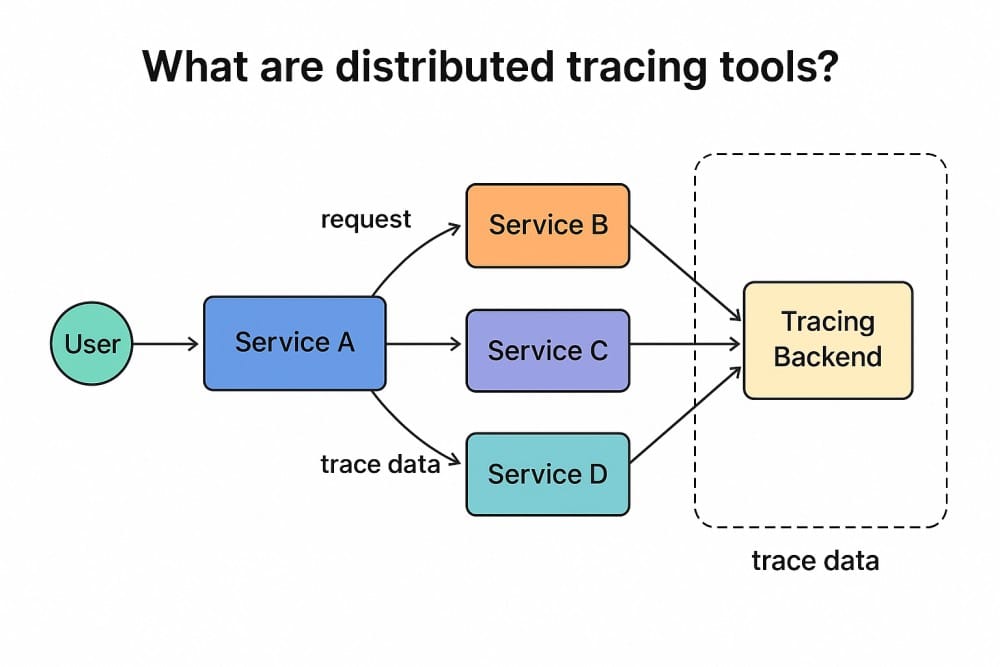
A distributed tracing tool is a core observability solution that tracks a single request or transaction as it travels across multiple services, APIs, databases, and infrastructure components. Technically, it records spans (individual operations) and assembles them into a trace (the full journey), giving developers end-to-end visibility into latency, dependencies, and failure points within complex, distributed systems.
Using distributed tracing tools, teams can reduce mean-time-to-resolution (MTTR), expose hidden bottlenecks, improve user experience, and help teams optimize performance costs. These tools also tie traces with logs and metrics for faster, more accurate root cause analysis.
Example of Distributed Tracing in E-commerce
Imagine an e-commerce checkout request: when a user clicks “Buy,” that action may pass through a frontend service, payment API, inventory system, and shipping microservice. If the process slows down, distributed tracing shows exactly which step caused the delay—say, a payment API timeout—so engineers can resolve the issue quickly.
Why Teams Choose Different Distributed Tracing Tools?
Unpredictable tracing costs
Tracing emits lots of spans, and vendors often price by ingested spans / GB, indexed spans, hosts, and retention—a mix that’s hard to forecast. Many teams report “bill shock” when traffic or instrumentation coverage grows and multiple SKUs (APM, logs, profiling) are turned on. Official billing pages and community threads repeatedly flag this complexity, prompting buyers to seek cost-predictable options.
Sampling strategy: fidelity vs. spend
Head-based sampling can drop the very traces you need (rare errors, P99 latency). Teams want tail-based or policy-driven sampling so they can keep “interesting” traces without storing everything. OpenTelemetry documents why tail sampling decides after seeing the whole trace, letting you keep slow/error traces while staying within budget.
Instrumentation & context propagation pitfalls
Good tracing provides context for services, queues, and async hops. Teams struggle when libraries/frameworks don’t auto-propagate or when polyglot stacks (Node.js, Java, Go, .NET) need a different setup. OpenTelemetry stresses context propagation fundamentals; missing it yields broken waterfalls and gaps in dependency graphs.
Kubernetes & serverless blind spots
Ephemeral compute makes tracing fragile: pods churn, autoscaling changes topology, and cold starts reset contexts. Buyers report spans that “fall on the floor” when workloads recycle quickly unless the vendor has first-class K8s/Lambda patterns. Recent guidance highlights ephemeral challenges and the value of OTel-native integrations in these environments. (AWS Documentation)
Steep UIs and noisy waterfalls
Even great platforms can overwhelm newcomers with dense span lists, nested views, and weak defaults for correlation. G2 reviews frequently mention learning curve and UI complexity, which slows adoption and incident response unless the tool surfaces “what changed” and “where time was spent” right away. (G2)
Proprietary agents & migration lock-in
Teams burned by proprietary collectors/agents now insist on OpenTelemetry-first pipelines to avoid re-instrumenting during a vendor change. Even AWS urges customers to adopt OTel moving forward, reinforcing the industry shift toward vendor-neutral standards for tracing data.
Weak logs ↔ traces ↔ metrics correlation
Traces alone rarely close incidents. Engineers want one-click pivots between a slow span and its related logs/metrics. Vendors document how to inject trace.id/span.id into logs, but if correlation is clunky—or requires separate products—teams look elsewhere for unified triage.
Support responsiveness during outages
Tracing is most valuable during P1 incidents—precisely when slow support hurts the most. Public reviews note that response times can vary by plan or be delayed, pushing teams toward vendors with faster, engineer-level help and clearer escalation paths.
Ecosystem & Integration Needs
Some teams want tracing tightly integrated with their existing stack (e.g., Datadog if already using their metrics/logs, or Elastic if on ELK). Others want tools that work standalone or with Grafana/Loki/Prometheus.
Top 8 Distributed Tracing Tools
1. CubeAPM
Overview
CubeAPM is a modern OpenTelemetry-native distributed tracing platform designed for organizations that want full-stack observability without unpredictable costs. It combines distributed tracing, logs, metrics, events, and profiling into a single system. What sets CubeAPM apart is its cost transparency—instead of charging per host, per user, or for retention, it simply bills for the volume of data ingested, making it one of the most predictable tracing tools in the market.
Key Advantage
The biggest advantage of CubeAPM is cost-predictable distributed tracing at scale, powered by smart sampling. Unlike head-based sampling used in most tools, CubeAPM applies context-aware sampling—keeping slow or error-heavy traces while discarding low-value ones. It ensures engineers get high-fidelity data for debugging without drowning in span noise or facing bill spikes. Combined with its flat-rate pricing model, CubeAPM enables teams to scale distributed tracing confidently without financial surprises.
Key Features
- OpenTelemetry-first instrumentation: Supports all major OTEL SDKs and offers easy setup for languages like Node.js (Express, NestJS), Java (Spring Boot), Go, Python, and .NET.
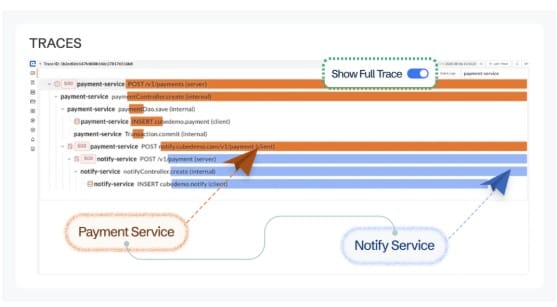
- Service maps & trace waterfalls: Auto-detects dependencies between microservices, databases, APIs, and third-party calls, giving a complete picture of request flows.
- Smart sampling engine: Retains traces tied to latency, high error rates, or anomalies, ensuring meaningful visibility while reducing storage overhead.
- Full MELT observability: Correlates distributed traces with logs, metrics, events, synthetic monitoring, and RUM—speeding up root cause analysis.
- Self-host or SaaS deployment: Organizations with compliance needs (HIPAA, GDPR) can host CubeAPM in their own cloud or data center.
- 800+ integrations: Works out-of-the-box with Kubernetes, AWS, GCP, Azure, and popular frameworks, databases, and messaging systems.
- Low-latency architecture: Stores data inside your cloud (if self-hosted), reducing transfer costs and improving query speeds.
- End-to-End Visibility: Trace requests across frontend, backend, APIs, and databases.
- Root Cause Fast: Pinpoint latency sources and failing services instantly.
- Granular Insights: Drill into spans, errors, and code-level details.
- Logs & Metrics Correlation: Jump from traces to logs and infra in one click.
Pros
- Transparent pricing with no host, egress charges, retention, or user-based fees
- 800+ prebuilt integrations, making it nearly as plug-and-play as Datadog
- Full-stack coverage (distributed tracing + MELT)
- Flexible deployment: SaaS for ease, or on-prem for compliance
- Direct engineer-level support with rapid TAT
Cons
- No cloud security management features, as CubeAPM is observability-focused
- Businesses looking for SaaS only solutions may not find it suitable
Pricing at Scale
CubeAPM uses a transparent pricing model of $0.15 per GB ingested. For a mid-sized business generating 45 TB (~45,000 GB) of data per month, the monthly cost would be ~$7,200/month. There are no extra charges for hosts, users, or retention.
*All pricing comparisons are calculated using standardized Small/Medium/Large team profiles defined in our internal benchmarking sheet, based on fixed log, metrics, trace, and retention assumptions. Actual pricing may vary by usage, region, and plan structure. Please confirm current pricing with each vendor.
Tech Fit
CubeAPM fits organizations running polyglot microservices with Java, Go, Python, Node.js, and .NET, as well as Kubernetes-native and serverless environments. It is ideal for SaaS providers and compliance-driven industries that need predictable costs and the ability to self-host, while DevOps teams benefit from its 800+ integrations across CI/CD, cloud infrastructure, databases, and messaging queues.
2. Dynatrace
Overview
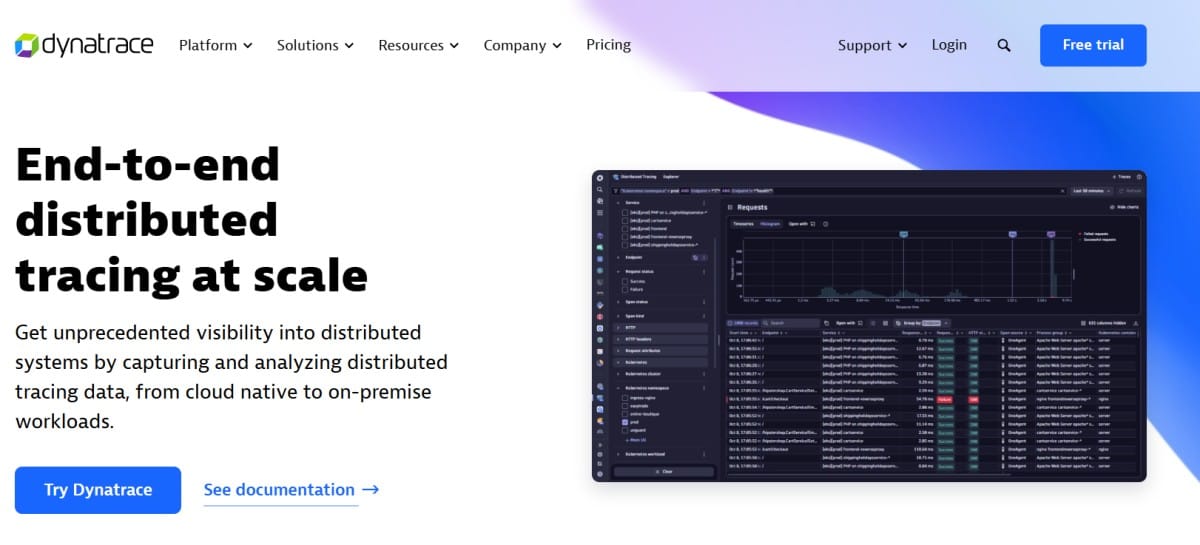
Dynatrace provides the PurePath® technology to provide end-to-end distributed tracing. It also offers auto-instrumentation for code-level spans and connects them to topology (Smartscape), logs, metrics, and user experience. It’s designed for enterprises that want deep, automated visibility across cloud-native and hybrid stacks, with optional OpenTelemetry ingest when you don’t want to rely solely on agents.
Key Advantage
High-fidelity PurePath® tracing plus Davis® AI context—Dynatrace automatically captures traces with code-level detail, correlates them to dependencies and user impact, and applies causal-AI to surface the probable root cause, which helps large teams triage faster in complex microservice environments.
Key Features
- PurePath® distributed tracing: Automatic, code-level spans across services, external calls, and databases with end-to-end stitching.
- Smartscape topology & service maps: Continuous dependency discovery and relationship mapping for microservices and infra.
- OpenTelemetry ingest & analytics: Bring OTel traces into Dynatrace and analyze alongside other signals.
- Davis® AI assistance: Causal-AI highlights anomalies and likely root causes across traces, metrics, and logs.
- Kubernetes & serverless coverage: Automated visibility for pods, containers, and functions with one-agent collection.
Pros
- PurePath® gives rich, code-level traces at enterprise scale
- Strong automation with Davis® AI and Smartscape correlation
- First-class Kubernetes coverage and broad cloud support
- Supports OpenTelemetry ingest for vendor-neutral pipelines
Cons
- Pricing model mixes host memory hours with per-GiB trace usage
- Learning curve for new users
Pricing at Scale
Dynatrace charges:
- Full stack: $0.01/8 GiB hour/month or $58/month/8GiB host
- Log Ingest & process: $0.20 per GiB
For a similar 45 TB (~45,000 GB/month) volume, the cost would be $21,850/month.
Tech Fit
Dynatrace suits enterprises running large, polyglot microservices on Kubernetes and hybrid clouds that want automatic code-level tracing, topology mapping, and AI-assisted triage. It is best for organizations that prefer agent-driven capture but still want OpenTelemetry ingest flexibility, and value deep correlation and automation enough to justify a more complex, consumption-based cost model.
3. Datadog
Overview
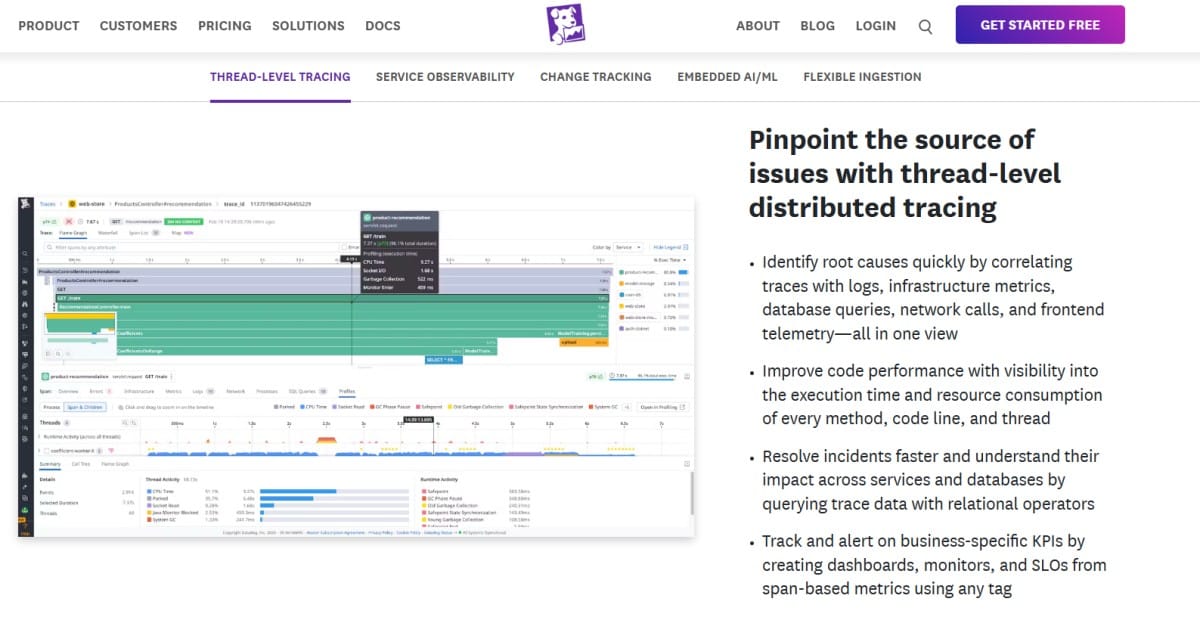
Datadog is a comprehensive end-to-end distributed tracing platform that tightly integrates APM with infrastructure, logs, metrics, synthetic monitoring, and RUM. It delivers automatic instrumentation and service maps across languages and infrastructure components, designed for teams that want to unify observability at scale—but its modular, multi-dimensional pricing can quickly become complex and costly.
Key Advantage
Datadog shines in delivering rich context along the full request path, connecting frontend performance (RUM or synthetic) to backend traces and infrastructure metrics. Its unified dashboard surfaces latency, errors, and performance hotspots in one place, making it ideal for large-scale, cloud-native environments.
Key Features
- End-to-end tracing: From browser and synthetic tests through backend services and infrastructure.
- Ingestion control and sampling settings: Allows you to tune trace volume by service to manage costs.
- Automatic service maps and dependency graphs: Visualize service interactions instantly.
- Out-of-the-box instrumentation: for Node.js, Lambda, Kubernetes, RUM, Synthetic, and more.
- Full-stack integration: Seamless correlation of traces with logs, metrics, synthetic tests, RUM, and security workflows.
Pros
- Rich ecosystem with over 850 integrations
- End-to-end tracing correlated with logs, metrics, and synthetic monitoring
- Ingestion control mechanisms help manage trace volume and costs
- Strong UI tooling with real-time dashboards and visual trace analysis
Cons
- Pricing is complex, based on hosts, spans ingested, indexed spans, and feature modules
- SaaS-only; no self-hosting option
Pricing at Scale
Datadog charges differently for different capabilities. APM starts at $31/month; infra starts at $15/month; logs start at $0.10/GB, and so on.
For a mid-sized business ingesting around 45 TB (~45,000 GB) of data per month, the cost would come around $27,475/month.
Tech Fit
Datadog is well-suited for medium to large organizations with complex, polyglot environments—especially Kubernetes-heavy stacks, serverless or microservices architectures, and teams already using its logs and synthetic monitoring suite. It works across Node.js, Python, Java, Go, .NET, Lambda, and frontend (RUM), making it a powerful unified observability option as long as you can manage the cost and complexity.
4. New Relic
Overview
New Relic is a full-stack observability platform with end-to-end distributed tracing that ties spans to errors, logs, metrics, profiles, and front-end telemetry in one UI. Tracing is central to New Relic’s APM experience and includes dedicated views for trace lists, service maps, and per-span analysis to quickly isolate latency and error propagation across microservices.
Key Advantage
New Relic’s advantage is deep, guided troubleshooting: you can start from a user-facing symptom (RUM or Synthetics), jump into a distributed trace, and follow spans through services, external calls, and databases while pivoting to correlated logs and metrics—minimizing context switching during incidents.
Key Features
- End-to-end distributed tracing: Trace requests across services, queues, and external dependencies; drill into spans and attributes.
- Trace UI and service maps: Filter, group, and compare traces; visualize dependencies to spot hotspots fast.
- Flexible sampling options: Works with New Relic agents, OpenTelemetry pipelines, or Infinite Tracing models.
- OpenTelemetry ingest: Ingest OTel traces alongside other telemetry and keep them correlated in one place.
- Guided workflows: Purpose-built views to investigate errors, slow transactions, and cross-account traces.
Pros
- Mature distributed tracing with strong UI for span-level analysis and service maps
- 780+ integrations and broad language coverage for polyglot microservices
- Tight correlation across traces, logs, metrics, profiles, RUM, and synthetics
- Usage-based model with clear per-GB data pricing and seat types published publicly
Cons
- Could be cotly for smaller teams with tighter budgets
- No self-hosting
Pricing at Scale
New Relic’s billing is based on data ingested, user licenses, and optional add-ons. The free tier offers 100 GB of ingest per month, then it costs $0.40 per GB after that. For a business ingesting 45 TB of logs per month, the cost would come around $25,990/month.
Tech Fit
New Relic fits organizations running polyglot microservices on Kubernetes and serverless that want tracing tightly integrated with the rest of their telemetry. It works well across Java, .NET, Node.js, Python, Go, and browser/mobile, supports OpenTelemetry ingest, and suits teams that value out-of-the-box workflows and a rich UI for trace-first debugging while accepting a per-GB + seat pricing model.
5. SigNoz
Overview
SigNoz is an open-source, OpenTelemetry-first distributed tracing platform that unifies traces, logs, and metrics in a single UI. It’s available as self-hosted (Community/Enterprise) or managed cloud, giving teams flexibility on data control and deployment while keeping the developer experience approachable with flamegraphs, Gantt views, and opinionated trace workflows.
Key Advantage
OTEL-native tracing with the freedom to self-host or use a managed cloud, so teams can standardize instrumentation, avoid vendor lock-in, and choose the right balance between operational control and convenience
Key Features
- End-to-end distributed tracing: Follow requests across services, queues, and databases with span detail, timing, and attributes.
- Trace → metrics → logs correlation: Jump between signals in a few clicks to speed up root-cause analysis.
- Flamegraphs & Gantt views: Visualize hot paths, parallelism, and blocking spans for faster performance tuning.
- OpenTelemetry ingest: Use native OTel SDKs/collectors and bring your existing pipelines without re-instrumentation.
- Flexible deployment: Choose Cloud, Self-Hosted Enterprise with support, or Community Edition to manage yourself.
Pros
- Open-source with strong OpenTelemetry alignment
- Self-host option for data residency and governance
- Clean trace UI with flamegraphs and span exploration
- Correlated traces, logs, and metrics in one place
Cons
- Cloud pricing is usage-based and can rise with high trace volumes
- Many advanced features, like pre-built integrations and customizations are locked behind paid plans
Pricing at Scale
SigNoz Cloud bills logs/traces as per usage; around $0.30 per GB for ingested traces/logs, and $0.10/GB for metrics, plus you may wish to pay extra for add-ons. Using our 45 TB scenario, the cost could be $16,000/month.
Tech Fit
SigNoz fits engineering teams standardizing on OpenTelemetry that want developer-friendly distributed tracing with the option to self-host for compliance or run a managed cloud for simplicity; it works well across polyglot microservices on Kubernetes and popular runtimes like Java, Go, Python, Node.js, and .NET, and suits organizations that value open-source flexibility with straightforward trace-first debugging workflows.
6. Sentry
Overview
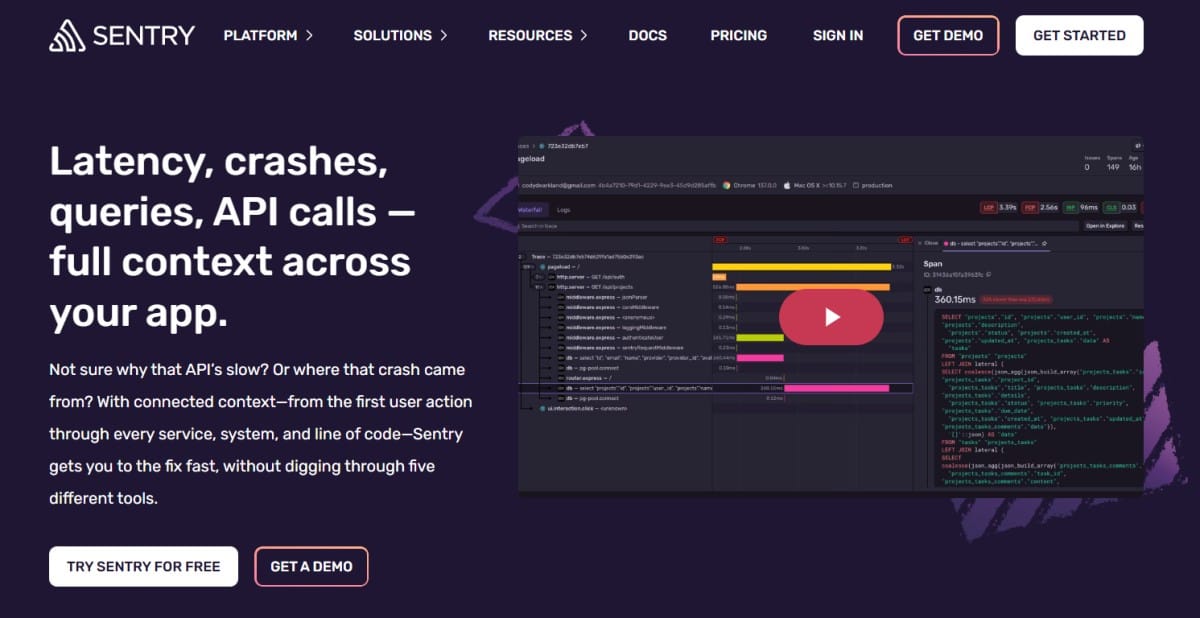
Sentry pairs error monitoring with end-to-end distributed tracing, letting teams follow a request from the first user action through backend services and databases with a trace waterfall, span details, and service maps. Tracing is first-class in Sentry’s APM experience, with trace/transaction views, span metrics, and opinionated workflows that help developers move from symptom to slow span quickly.
Key Advantage
Developer-centric tracing that’s tightly integrated with error monitoring and frontend telemetry — you can start from a user-facing issue, jump into the trace, inspect slow spans and DB queries, and pivot to related errors and metrics without leaving the UI.
Key Features
- End-to-end distributed tracing: Follow user interactions through services, external calls, queues, and databases; drill into span attributes and timings.
- Trace view and span explorer: Filter, group, and compare traces; search spans by attributes to isolate hotspots.
- Span metrics and performance alerts: Turn spans into time series for latency and throughput; alert on percentiles or regressions.
- SDKs plus OpenTelemetry ingest: Keep existing instrumentation by using Sentry’s SDKs or by bridging OTel signals.
- Frontend ↔ backend correlation: Connect RUM/JS transactions with backend traces for full request context.
Pros
- Intuitive UI for developers and product teams
- Strong frontend-to-backend correlation and error overlap
- Lightweight setup with popular SDKs and frameworks
- Span metrics and opinionated workflows speed root-cause
Cons
- Event/span-based billing can be costly for smaller teams
- Error reporting delays
Pricing at Scale
Free up to 5K events/month; Teams: from $26/month; Business: usage-based, with tiers for performance monitoring and session replay, starting from $80/month. For mid-sized teams ingesting 45 TB of data, the cost could be $12,100/month.
Tech Fit
Sentry fits teams that want developer-friendly, trace-first debugging across JavaScript/TypeScript frontends and popular backends (Node.js, Python, Java, .NET, Go), need tight linkage between errors and slow spans, and prefer event/span-based control over what they send; it’s especially strong for product-led organizations that start from user-visible performance symptoms and then drill into distributed traces.
7. Elastic APM
Overview
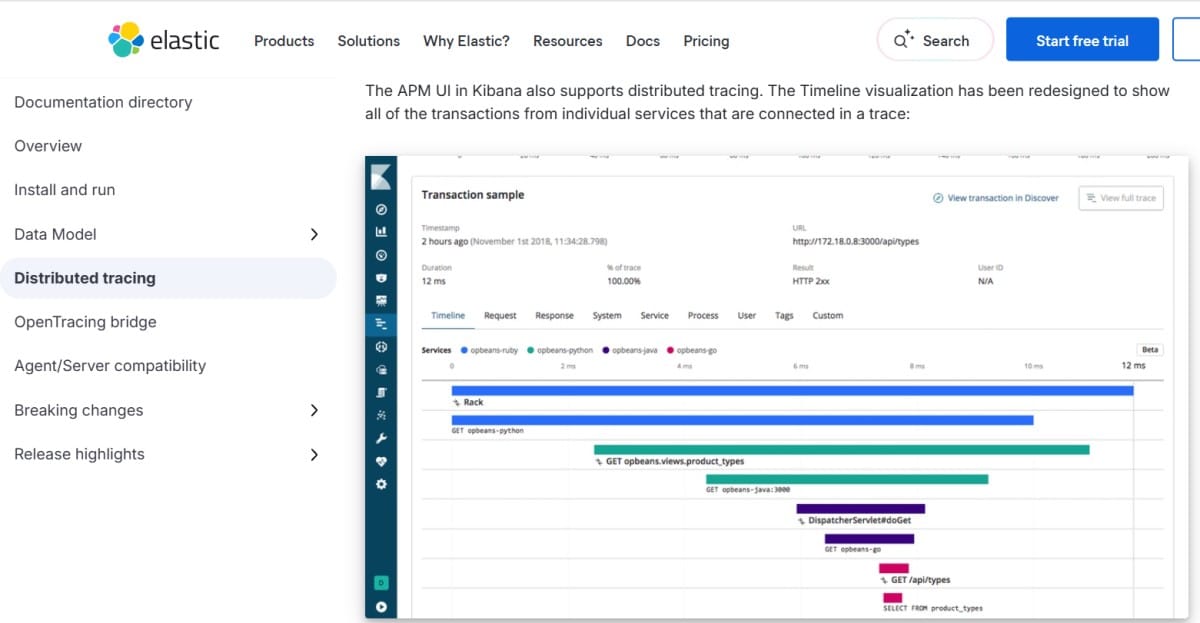
Elastic APM brings end-to-end distributed tracing into the Elastic Observability suite so you can follow a request across services, queues, and databases while pivoting directly into logs and metrics. You can see waterfalls, impact-based sorting, service relationships, etc. via the UI. Also, Elastic agents use the W3C Trace Context to stitch spans all the way. Elastic also supports native OpenTelemetry (OTLP) ingest, so you can send traces from the OTel Collector straight into Elastic without translation.
Key Advantage
Powerful log ↔ trace correlation with search-first workflows—you can chase a slow span into raw logs, query with KQL/EQL, and come back to the trace timeline, all in one place. That combination of tracing plus Elastic’s search and visualization makes it easy to move from symptoms to the exact source of latency or errors.
Key Features
- End-to-end distributed tracing: Visualize full request journeys with spans and transactions tied together via W3C Trace Context.
- Trace UI & explorer: Waterfall timelines, impact-based sorting, and an experimental Trace Explorer with KQL/EQL queries.
- OpenTelemetry ingest: APM Server natively accepts OTLP (HTTP/gRPC), so your OTel Collector can ship traces directly.
- RUM and backend agents: Browser (RUM) and Node.js agents support distributed tracing across front-end and back-end hops.
- Serverless pricing option: Ingest- and retention-based pricing with optional egress and support tiers.
Pros
- Strong log–trace correlation with Kibana search
- Native OTLP ingest and W3C Trace Context support
- Flexible deployment: serverless, hosted, or self-managed
- Powerful KQL/EQL analytics across spans and transactions
Cons
- Complex to set up
- Learning curve
- Paid support is costly
Pricing at Scale
Elastic’s Serverless Observability pricing starts around $0.15/GB for ingest and $0.02/GB/month for retention. Egress beyond the free tier is $0.05/GB, premium support is an additional 5-15% of monthly spend, and synthetic monitoring is billed separately at $0.10 per 10,000 test runs.
Mid-sized scenario (45 TB/month ingest), estimated total: ≈ $17,435/month
Tech Fit
Elastic APM fits teams that already run ELK or want a search-first approach to troubleshooting—polyglot microservices on Kubernetes, front-end apps instrumented with RUM, and services emitting traces via OpenTelemetry. It’s a strong choice when deep log analytics and trace correlation live at the center of your workflow, and you’re comfortable with ingest + retention cost controls or operating Elastic in hosted/self-managed modes.
8. Honeycomb
Overview
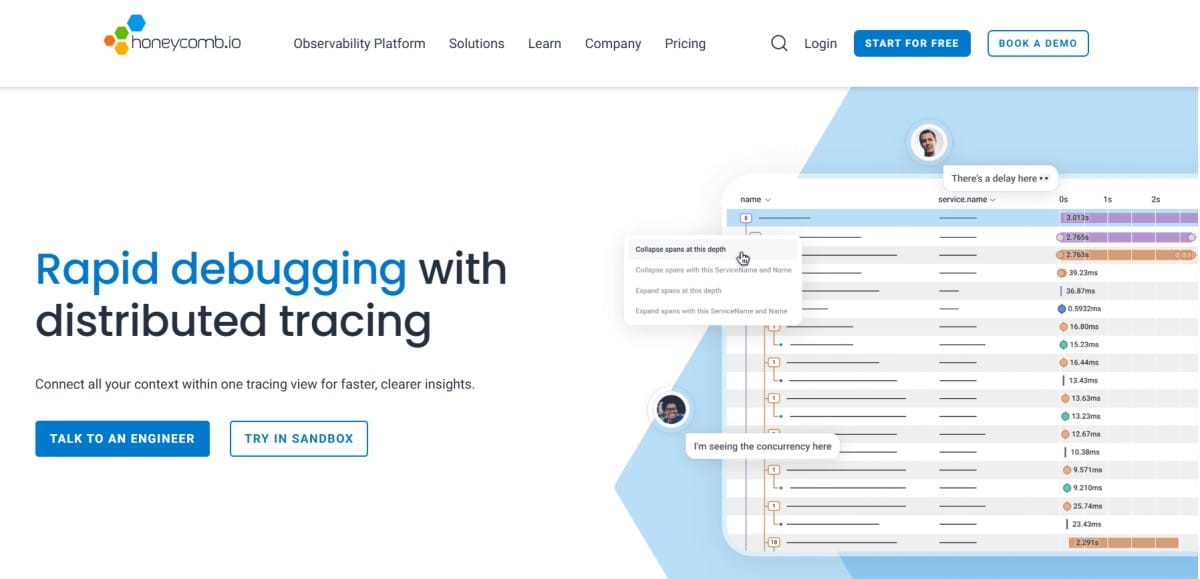
Honeycomb is an observability platform built around event-based distributed tracing, letting teams explore high-cardinality data interactively and follow a request across services with a fast trace UI, BubbleUp anomaly detection, and service maps. It’s popular with teams that want to ask ad-hoc questions of tracing data, slice by any field, and uncover patterns that metric dashboards often miss.
Key Advantage
Exploratory, query-anything tracing that treats every span field as a first-class dimension—engineers can pivot instantly from a slow trace to the exact attributes, users, regions, or endpoints involved, then visualize outliers with BubbleUp for rapid, data-driven debugging.
Key Features
- Distributed tracing with interactive exploration: Trace waterfalls, span inspection, and filters on any field to pinpoint bottlenecks.
- High-cardinality analytics: You can query each span field and build ad-hoc breakdowns, heatmaps, etc., without aggregating data beforehand.
- Tail-based sampling with Refinery: Keep the most valuable traces (errors, high latency) while controlling storage and costs.
- Service map and SLOs: Visualize service relationships and track user-impacting objectives alongside traces.
- OpenTelemetry support: Send OTLP directly, reuse your existing OTel collectors and instrumentation.
Pros
- Exceptional query-first UX for debugging distributed systems
- Powerful high-cardinality analysis and BubbleUp outlier detection
- Tail-based sampling option (Refinery) to keep “interesting” traces
- Solid OpenTelemetry support and modern developer ergonomics
Cons
- Can be expensive for smaller teams
- Learning curve
Pricing at Scale
Honeycomb Pro starts at $130/month and includes fixed event volume tiers (e.g., 100M, 450M, or 1.5B events/month) with 60-day retention; higher volumes move into Enterprise.
For 45TB/month of data ingestion, it can cost teams around $11,600/month
Tech Fit
Honeycomb fits teams that want a tracing-first, exploratory workflow for complex microservices, need to ask open-ended questions of high-cardinality span data, and are comfortable designing tail-based sampling policies; it works well across polyglot stacks with OpenTelemetry, Kubernetes, and modern cloud services, especially for engineering orgs that prioritize fast, iterative investigation over rigid, prebuilt dashboards.
How to Choose the Right Distributed Tracing Tool
1. Budget & Pricing Model
Pricing for tracing can vary wildly—some vendors charge per host, per span, or per GB ingested, while others add extra fees for retention and users. This makes forecasting costs a major challenge, especially at scale. If you’re a startup or SaaS provider, a flat per-GB model like CubeAPM’s is easier to manage, while enterprise tools like Datadog or Dynatrace may balloon in cost once ingestion grows. Always model a scenario (e.g., 10 TB/month) before committing.
2. Telemetry Standards (OpenTelemetry Support)
OpenTelemetry has become important for distributed tracing. Tools that natively ingest OTEL data help you avoid vendor lock-in and allow reuse of the same pipelines across multiple backends. When choosing a tool, ensure it doesn’t require proprietary agents only and that it supports context propagation standards like W3C Trace Context. This ensures long-term flexibility and easy migration if your needs change.
3. Deployment Model
Some teams are comfortable with SaaS observability, while others—particularly those in healthcare, finance, or government—require self-hosted or hybrid deployments for compliance. SaaS-first tools like Datadog may not fit regulated industries, while CubeAPM, Elastic APM, and SigNoz offer on-prem or cloud-hosted options. The right choice depends on whether data residency, latency, or vendor-managed convenience is your top priority.
4. Ecosystem Fit & Integrations
Distributed tracing only delivers value if it works with your full stack. Check for integration coverage across languages, frameworks, messaging systems, and cloud services. Tools like Datadog and CubeAPM offer 800+ integrations, while open-source platforms rely on OTEL compatibility for breadth. The closer a tool fits your environment (e.g., Kubernetes, AWS Lambda, or JVM-heavy apps), the faster adoption and value will be.
5. Compliance & Security
Data privacy regulations like GDPR, HIPAA, and PCI-DSS mean your tracing tool must provide strong access control, encryption, and clear data storage policies. SaaS platforms often store data globally, which may not meet residency requirements. If compliance is critical, consider vendors offering self-hosted deployments or region-specific storage. Always review how retention, deletion, and data usage policies align with your obligations.
6. Ease of Onboarding & Usability
Even the most powerful tracing system won’t help if your team struggles to adopt it. Look for tools with automatic instrumentation, clean dashboards, and intuitive workflows. Developer-first solutions like Sentry and CubeAPM emphasize quick setup, while enterprise suites like Dynatrace and Datadog can be overwhelming initially. Usability directly impacts incident response speed and the tool’s overall ROI.
Conclusion
Choosing the right distributed tracing tool is rarely simple. Teams struggle with unpredictable costs, steep learning curves, and limited flexibility in handling cloud-native and hybrid environments. Many tools lock customers into rigid pricing or force them into vendor-specific agents, leaving little room for customization.
This is where CubeAPM stands out as the best distributed tracing tool provider. With full OpenTelemetry support, seamless MELT observability, smart sampling, and 800+ integrations, CubeAPM delivers enterprise-grade tracing without the enterprise-level pricing. Its $0.15/GB pricing model ensures complete cost predictability.
Schedule a free demo to explore CubeAPM.
Disclaimer: The information in this article reflects the latest details available at the time of publication and may change as technologies and products evolve.
FAQs
1. What is the main benefit of using a distributed tracing tool?
Distributed tracing tools help teams follow requests across microservices, identify bottlenecks, and reduce mean time to resolution (MTTR). They’re essential for debugging modern, cloud-native systems where a single user request may touch dozens of services. Tools like CubeAPM make this easier with full OpenTelemetry support and seamless correlation across logs, metrics, and traces.
2. Why are costs a big issue with distributed tracing platforms?
Most tracing vendors charge per host, per span, or add fees for retention and features, which can quickly escalate at scale. This unpredictability frustrates teams. CubeAPM solves this with a $0.15/GB pricing model, ensuring cost transparency no matter how much you ingest.
3. Which tool is best for SMBs and startups for distributed tracing?
Startups need affordable, easy-to-deploy tools with predictable pricing. CubeAPM is ideal because it offers quick OTEL-based setup, 800+ integrations, and budget-friendly pricing. Open-source tools like SigNoz and Elastic APM are also good fits.
4. Can distributed tracing tools support compliance requirements?
Yes, but not all vendors do. SaaS-only providers may not meet data residency needs. CubeAPM, Elastic APM, and SigNoz allow self-hosting or region-specific deployment, giving organizations full control over sensitive trace data.
5. How do I choose between enterprise tools like Datadog or Dynatrace vs. CubeAPM?
Enterprise platforms like Datadog and Dynatrace offer deep features but come with higher complexity and cost. CubeAPM offers a more balanced approach: enterprise-grade distributed tracing, OpenTelemetry-native design, and ingestion-based pricing that makes it scalable for both startups and large enterprises.


