Modern DevOps teams are increasingly adopting open-source APM tools to gain transparency, flexibility, and control over their observability pipelines. Built on open standards like OpenTelemetry, these tools let developers instrument, visualize, and analyze performance data without being locked into proprietary ecosystems.
CubeAPM, though not open source, is fully aligned with open observability standards. It’s designed for teams that value the openness, extensibility, and interoperability of OSS tools—offering the same transparency and control powered by OpenTelemetry across metrics, logs, traces, and events.
In this guide, we’ll explore the top open-source APM tools in 2025, comparing their capabilities, open-source features, and technical fit—and see how CubeAPM empowers open-source-minded teams with open-standard observability.
Top 8 Open-Source APM Tools in 2025
- CubeAPM
- SigNoz
- Uptrace
- Apache SkyWalking
- Jaeger
- Zipkin
- Pinpoint
- Elastic APM
What Are Open Source APM Tools
Open-source APM (Application Performance Monitoring) tools are observability platforms whose source code is publicly available for developers to inspect, modify, and extend. They help teams monitor application performance, trace distributed systems, and analyze logs and metrics — all while maintaining full ownership of their data.
Unlike proprietary APM vendors that rely on closed architectures and tiered pricing models, open-source APM tools are built on community-driven, open standards such as OpenTelemetry, Prometheus, and Grafana. This allows engineers to instrument any language or framework, export telemetry data in standard formats, and integrate seamlessly with other monitoring or visualization tools.
Key characteristics of open-source APM tools include:
- Transparency: Full access to source code and data processing logic
- Interoperability: Support for open standards like OTLP, PromQL, and OpenMetrics
- Customization: Flexibility to extend dashboards, collectors, and alert pipelines
- Community-driven innovation: Frequent updates and integrations backed by global contributors
- Cost control: Self-managed deployments without per-host or per-agent licensing
Example: How CubeAPM Delivers OpenTelemetry Observability for Open-Source Teams

CubeAPM is built for developers who value the openness and flexibility of community-driven APM tools but want a unified, production-ready platform. Using the OpenTelemetry (OTLP) standard, it enables seamless collection of metrics, traces, and logs from any service or framework — without vendor-specific agents or closed data formats.
Instead of maintaining multiple components like Prometheus, Loki, or Tempo, CubeAPM consolidates them into a single observability layer covering the full MELT stack (Metrics, Events, Logs, and Traces). It natively integrates with OpenTelemetry Collectors, supports PromQL queries, and works smoothly with existing OSS dashboards like Grafana — making it instantly familiar for teams already invested in open-source observability.
For open-source-minded teams, CubeAPM delivers OpenTelemetry-native observability that’s transparent, interoperable, and extensible — bringing together the flexibility of open standards with the simplicity of a unified analytics platform.
Why Teams Choose Different Open Source APM Tools
Every engineering team’s observability journey is unique. While some prioritize control and data privacy, others focus on flexibility, community support, or cost efficiency. Below are the main reasons why teams choose different open-source APM solutions:
1. Control Over Data and Deployment
Open-source APM tools give organizations complete ownership of telemetry data. Teams can define retention policies, secure data within internal networks, and meet compliance requirements like GDPR or HIPAA—all without sending information to third-party clouds.
2. Custom Integrations and Extensibility
Built on open standards such as OpenTelemetry, Prometheus, and OpenMetrics, these tools integrate seamlessly with CI/CD pipelines, cloud platforms, and container orchestrators. Developers can extend functionality or build plugins tailored to their workflows.
3. Community-Driven Ecosystem
Projects like Jaeger, Grafana, and SigNoz thrive because of active global communities that contribute exporters, dashboards, and SDKs. This constant collaboration ensures rapid updates, new integrations, and transparent development.
4. Cost Transparency and Infrastructure Efficiency
Instead of per-host or per-agent licensing, open-source tools primarily incur infrastructure-level costs—storage, compute, and network. This model gives DevOps teams predictable spending as observability scales.
5. Architectural Flexibility
Open-source observability stacks can be fully modular. Teams can mix components like Prometheus for metrics, Tempo for traces, and Grafana for dashboards, creating a tailored solution that fits specific application and infrastructure needs.
6. Compliance and Security Control
For regulated industries such as healthcare, fintech, or government, open-source tools enable on-premise observability without exposing sensitive data. Teams can enforce internal security policies, control data residency, and audit telemetry pipelines end-to-end.
7. Freedom From Vendor Lock-In
By using open-source APMs based on universal standards like OTLP (OpenTelemetry Protocol), teams avoid being tied to a single commercial vendor. This freedom allows them to migrate workloads, change backends, or scale their infrastructure without re-instrumenting code.
Ultimately, choosing the right APM depends on each organization’s goals—whether they want maximum flexibility and control, or prefer a unified, open-standard experience like CubeAPM that reduces the overhead of managing multiple components.
Top 8 Open Source APM Tools
1. CubeAPM
Known For
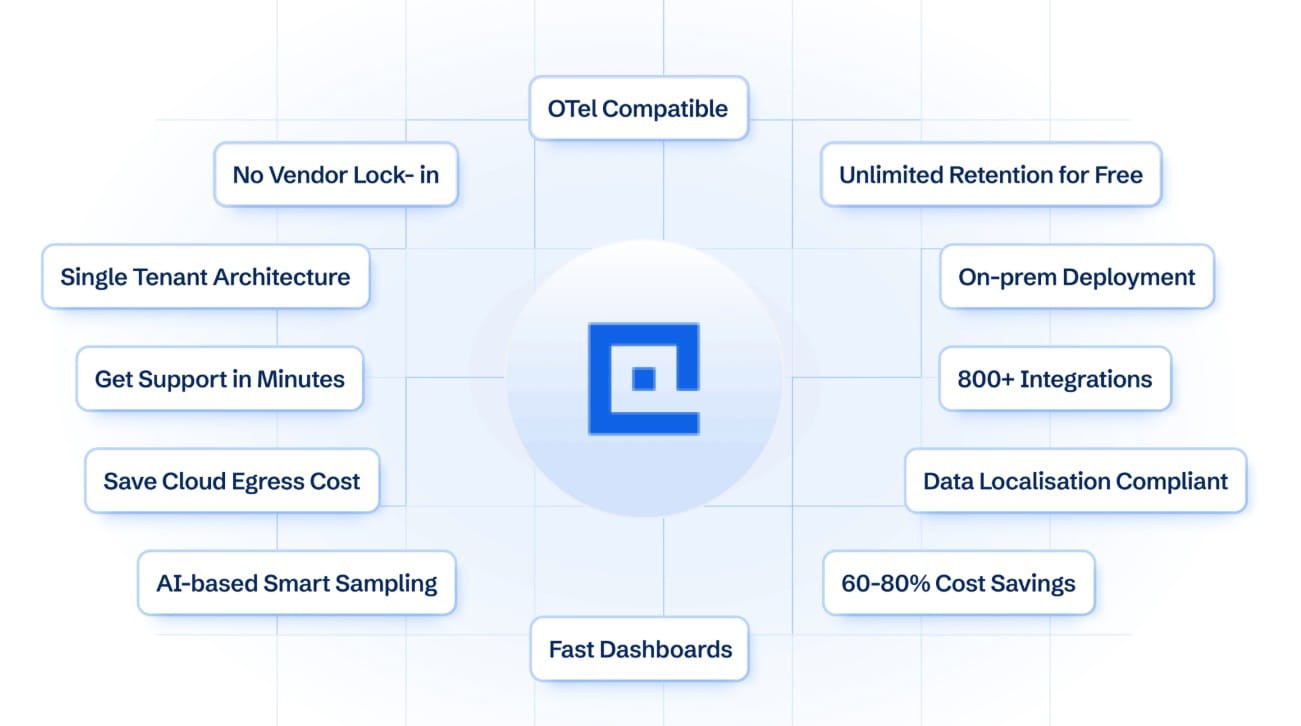
An OpenTelemetry-native observability platform built for teams that value the transparency and flexibility of open-source APM tools but need the power of a unified, enterprise-ready solution. CubeAPM combines metrics, logs, traces, and events into a single correlated view, helping teams detect issues faster while maintaining open data standards across their stack.
Open-Source Features
- Built entirely on OpenTelemetry and OTLP standards
- Supports PromQL and open APIs for data queries and dashboards
- Compatible with OSS exporters like Loki, Tempo, and Fluent Bit
- Allows data portability with open formats for external storage
- Extensible through collector pipelines and SDK integrations
Key Features
- Unified MELT observability
- Correlated metrics, logs, and traces
- AI-powered anomaly detection
- Real-time alerts via Slack or Teams
- Auto-instrumentation for major languages
Pros
- Fully aligned with open observability standards
- Integrates easily with existing OSS tools
- Vendor-neutral and OpenTelemetry-compliant
- Simple to deploy and scale
Cons
- Not open source (closed-core model)
- Requires tuning for large-scale AI insights
- Smaller plugin community than long-standing OSS tools
Pricing
Flat-based pricing of 0.15/GB
CubeAPM Pricing at Scale for Open-Source-Minded Teams
*All pricing comparisons are calculated using standardized Small/Medium/Large team profiles defined in our internal benchmarking sheet, based on fixed log, metrics, trace, and retention assumptions. Actual pricing may vary by usage, region, and plan structure. Please confirm current pricing with each vendor.
For a mid-sized SaaS company ingesting 45TB(~45,000) total monthly data ingestion and 45,000TB of observability data outcharged by the cloud provider, the total cost will be about ~$7200/month.
Tech Fit
CubeAPM fits perfectly for DevOps, SRE, and platform teams that rely on open-source observability stacks but want centralized correlation and automated insights. It’s an excellent choice for organizations modernizing from Prometheus + Grafana + Jaeger setups to a unified, OpenTelemetry-native APM that maintains open data compatibility while simplifying daily operations.
2. SigNoz
Known For
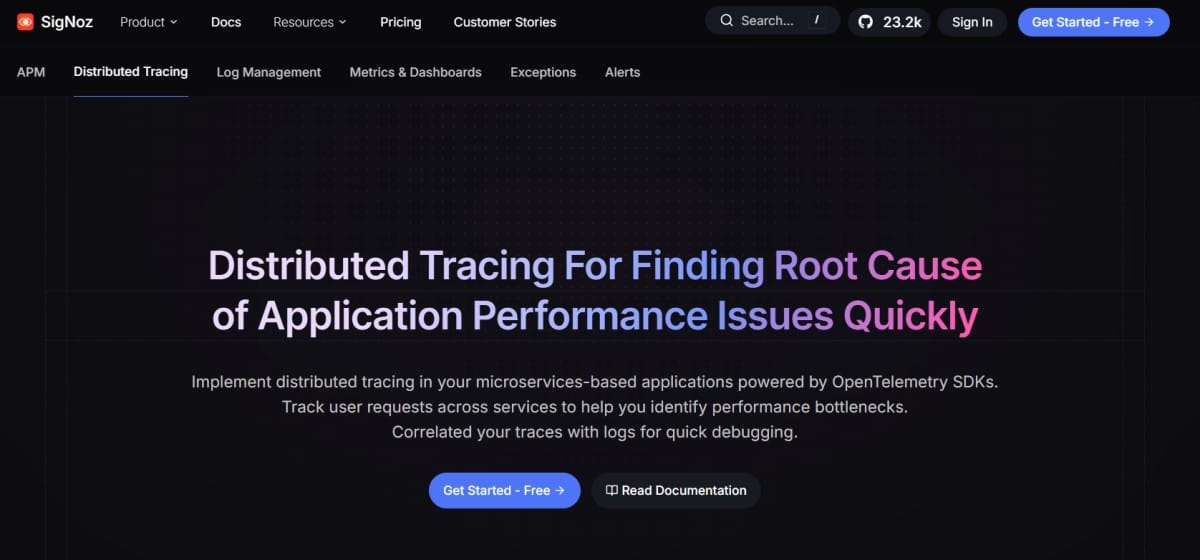
A fully open-source APM and observability platform built on OpenTelemetry, offering unified visibility into metrics, traces, and logs. SigNoz is known as one of the most robust community-driven alternatives to commercial APMs, helping developers monitor distributed systems without vendor lock-in.
Open-Source Features
- 100% open-source under the Apache 2.0 license
- Built on OpenTelemetry for standard instrumentation
- Supports both self-hosted and cloud-managed deployments
- Active community contributing exporters and dashboards
- Integrates with ClickHouse, Grafana, and Kafka for scalable data storage
Key Features
- Unified observability for metrics, traces, and logs
- Real-time service maps and performance dashboards
- Latency, error rate, and throughput tracking
- Custom dashboards for business KPIs
- Trace filtering and log correlation
Pros
- Completely open-source with transparent roadmap
- Easy to self-host using Docker or Kubernetes
- Active Slack and GitHub community
- Supports high-volume telemetry ingestion
Cons
- Self-hosted version requires manual scaling and tuning
- UI customization limited compared to Grafana
- Retention and storage need careful resource planning
Pricing
SigNoz is free for self-hosted use. The team also offers SigNoz Cloud, a managed version that charges per GB ingested or per metric sample stored.
SigNoz Pricing at Scale for Open-Source-Minded Teams
For open-source-minded teams running the self-hosted edition, SigNoz is entirely free to use—no licensing or usage fees apply. The only costs are for your infrastructure (servers, storage, and compute).
For a mid-sized SaaS company that ingests 25,000GB of data by APM hosts, 10,000GB of data by infra hosts, 10,000GB of data by log hosts, and 45,000GB of observability data out(charged by cloud provider), the cost would be around ~$16,000.
Tech Fit
SigNoz is perfect for startups, DevOps teams, and open-source advocates who want full data ownership, transparent instrumentation, and the flexibility to customize their observability stack. It’s best for organizations already using OpenTelemetry and comfortable managing their own infrastructure while benefiting from a thriving OSS community.
3. Uptrace

Known For
An open-source distributed tracing and APM platform built on OpenTelemetry and ClickHouse, offering unified visibility into traces, metrics, and logs. Uptrace is known for its lightweight setup, modern UI, and low-resource footprint, making it a favorite among developers who want simplicity without sacrificing performance.
Open-Source Features
- Licensed under AGPLv3, free for self-hosting
- Built on OpenTelemetry for standard instrumentation
- Stores telemetry data in ClickHouse for high-speed queries
- Compatible with Grafana and Prometheus exporters
- Offers configurable retention and sampling settings
Key Features
- Distributed tracing with span timelines
- Metrics visualization using built-in dashboards
- Error tracking and performance bottleneck detection
- ClickHouse-based backend for fast analytics
- REST and gRPC APIs for data ingestion
Pros
- Fully open-source and self-hostable
- Easy to deploy and maintain
- Low resource usage compared to larger OSS stacks
- Great performance with ClickHouse backend
Cons
- Limited ecosystem compared to SigNoz or Grafana
- Requires manual scaling for large environments
- Smaller community and documentation base
Pricing
Uptrace is free for self-hosted deployments under the AGPL license. A hosted Uptrace Cloud service is also available with pay-as-you-go pricing.
Uptrace Pricing at Scale for Open-Source-Minded Teams
The self-hosted Uptrace edition is free under its AGPL license. Infrastructure for ClickHouse and S3-compatible storage typically runs $200–$500/month at a 10 TB/month ingestion volume.
The managed Uptrace Cloud plan charges roughly $0.25 per GB. For an application ingesting ~45,000 GB/month of traces and logs under the $1,000 plan ($0.05/GB), and maintaining around 3 million active time series under the $2,000 metrics plan ($0.60 per 1k series), the total monthly cost comes to approximately $8,500/month (45,000 GB × $0.05 + 3,000,000 / 1,000 × $0.60).
Tech Fit
Uptrace suits smaller DevOps teams, open-source adopters, and developers seeking a simple, self-hosted tracing platform that’s fully compatible with OpenTelemetry. It’s ideal for organizations that want to start with distributed tracing and expand into full observability using open standards.
4. Apache SkyWalking
Known For
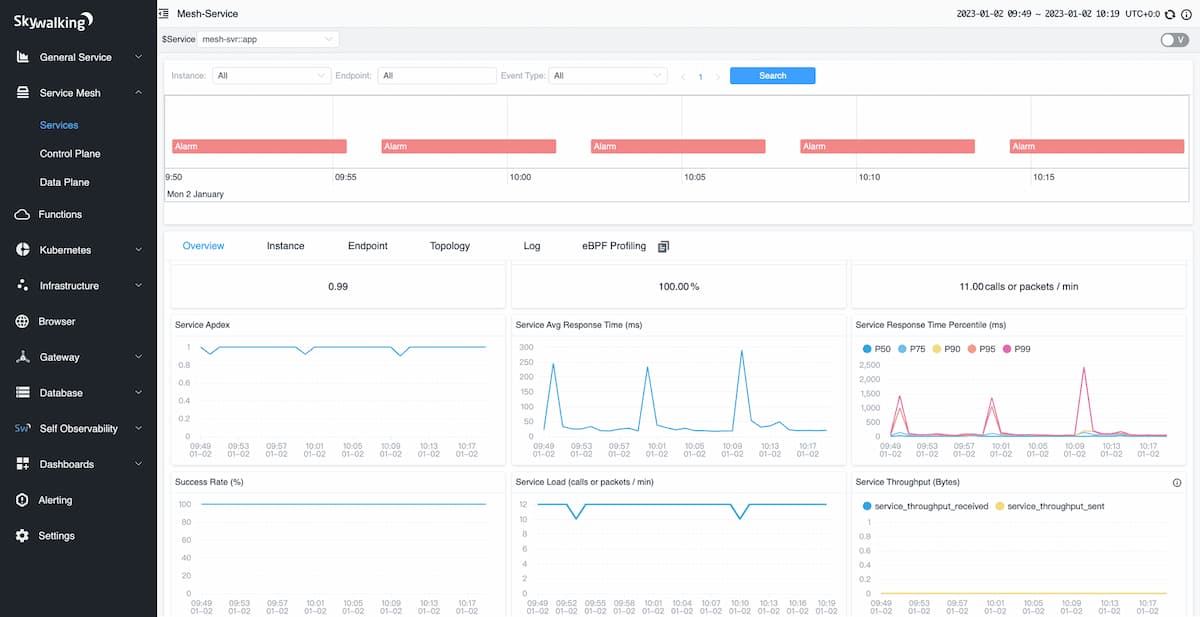
A powerful open-source APM, observability, and service mesh monitoring platform from the Apache Software Foundation. Apache SkyWalking is widely used for tracking distributed systems, visualizing service topology, and analyzing performance metrics at scale across multi-language microservices.
Open-Source Features
- 100% open source under the Apache 2.0 license
- Native OpenTelemetry and Zipkin protocol support
- Provides trace, metrics, and log correlation
- Supports self-hosted deployments and cloud-native agents
- Extensible through plugin architecture and community integrations
Key Features
- End-to-end distributed tracing
- Real-time service topology and dependency maps
- Performance analytics with customizable dashboards
- Multi-language agent support (Java, Go, Node.js, Python)
- Alerting and rule-based anomaly detection
Pros
- Mature Apache project with strong community backing
- Deep integration with service meshes and gateways
- Highly extensible with custom collectors and backends
- Scales well for enterprise workloads
Cons
- Complex deployment compared to lightweight tools
- UI less modern than SigNoz or CubeAPM
- Steeper learning curve for new users
Pricing
Apache SkyWalking is completely free and open source — no license or usage fees. Costs apply only to infrastructure hosting (VMs, containers, or Kubernetes clusters).
Apache SkyWalking Pricing at Scale for Open-Source-Minded Teams
As an Apache 2.0 project, Apache SkyWalking is free to use and self-host. Running a production cluster handling 10 TB/month of telemetry typically incurs $200–$700/month in infrastructure costs for storage and compute (Elasticsearch or BanyanDB).
Some vendors offer hosted SkyWalking services with pricing comparable to other managed APMs—around $0.20–$0.25 per GB, or roughly $2,000–$2,500/month at this scale.
Tech Fit
SkyWalking fits enterprise DevOps teams, service mesh users, and cloud-native architects who need comprehensive observability and topology visualization in fully open-source form. It’s ideal for organizations standardizing on OpenTelemetry and service mesh observability without relying on commercial vendors.
5. Jaeger
Known For
A CNCF-graduated open-source distributed tracing system created by Uber Technologies. Jaeger helps developers monitor and troubleshoot transactions in complex microservices architectures by visualizing request flows and identifying latency bottlenecks. It’s one of the most widely adopted tracing backends in the OpenTelemetry ecosystem.
Open-Source Features
- 100% open source under the Apache 2.0 license
- Natively compatible with OpenTelemetry and Zipkin protocols
- Provides self-hosted deployment using Docker or Kubernetes
- Integrates with Prometheus, Grafana, and Elasticsearch
- Backed by a large CNCF community and continuous updates
Key Features
- Distributed tracing for microservices
- Root cause and latency analysis
- Service dependency and topology mapping
- Sampling and adaptive trace collection
- Storage via Elasticsearch, Cassandra, or Kafka
Pros
- CNCF-graduated, battle-tested tracing platform
- Vendor-neutral and OpenTelemetry-aligned
- Simple to deploy and extend
- Works well with Prometheus and Grafana
Cons
- Focused mainly on tracing (no built-in metrics or logs)
- Limited visualization options out of the box
- Requires additional tools for full observability
Pricing
Jaeger is completely free and open source. The only cost is maintaining your infrastructure (e.g., storage, compute, and container orchestration).
Jaeger Pricing at Scale for Open-Source-Minded Teams
The open-source Jaeger project is free for self-hosting under the Apache 2.0 license. Teams running 10 TB/month typically spend $250–$600/month on infrastructure, depending on the chosen storage backend (Elasticsearch, Cassandra, or Kafka).
For managed Jaeger services offered by third-party providers, costs average $0.20–$0.25 per GB, translating to $2,000–$2,500/month for equivalent ingestion and retention levels.
Tech Fit
Ideal for developers, DevOps teams, and SREs looking for lightweight, OpenTelemetry-compatible distributed tracing. Jaeger is best for teams who already use Prometheus or Grafana and want to add end-to-end trace visibility to their open-source observability stack without adopting a commercial APM.
6. Zipkin
Known For
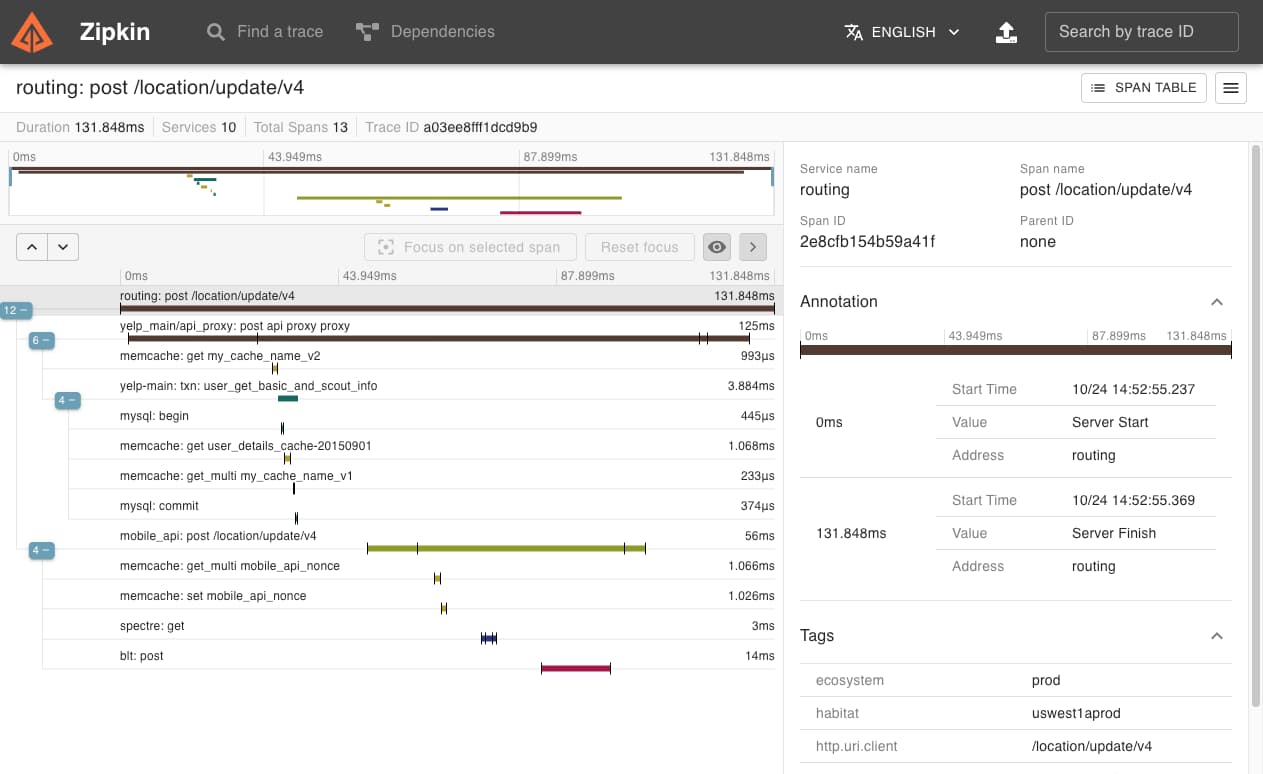
A lightweight open-source distributed tracing system originally developed at Twitter. Zipkin focuses on simplicity and speed, helping developers trace requests across microservices, identify latency issues, and optimize performance with minimal setup and resource usage.
Open-Source Features
- 100% open source under the Apache 2.0 license
- Built-in OpenTelemetry and Brave instrumentation support
- Compatible with multiple storage backends (MySQL, Elasticsearch, Cassandra)
- Easy to deploy via Docker or Kubernetes
- Strong community adoption and active maintenance
Key Features
- End-to-end request tracing
- Low-overhead data collection and visualization
- REST and gRPC APIs for data ingestion
- Dependency and latency graphs
- Plugin support for storage and reporting
Pros
- Simple architecture and low resource usage
- Easy to integrate with existing services
- Active open-source ecosystem
- Perfect for small to mid-sized microservice environments
Cons
- Limited features compared to full APM suites
- No native metrics or logs correlation
- Basic UI with limited customization
Pricing
Zipkin is completely free and open source with no license fees or paid tiers.
Zipkin Pricing at Scale for Open-Source-Minded Teams
Self-hosting Zipkin remains completely free under Apache 2.0; only infrastructure costs apply. A 10 TB/month deployment typically consumes $150–$400/month in storage and compute resources.
When integrated as a managed tracing backend within hosted observability platforms, costs align with similar pricing tiers—about $0.20 per GB, or $2,000/month for a 10 TB/month workload.
Tech Fit
Zipkin is perfect for developers, startups, and small DevOps teams seeking fast, lightweight distributed tracing without complex dependencies. It’s an excellent choice for open-source ecosystems already using Spring Boot, OpenTelemetry, or Prometheus, and for teams that want a no-frills tracing backend they can fully control.
7. Pinpoint

Known For
A distributed tracing and APM tool designed for large-scale, production-grade systems. Pinpoint is one of the most advanced open-source APMs for monitoring Java, Python, and PHP applications, offering deep visibility into service dependencies, transaction flows, and bottlenecks — all without modifying source code.
Open-Source Features
- Fully open source under Apache 2.0 license
- Supports Java, Python, PHP, and Spring Boot frameworks
- Collects data using lightweight agents with no code changes
- Visualizes call trees, spans, and dependency graphs
- Self-hosted with Docker, Helm, or Kubernetes support
Key Features
- Application topology visualization
- Real-time transaction tracing
- JVM and resource monitoring
- Asynchronous call tracking
- Service map and alarm configuration
Pros
- Complete open-source APM with full-stack visibility
- Excellent for JVM-based microservices
- Mature project with active community updates
- Offers real production-scale performance metrics
Cons
- Setup complexity for large clusters
- UI less intuitive than modern APMs
- Limited support for non-Java languages
Pricing
Pinpoint is completely free and open source — no license or commercial version exists. Costs only apply to the infrastructure required to deploy collectors, agents, and backend storage.
Pinpoint Pricing at Scale for Open-Source-Minded Teams
The open-source Pinpoint APM is free to self-host and commonly used in JVM-heavy environments. Infrastructure for agents, collectors, and databases runs $300–$700/month at 10 TB/month of telemetry ingestion.
For teams using hosted Pinpoint instances through service providers, pricing averages $0.25 per GB, bringing monthly costs to around $2,500 (10 000 GB × $0.25).
Tech Fit
Pinpoint is best suited for enterprise DevOps teams, backend engineers, and JVM-heavy organizations that need detailed APM visibility across high-traffic environments. It’s particularly valuable for Java or Spring Boot ecosystems, offering rich diagnostics and topology mapping with minimal runtime overhead.
8. Elastic APM
Known For
Part of the Elastic Stack (ELK), Elastic APM provides powerful performance monitoring and tracing capabilities integrated with Elasticsearch, Logstash, and Kibana. It’s popular among developers who already use the ELK stack for log analytics and want to extend it into full application observability.
Open-Source Features
- Core components released under the Elastic License and SSPL (source-available)
- Supports OpenTelemetry ingestion for vendor-neutral data collection
- Provides self-hosted APM Server for metrics and trace storage
- Integrates seamlessly with Elasticsearch and Kibana dashboards
- Agents available for Java, Python, Node.js, Go, and Ruby
Key Features
- Distributed tracing and transaction breakdowns
- Error tracking and service performance metrics
- Centralized logging with APM correlation
- Machine learning–based anomaly detection
- Pre-built dashboards for quick visualization
Pros
- Strong visualization and analytics through Kibana
- Unified logs, metrics, and traces under one platform
- Mature ecosystem with robust documentation
- Integrates easily into existing ELK deployments
Cons
- License is not fully open source (Elastic License, not Apache 2.0)
- Heavy on resources for large-scale deployments
- Complex setup and scaling for multi-node clusters
Pricing
Elastic APM is free to use in the self-hosted basic tier. Advanced features like machine learning and extended retention are available in paid tiers or Elastic Cloud.
Elastic APM Pricing at Scale for Open-Source-Minded Teams
The self-hosted Basic Tier of Elastic APM is free, but running 10 TB/month of traces and metrics generally costs $400–$900/month in infrastructure for Elasticsearch and Kibana clusters.
On Elastic Cloud, the managed service charges usage-based rates that typically total $2,500–$3,000/month at 10 TB ingestion, depending on data retention, machine-learning usage, and region.
Tech Fit
Elastic APM is ideal for teams already using the ELK Stack who want to extend into APM and tracing. It’s a strong fit for organizations seeking integrated observability across logs, metrics, and traces, and for open-source users comfortable managing Elasticsearch clusters for large-scale analytics.
Conclusion
Choosing the right open-source APM tool depends on how much control, scalability, and automation your team needs. Tools like SigNoz, Uptrace, Jaeger, and SkyWalking offer transparency and flexibility, but they often require complex setups, scaling strategies, and constant infrastructure tuning to stay reliable at high volumes.
For engineering teams who value open standards and interoperability but want to skip the overhead of managing multiple OSS components, CubeAPM bridges the gap perfectly. Built entirely on OpenTelemetry, it delivers the same freedom, extensibility, and vendor neutrality that open-source users expect—combined with the simplicity of a unified, production-ready observability platform.
Whether you’re scaling microservices, optimizing latency, or consolidating monitoring across distributed systems, CubeAPM gives open-source-minded teams the reliability of an enterprise platform with the openness of community-driven observability.
Disclaimer: The information in this article reflects the latest details available at the time of publication and may change as technologies and products evolve.
FAQs
1. What are open-source APM tools?
Open-source APM tools help developers monitor performance, trace distributed systems, and analyze logs in real time without relying on closed platforms. Solutions like SigNoz or CubeAPM use open observability standards such as OpenTelemetry, giving teams visibility, interoperability, and complete control over their data.
2. Are open-source APM tools completely free to use?
Yes, most open-source APMs are free to download and self-host. However, they still require infrastructure for data storage and maintenance. Tools like CubeAPM, while not open source, provide the same OpenTelemetry-based flexibility as free OSS tools—without the hosting or scaling complexity.
3. Which is the best open-source APM tool in 2025?
CubeAPM and SigNoz stand out as top choices. SigNoz offers a fully open-source stack, while CubeAPM delivers open-source-level transparency with enterprise simplicity. Both support OpenTelemetry, but CubeAPM adds unified dashboards, MELT coverage, and automation for faster troubleshooting.
4. How does CubeAPM differ from open-source APM tools?
CubeAPM is built entirely on OpenTelemetry, the same foundation that powers open-source tools like Uptrace. The difference lies in simplicity—CubeAPM combines metrics, logs, traces, and events in one platform, removing the need to maintain multiple OSS components while keeping observability fully open-standard.
5. What should teams consider before adopting an open-source APM tool?
Teams should evaluate scalability, maintenance effort, and data retention needs. Tools like CubeAPM offer a balanced path—giving open-source-minded teams OpenTelemetry compatibility and data transparency, but without the manual setup, patching, and infrastructure tuning required by tools like SkyWalking.


