Python powers everything from SaaS platforms and fintech systems to APIs built on Django, Flask, and FastAPI. Over 54% of professional developers report using Python extensively, making its performance monitoring critical for modern applications. Teams need observability that ties logs, metrics, traces, and errors directly back to their Python code.
CubeAPM is the ideal APM solution for monitoring Python applications. With Django ORM query insights, Celery task tracking, and async request tracing for FastAPI and aiohttp, smart sampling and flat $0.15/GB pricing, CubeAPM gives Python teams full-stack clarity without unpredictable costs.
In this guide, we’ll explore the Top 8 Python monitoring tools. You’ll see how each platform handles common Python challenges —We’ll compare features, while also showing how CubeAPM stacks up against incumbents like Datadog, New Relic, and Dynatrace.
Top 8 Python Monitoring Tools
- CubeAPM – Best for Python-first enterprises needing affordable, full-stack monitoring
- Datadog – Best for enterprises invested in Datadog’s ecosystem with wide integrations.
- New Relic – Best for large teams needing mature observability despite high pricing.
- Dynatrace – Best for enterprises seeking AI-driven monitoring and automated analysis.
- Sentry – Best for developers focused on real-time Python error tracking.
- SigNoz – Best for teams preferring an open-source, OpenTelemetry-based stack.
- Uptrace –Best for Python teams wanting an OpenTelemetry-native APM.
- Middleware – Best for cloud-native Python teams needing affordable full-stack monitoring
What is Python Application Monitoring?
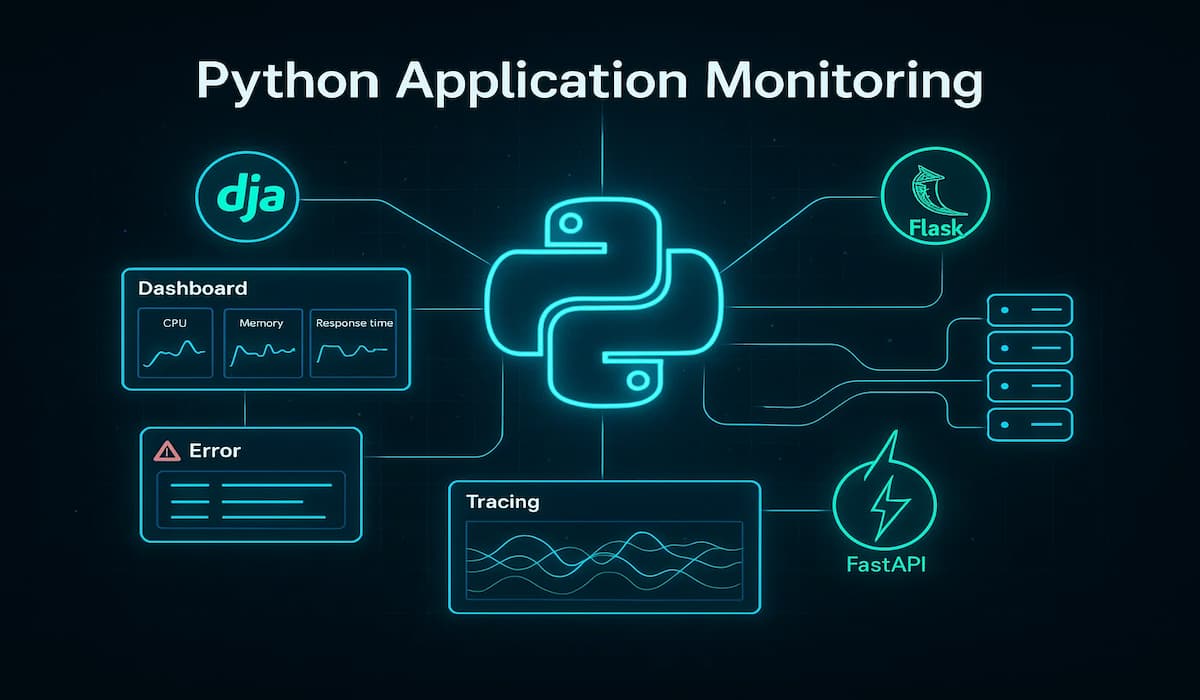
Python application monitoring is the practice of observing, measuring, and analyzing the behavior of Python applications in real time. It focuses on keeping web services, APIs, and backend systems built with frameworks like Django, Flask, and FastAPI reliable and performant.
Effective Python monitoring helps teams:
- Detect bottlenecks caused by the Global Interpreter Lock (GIL).
- Trace async requests across microservices.
- Identify slow queries in Django ORM or SQLAlchemy.
- Catch exceptions and stack traces before they impact users.
- Monitor background jobs from Celery or RQ.
- Correlate infrastructure signals with application performance.
In short, Python application monitoring ensures developers can find, fix, and prevent issues faster — keeping APIs, web services, and enterprise apps running smoothly.
Example: How CubeAPM Handles Python Application Monitoring
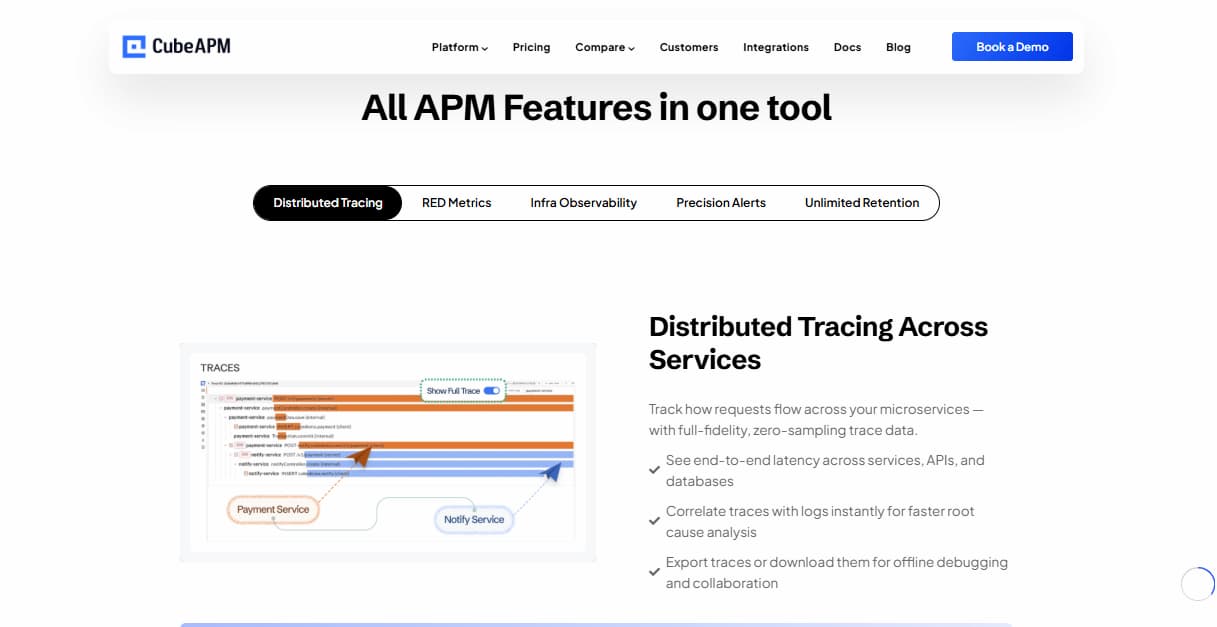
CubeAPM uses a combination of instrumentation, smart data collection, and observability primitives (metrics, logs, traces, errors) to give Python applications full visibility. Here’s how it works in practice for a Python setup:
Key Components for Python Monitoring
- Instrumentation via OpenTelemetry: CubeAPM supports the OpenTelemetry Protocol (OTLP) natively. This means your Python app (Django, Flask, FastAPI, Celery, etc.) can be instrumented using OpenTelemetry SDKs to send traces, metrics, and logs directly to CubeAPM. Sample apps are also available that demonstrate how to instrument Python code manually or via framework-specific agents.
- New Relic Agent Compatibility: If your Python app is already using New Relic agents, CubeAPM allows you to redirect the New Relic agent’s telemetry to CubeAPM by setting environment variables. This ensures you don’t have to rip out existing instrumentation.
- Smart Sampling & Contextual Prioritization: Because high-volume telemetry (especially traces) can get costly and noisy, CubeAPM employs “smart sampling.” It uses context (e.g., latency of requests, error states) to decide which traces or events are more important to retain. This helps keep noise down and the signal strong.
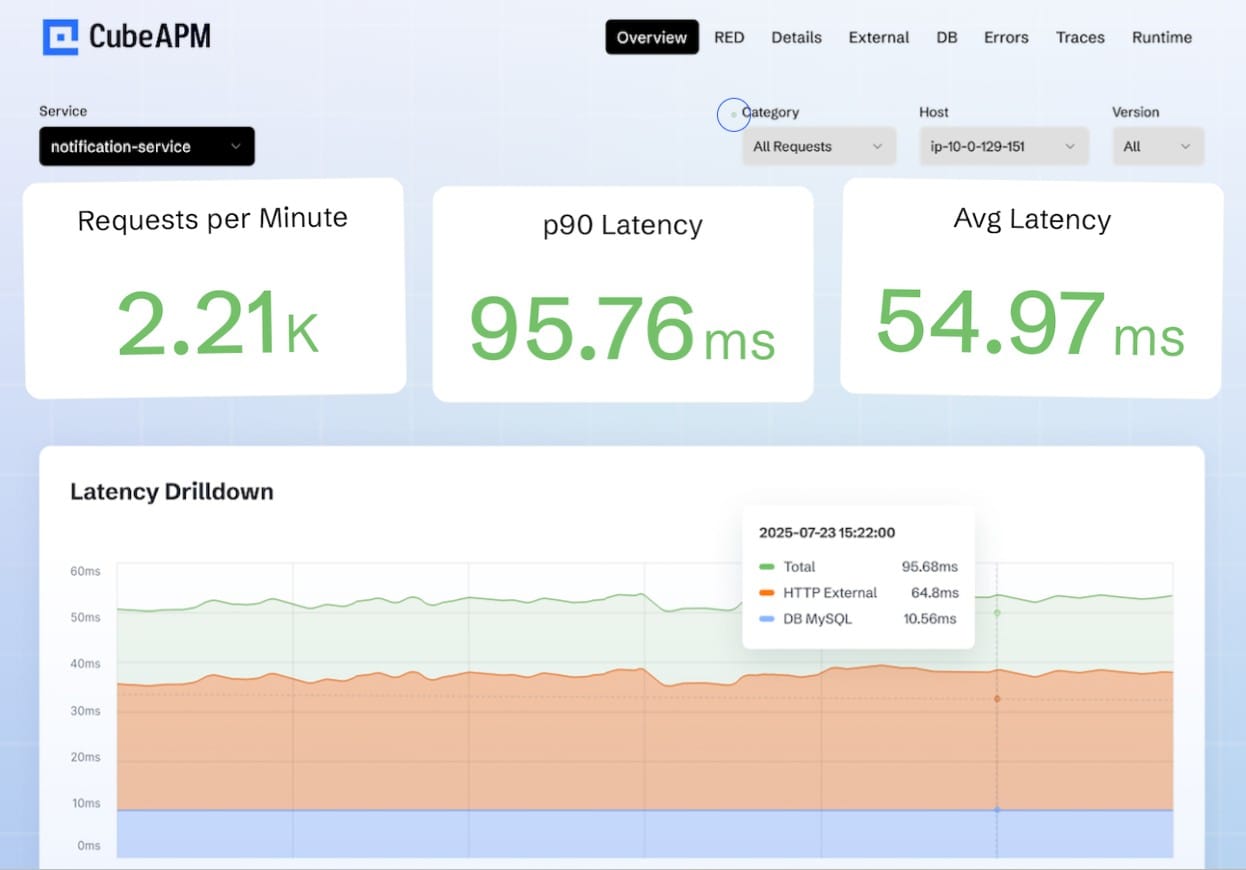
- Dashboarding & Alerts: For Python apps, CubeAPM provides dashboards showing key metrics like latency, error rate, and throughput. It also offers breakdowns of external HTTP calls and database latencies, making it easier to pinpoint bottlenecks. Errors are grouped by endpoint/type with stack traces attached, while alerts can be configured to trigger via Slack, PagerDuty, or other channels.
- Infrastructure Monitoring: CubeAPM also monitors infrastructure components relevant to Python services, such as Redis, MySQL, Kubernetes, and Nginx. This helps correlate application performance with underlying infrastructure issues.
- Configurable Retention & Deployment Flexibility: CubeAPM allows customization of trace, log, and metric retention periods. It can be self-hosted on your infrastructure or deployed via containers, Kubernetes, or virtual machines. Configuration is flexible via environment variables, configuration files, or the command line.
Why Teams Choose Different Python Monitoring Tools
Python teams have diverse needs depending on their size, architecture, and growth stage. A single monitoring tool rarely fits everyone — some prioritize debugging speed, others compliance, and others cost control. This is why different monitoring platforms have emerged, each solving a specific part of the observability puzzle.
1. Error Tracking and Debugging
Some teams focus on catching errors quickly rather than full observability. Tools like Sentry are chosen because they surface Python exceptions, stack traces, and regression alerts in real time. This is especially useful for smaller teams that need fast debugging without heavy infrastructure costs.
2. Distributed Tracing and Performance
For microservices and async Python workloads, distributed tracing is critical. Frameworks like FastAPI and Celery generate complex request flows, so teams pick tools like Uptrace or SigNoz that are OpenTelemetry-native and optimized for tracing performance bottlenecks across services.
3. Scalability and Compliance
Enterprises prioritize compliance frameworks (HIPAA, GDPR) and predictable scaling across terabytes of data. Vendors like Dynatrace and New Relic are often selected for their enterprise add-ons, though many are turning to CubeAPM for flat pricing and self-hosted deployment flexibility.
4. Cost Predictability
Monitoring costs can spiral when log or trace volumes spike. Some teams move away from host-based billing (Datadog, New Relic) and adopt transparent ingestion-based models like CubeAPM or Middleware to avoid unpredictable invoices while scaling Python apps.
5. Ecosystem and Integrations
Choice also depends on ecosystem fit. Teams already invested in large observability platforms may prefer Datadog or Dynatrace for seamless integration with existing infra. On the other hand, Python-first startups often choose tools like CubeAPM that emphasize developer-friendly support and direct integrations with Django, Flask, and FastAPI.
6. Deployment Flexibility
Some organizations need monitoring in a hybrid or on-premise environment due to data residency or security rules. Self-hosted tools like CubeAPM and SigNoz offer deployment flexibility, while SaaS-only solutions may not meet these requirements.
7. Developer Experience
Ease of setup and usability often guide tool selection. Developer-first platforms like CubeAPM and Sentry are popular because they minimize setup friction, integrate with Python logging libraries, and offer modern UIs that shorten the learning curve.
Top 8 Tools for Python Application Monitoring
1. CubeAPM
Known for
CubeAPM is known for being a cost-efficient, Python-friendly APM solution built around OpenTelemetry. It delivers end-to-end observability across logs, metrics, traces, and errors while providing deep integrations for Python frameworks such as Django, Flask, FastAPI, and Celery. With smart sampling and flat pricing, it has become a popular choice for enterprises that want predictable bills and developers who need fast insights without unnecessary complexity.
Python Application Monitoring Features
- Django ORM query insights
- Celery task/job monitoring
- Async request tracing (FastAPI, aiohttp)
- Error and exception stacktrace capture
- Correlation of infra logs/traces with Python code
Key Features
- Distributed tracing, log monitoring, error tracking
- Synthetic and real user monitoring
- Service maps and dashboards with custom metrics
- Security and compliance-ready deployment (cloud or on-prem)
Pros
- Affordable at scale with flat ingestion pricing
- Smart sampling keeps only meaningful traces
- Compliance-ready with self-host options
- Developer-friendly Slack/WhatsApp support
Cons
- Younger ecosystem compared to legacy players
- Fewer third-party marketplace add-ons
Pricing
- Flat pricing model: $0.15/GB for data ingestion (covering logs, traces, and errors)
CubeAPM Python Application Monitoring Pricing at Scale
*All pricing comparisons are calculated using standardized Small/Medium/Large team profiles defined in our internal benchmarking sheet, based on fixed log, metrics, trace, and retention assumptions. Actual pricing may vary by usage, region, and plan structure. Please confirm current pricing with each vendor.
For a mid-sized SaaS company ingesting 45TB(~45,000) total monthly data ingestion and 45,000TB of observability data outcharged by the cloud provider, the total cost will be about ~$7200/month.
Techfit
CubeAPM is a strong fit for Python-first enterprises and growing startups that need reliable APM without surprise bills. It works especially well for teams running Django APIs, FastAPI services, or Celery background jobs in production. Enterprises in finance, e-commerce, and SaaS can benefit from its compliance-friendly hosting options and predictable cost model, while engineering teams appreciate the developer-first support channels and easy migration from legacy tools.
2. Datadog
Known for
Datadog is one of the most established observability platforms, widely adopted by enterprises that need a unified solution across infrastructure, APM, logs, security, and synthetics. It’s known for its broad ecosystem of 900+ integrations, automatic instrumentation, and strong feature coverage. For Python developers, Datadog provides a mature agent that supports frameworks like Django, Flask, and FastAPI, along with profiling and distributed tracing.
Python Application Monitoring Features
- Auto-instrumentation for Python frameworks (Django, Flask, FastAPI)
- Async request tracing and span visualization
- Correlation of logs, metrics, and traces for Python services
- CPU and memory profiling for Python code
Key Features
- Infrastructure and container monitoring with host-based billing
- Real user monitoring and synthetic testing
- ML-powered anomaly detection and advanced alerting
- Wide marketplace of integrations
Pros
- Extremely feature-rich with enterprise-grade modules
- Large ecosystem and community adoption
- Strong Python profiling and tracing capabilities
Cons
- Pricing grows steeply with increase in data volume
- Overwhelming UI for new users
Pricing
- APM (Pro Plan): $35/host/month
- Infra (Pro Plan): $15/host/month
- Ingested Logs: $0.10 per ingested or scanned GB per month
Datadog Python Application Monitoring Pricing at Scale
For a mid-sized SaaS company operating 125 APM hosts, 40 profiled hosts, 100 profiled container hosts, 200 infrastructure hosts, 1.5 million container hours, 300,000 custom metrics, 500 million indexed spans, and 3,500 indexed logs, while ingesting approximately 10 TB (≈10,000 GB) of logs per month, the estimated monthly cost would be around $27,475.
Techfit
Datadog is best suited for large enterprises with complex ecosystems that need everything from infra monitoring to application tracing in a single platform. It’s a good fit if your team values deep integrations, extensive dashboards, and machine-learning alerts.
3. New Relic
Known for
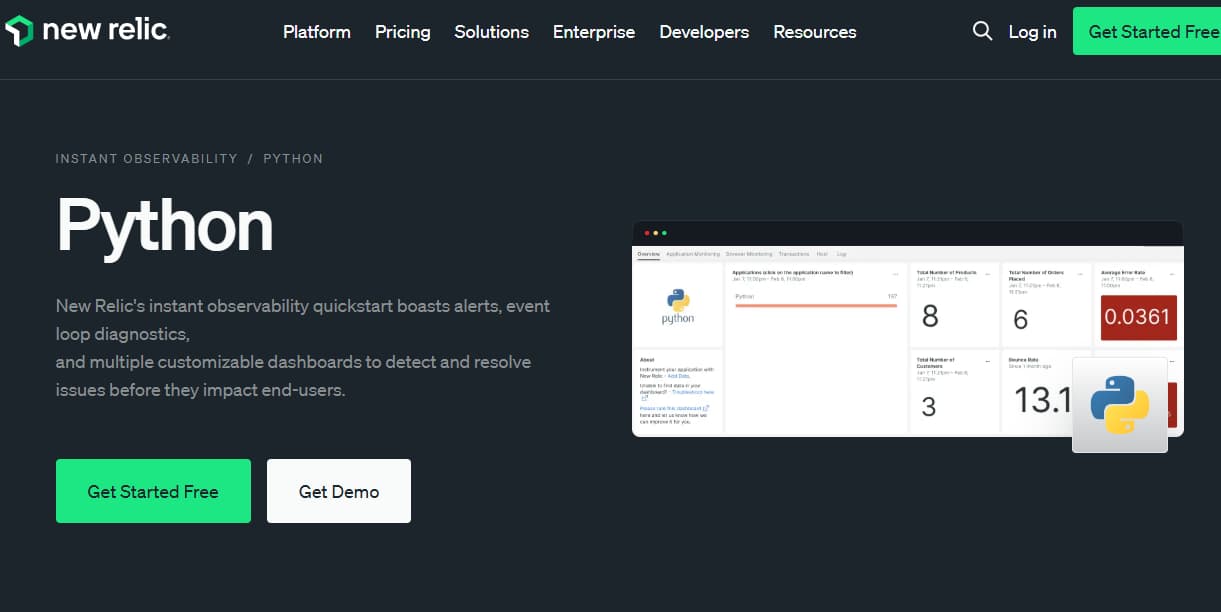
New Relic is known for its usage-based pricing model, generous free tier, and “observability for all” philosophy. It gives teams full-stack visibility (APM, infrastructure, logs, traces, RUM, etc.) without having to count hosts. It also supports compliance frameworks like HIPAA and FedRAMP through its Data Plus plan, which offers extended retention and log governance.
Python Application Monitoring Features
- Auto-instrumentation for Python frameworks (Django, Flask, FastAPI)
- Logs-in-context with Python stack traces and error tracking
- Support for async tracing and distributed tracing across services
Key Features
- Usage-based data ingest with 100 GB/month free
- Data Plus option for extended retention, governance, and compliance
- Flexible user types (core or full-platform) depending on access needs
Pros
- Transparent per-GB pricing after free tier
- Generous free-tier for small teams or pilots
- Strong compliance and retention features with Data Plus
Cons
- Costs rise quickly after the free 100 GB/month
- Extra features like retention can increase spend
- User licensing (full vs. core) adds complexity and cost
Pricing
- Free Tier: 100GB/month ingested
- Data ingestion: $0.40 per GB, depending on plan.
- Full platform users: $349/user/month (higher tiers for enterprises).
New Relic Python Application Monitoring Pricing at Scale
A mid-sized SaaS company ingesting 45TB (~45,000 GB) of telemetry data per month and with 10 full users, the cost would come around ~$25,990/month.
Techfit
New Relic is best for teams that want usage-based observability without host licensing. It works well for Python microservices at scale, especially when compliance, log governance, or retention policies are a priority. It also fits organizations that need flexible access models, with core users for most engineers and full-platform users for power users.
4. Dynatrace
Known for
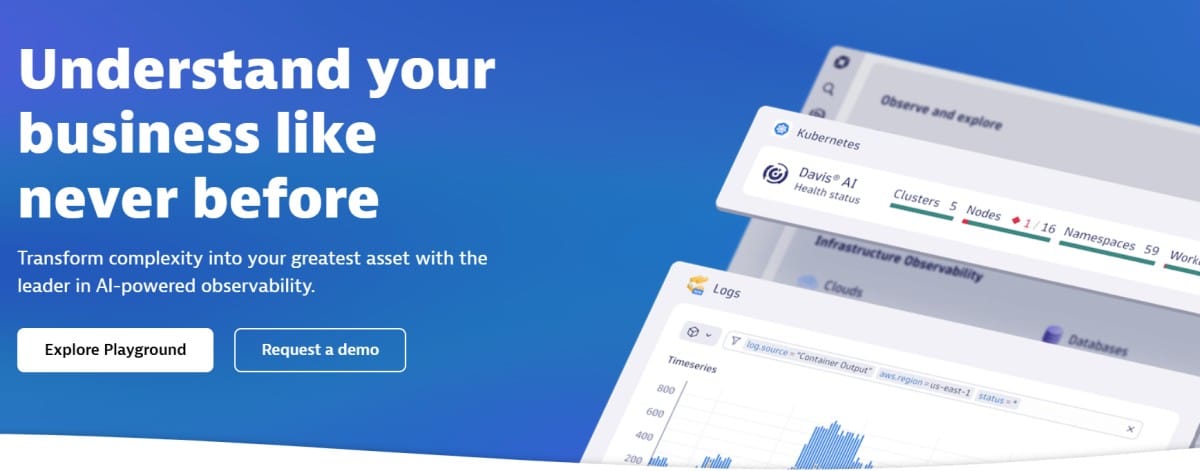
Dynatrace is recognized as an enterprise-grade observability platform with strong Python monitoring capabilities. Its OneAgent provides automatic instrumentation across applications, hosts, containers, and Kubernetes clusters. Dynatrace stands out for its AI-driven Davis engine, which automates root cause analysis and dependency mapping, making it a favorite in large-scale, complex environments.
Python Application Monitoring Features
- Automatic distributed tracing for Python services
- Memory and CPU profiling for Python applications
- Log ingestion and correlation with Python errors and traces
- Kubernetes and container-level visibility for Python workloads
Key Features
- Full-stack monitoring (apps, infra, cloud, hosts)
- AIOps with Davis AI for root cause automation
- Real user monitoring and synthetic testing
- Security features such as runtime vulnerability detection
Pros
- Excellent fit for complex, large-scale systems
- Strong automation for dependency mapping and RCA
- Transparent usage-based pricing with multiple options
Cons
- It can become expensive with high-volume logs and large hosts
- Usage-based billing (per GiB-hour, per host-hour) can be confusing
- Set up and cost optimisation is complex and requires careful management
Pricing
- Infrastructure Monitoring: $29/month per host
- Full-Stack Monitoring: $58/month per 8 GiB host
Dynatrace Python Application Monitoring Pricing at Scale
For a mid-sized SaaS company operating 125 APM hosts, 200 infrastructure hosts, ingesting approximately 10 TB (≈10,000 GB) of logs, generating 300,000 custom metrics, consuming 1.5 million container hours, and producing around 45,000 GB of observability data egress (charged by the cloud provider) would incur an estimated monthly cost of approximately $21,850.
Techfit
Dynatrace is best suited for large enterprises running complex Python environments across Kubernetes or hybrid clouds. It fits organizations that prioritize AI-driven insights, automatic instrumentation, and enterprise security.
5. Sentry
Known for
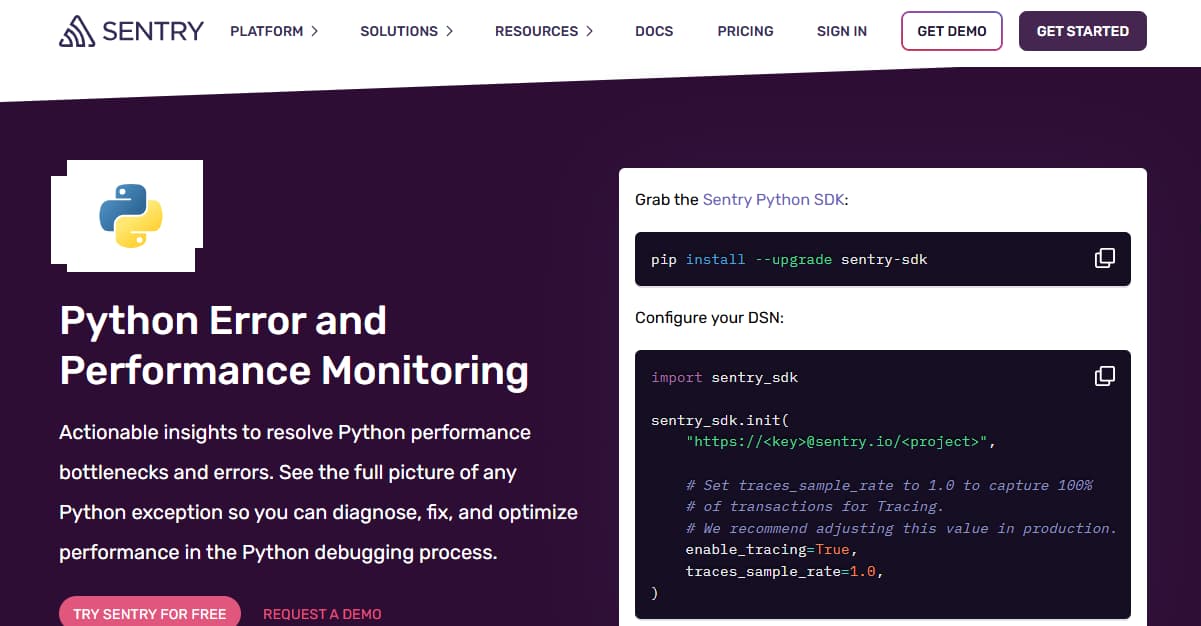
Sentry is best known as a developer-first error monitoring and performance tool with a strong Python SDK. It’s widely used in Python communities for frameworks like Django, Flask, and FastAPI. Unlike full-stack APM vendors, Sentry focuses heavily on error tracking, issue grouping, and performance monitoring, giving developers immediate visibility into exceptions and bottlenecks.
Python Application Monitoring Features
- Automatic error tracking with stack traces for Django, Flask, and FastAPI
- Performance monitoring with transaction traces and latency breakdowns
- Release tracking and regression detection for Python apps
- Source map integration for debugging with context
Key Features
- Error grouping and root cause hints
- Issue resolution workflow with GitHub/Jira/Slack integration
- Frontend + backend error visibility in one platform
- Lightweight performance tracing for Python applications
Pros
- Strong, battle-tested Python SDKs
- Great for real-time error visibility and debugging
- Simple setup compared to enterprise APM tools
- Developer-friendly UI and workflow integrations
Cons
- Costs grow quickly with error/event volumes
- Complex configuration setup
- Expensive at scale
- Delays in error reporting, alerts, and display
Pricing
- Team Plan: $26/month (includes 50k errors, 5 GB logs, 5M spans, 50 replays)
- Business Plan: $80/month (includes same limits, higher support)
- Additional Usage: Pay-as-you-go for extra errors, logs, spans, and replays
- Enterprise: Custom pricing with compliance, retention, and SLAs
Sentry Python Application Monitoring Pricing at Scale
For a mid-sized SaaS company ingesting 10,000 TB (~10,000GB) of logs, 500,000,000 indexed spans, and 45,000GB of observability data (charged by the cloud provider), the cost would come around $12,100/month.
Techfit
Sentry is best suited for Python developers who need real-time error tracking and lightweight performance monitoring without the overhead of a full enterprise observability suite.
6. SigNoz
Known for
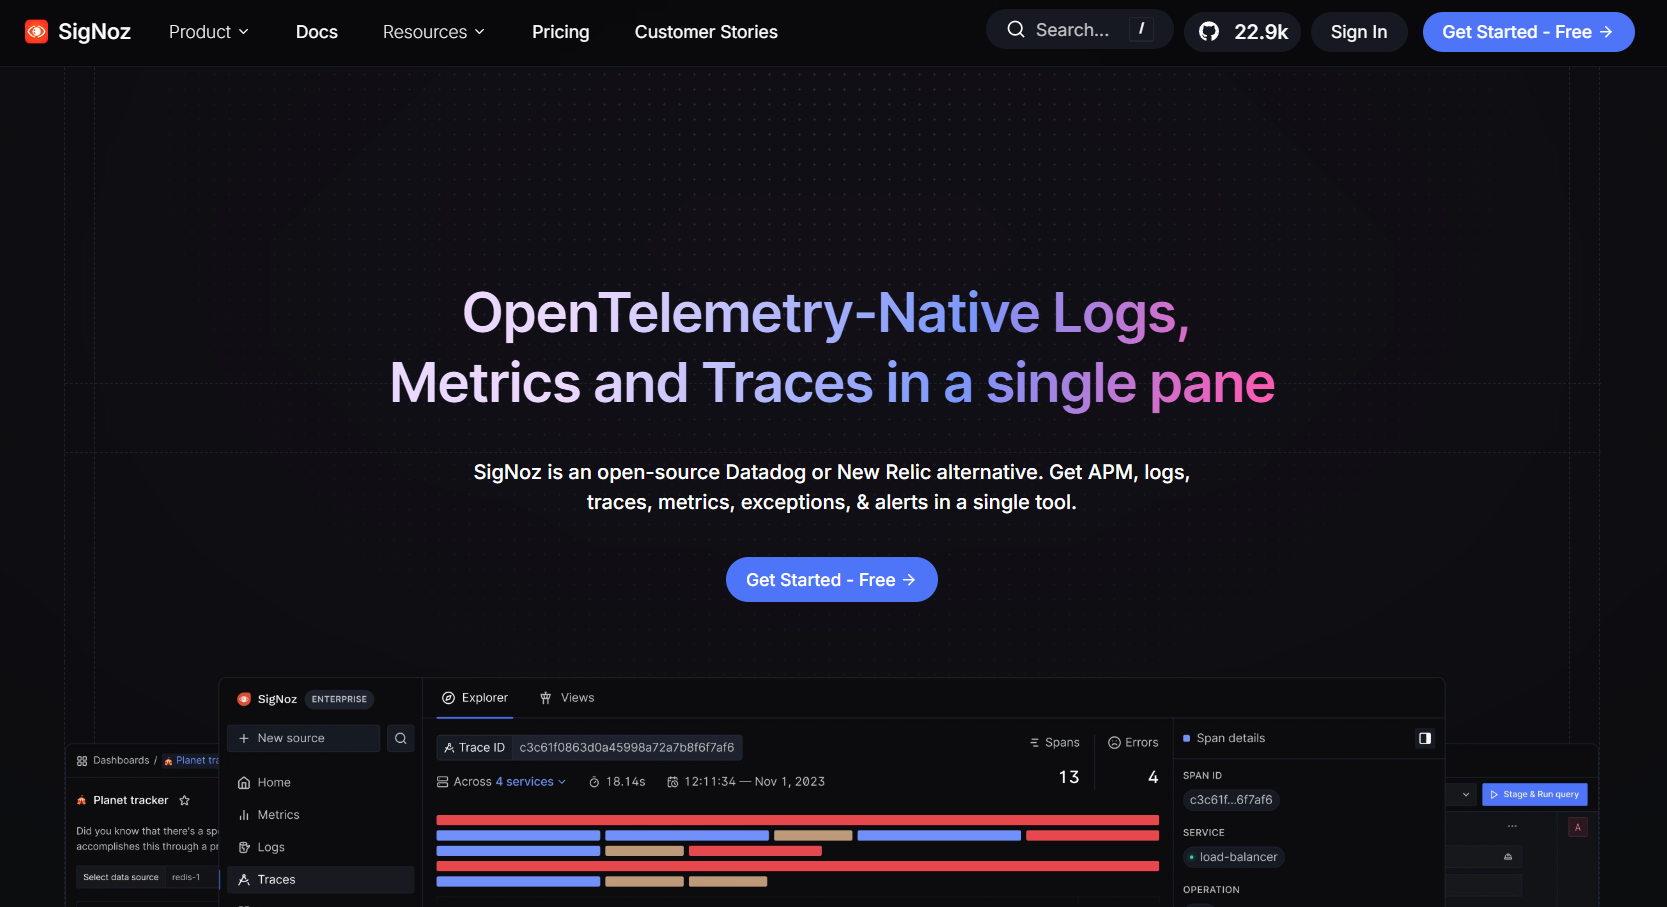
SigNoz is known as an open-source alternative to Datadog and New Relic, built natively on OpenTelemetry. It offers end-to-end observability with logs, metrics, and traces, and is especially popular among engineering teams that want transparency, flexibility, and the ability to self-host. For Python workloads, SigNoz provides good coverage through OTel SDKs and ready-made integrations.
Python Application Monitoring Features
- Distributed tracing for Python apps using OpenTelemetry SDKs
- Error and exception tracking with Python stack traces
- Django, Flask, and FastAPI integrations through OTel instrumentation
- Metrics collection for Python services and background tasks
Key Features
- Unified logs, metrics, and traces on an open-source stack
- Built-in dashboards for latency, error rates, and throughput
- Alerting with integrations into Slack, PagerDuty, Opsgenie
- Self-hosted deployment via Docker or Kubernetes
Pros
- Open-source and free to self-host
- Strong OTel-native design, no proprietary lock-in
- Transparent and predictable cost when self-managed
- Growing community and contributor ecosystem
Cons
- Steep learning curve for new users
- Managing ClickHouse memory usage is time-consuming
- Operational complexity, especially for managing the stacks
Pricing
- Community Edition: Free, open-source, self-hosted
- Teams Plan: $49/month starter
- Traces: $0.30 per GB
- Logs: $0.30 per GB
- Metrics: $0.10 per million samples
SigNoz Python Application Monitoring Pricing at Scale
For a mid-sized SaaS company that ingests 25,000GB of data by APM hosts, 10,000GB of data by infrastructure hosts, 10,000GB of data by log hosts, and 45,000GB of observability data (charged by the cloud provider), the cost would be approximately $16,000.
Techfit
SigNoz is a strong fit for engineering-driven teams and startups that want open-source, OTel-native monitoring for Python apps. It’s ideal when compliance or budget pushes you toward self-hosting, or when you want transparency without vendor lock-in.
7. Uptrace

Known for
Uptrace is known as a lightweight, affordable OpenTelemetry-based APM designed for developers who want distributed tracing, metrics, and error tracking without the complexity of enterprise tools. It focuses on being simple to set up while still providing deep visibility into Python applications, especially Django, Flask, and FastAPI workloads.
Python Application Monitoring Features
- Distributed tracing via OpenTelemetry SDKs for Python
- Django, Flask, and FastAPI integrations with minimal setup
- Error tracking with stack traces for Python exceptions
- Metrics dashboards for latency, throughput, and error rates
Key Features
- OpenTelemetry-native observability (logs, metrics, traces)
- ClickHouse backend for fast queries at scale
- Built-in dashboards and service maps
- Alerts via Slack, PagerDuty, and Opsgenie
Pros
- Affordable and transparent pricing
- Strong Python support via OTel SDKs
- Easy to deploy on Docker or Kubernetes
- Lightweight compared to heavy enterprise APMs
Cons
- Some advanced features require setup efforts, especially when self-hosted
- Operational overhead, especially when self-hosted
- High operational overhead to manage ClickHouse, OTEL Collector, and config
Pricing
- Traces & Logs: $0.07 per GB (at $200 tier, 3 TB included)
- Metrics: $0.0009 per active time series
- Enterprise: Custom pricing with volume discounts
Uptrace Python Application Monitoring Pricing at Scale
For a midsized company ingesting 10 TB/month of traces and logs from Python applications, Uptrace would cost about $700/month at $0.07/GB. Adding metrics at the $2,000/month tier allows up to 3 million active time series at $0.60 per 1,000, which comfortably covers most mid-sized environments. Altogether, the bill comes to roughly $2,700/month
Techfit
Uptrace is best for Python teams that want OpenTelemetry-native tracing and metrics without enterprise overhead. It fits startups and mid-market companies building Django or FastAPI services that want affordable observability, though larger enterprises may outgrow its off-the-shelf plans and need custom contracts.
8. Middleware
Known for
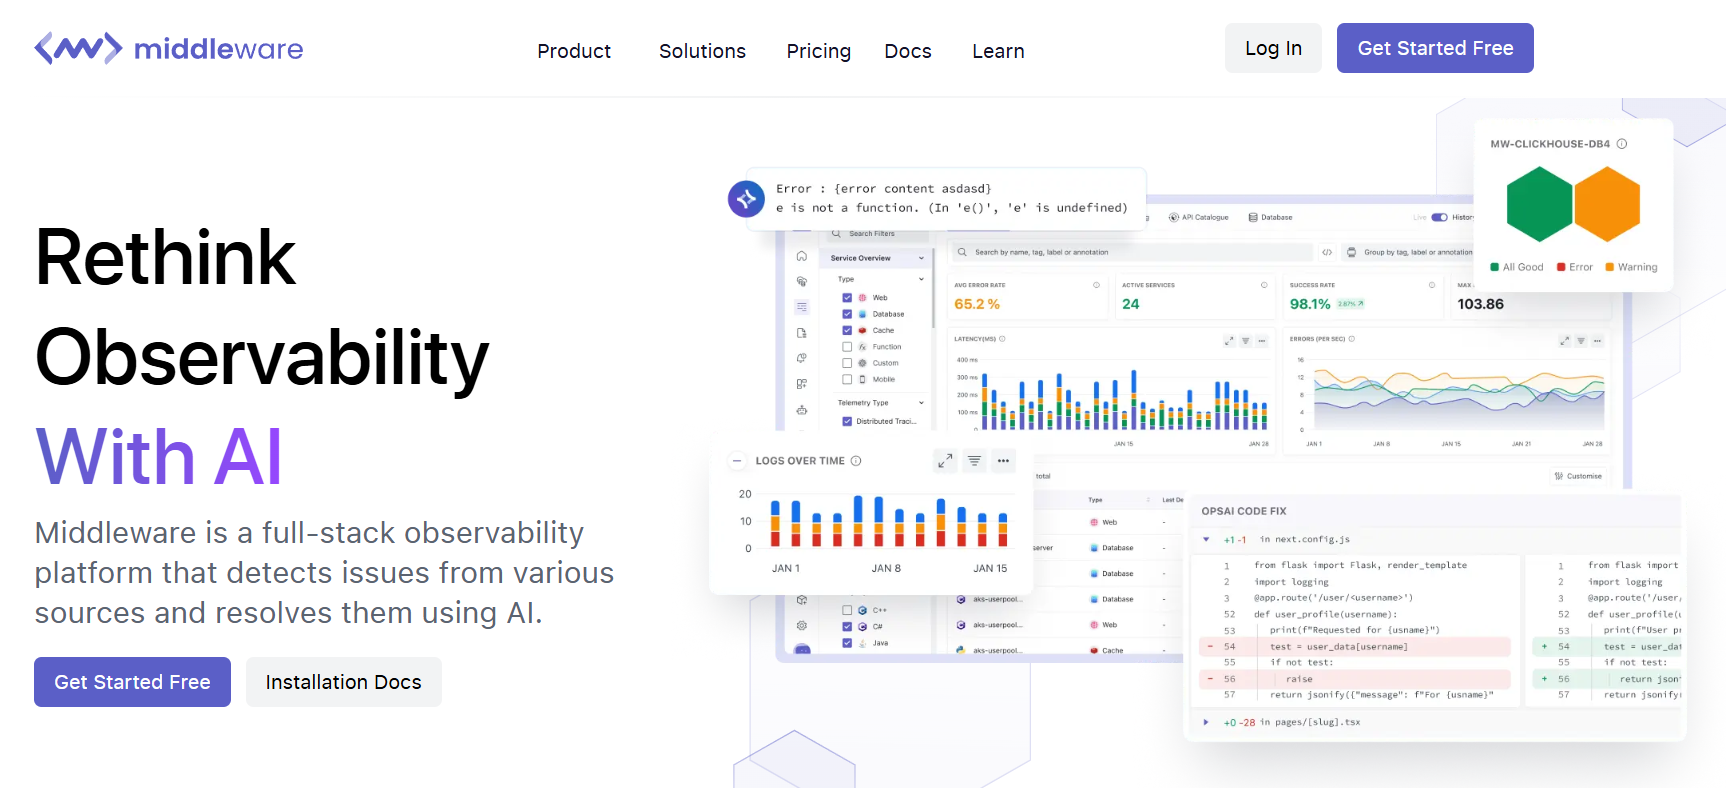
Middleware is known for being a simplicity-first observability platform that bundles APM, logging, metrics, and traces together, with transparent pricing. It offers features like Real User Monitoring (RUM), synthetics, and root-cause AI (“Ops AI”), all while allowing users to only pay for what they actually use. For Python teams, it supports collecting telemetry from frameworks like Django, Flask, FastAPI, etc., and correlates logs/traces/metrics to help debug full request flows.
Python Application Monitoring Features
- Unified logs + traces + metrics collection from Python applications
- Error tracking with context, distributed tracing across services
- RUM + synthetic monitoring with visibility into frontend/backends tied to Python backends
- Dashboards & alerting suited for Python performance bottlenecks
Key Features
- Free Forever tier for small usage (100 GB data, etc.)
- Pay-As-You-Go model: $0.30 per GB for metrics, logs, traces
- Ingestion control / data pipeline for reducing wasted data
- Default retention (30 days) under pay as you go, longer/custom under Enterprise
- Synthetic checks, RUM sessions and OPS-AI error solving priced per event/session
Pros
- Transparent browsing & simple pricing, no surprises
- Good all-in-one observability (infra + APM + logs) in one platform
- Useful free tier for small / early stage Python apps
- Controls over ingestion make cost optimization possible
Cons
- At high scale, GB-based billing can still add up
- Complex initial setup
- UI can feel overwhelming for new users
Pricing
- Free Forever: Up to 100 GB of telemetry (logs/metrics/traces), 14-day retention
- Telemetry (logs, metrics, traces): $0.30 per GB
- Synthetic Monitoring: $1 per 5,000 checks
- RUM: $1 per 1,000 sessions
- Enterprise: Custom plans with volume discounts and compliance features
Middleware Python Application Monitoring Pricing at Scale
For a midsized company ingesting 10 TB/month of Python telemetry data, Middleware’s Pay-As-You-Go rate of $0.30/GB comes to $3,000/month. Adding 1M synthetic checks at $1 per 5,000 checks contributes $200/month, while 1M RUM sessions at $1 per 1,000 sessions add another $500/month. Altogether, the monthly cost would be roughly $3,700/month.
Techfit
Middleware is best for Python teams who want full-stack observability without overpaying. It works well for SaaS startups, mid-market teams, or any group deploying Django / Flask / FastAPI that generate moderate to high traffic. It’s especially useful when log/traces ingestion volumes are large and you want the ability to throttle or drop unimportant telemetry. For enterprises needing on-prem deployments or very stringent compliance, the Enterprise plan and negotiations would likely be necessary.
Conclusion
Python’s dominance in powering APIs, web apps, and data pipelines makes reliable monitoring essential. While tools like Datadog, New Relic, and Dynatrace provide enterprise-grade observability, their complex pricing models often lead to bills that spiral into thousands per month.
This is where CubeAPM stands out. Built with Python-first support for frameworks like Django, Flask, and FastAPI, it combines full-stack observability with flat, predictable pricing at just $0.15/GB. Features like smart sampling, OpenTelemetry-native design, and compliance-ready deployment make it ideal for both growing startups and large enterprises.
For teams that want deep Python monitoring without unpredictable costs, CubeAPM is the most balanced choice. It delivers the power of enterprise APM at a fraction of the price, ensuring Python applications stay fast, reliable, and scalable.
Disclaimer: The information in this article reflects the latest details available at the time of publication and may change as technologies and products evolve.
FAQs
1. What is Python application monitoring?
Python application monitoring is the practice of collecting and analyzing telemetry from Python applications — including logs, traces, metrics, and errors — to ensure performance, reliability, and scalability. It helps detect bottlenecks, track exceptions, and correlate infrastructure with application behavior.
2. Why do developers need monitoring tools for Python applications?
Monitoring tools help Python developers quickly detect issues like GIL bottlenecks, slow ORM queries, memory leaks, or async task failures. Without monitoring, diagnosing production errors or performance problems in frameworks like Django, Flask, or FastAPI becomes guesswork.
3. Which frameworks are supported by Python monitoring tools?
Most modern monitoring tools support popular frameworks including Django, Flask, FastAPI, Celery, and aiohttp. Some tools also provide profiling and exception handling tailored to these frameworks. CubeAPM, for example, offers out-of-the-box instrumentation for Django queries and Celery tasks.
4. How do Python monitoring tools handle large-scale data?
At scale, monitoring tools must use sampling, retention policies, and OpenTelemetry pipelines to control ingestion costs and avoid noise. Platforms like CubeAPM implement smart sampling to retain high-value traces (errors, slow transactions) while dropping low-signal data, making large-scale observability more efficient.
5. What’s the best Python monitoring tool for enterprises?
For enterprises, the best tool balances deep observability, compliance, and predictable costs. While incumbents like Datadog or New Relic offer extensive features, CubeAPM delivers a Python-first, OpenTelemetry-native stack with compliance-ready self-hosting and flat-rate data pricing, making it a strong enterprise option.


