Enterprise monitoring today goes far beyond checking uptime—it’s about ensuring visibility, compliance, and performance across thousands of services running on hybrid and multi-cloud environments. For global enterprises, even a small blind spot in monitoring can mean millions in downtime, regulatory penalties, or lost customer trust.
Yet many organizations face the same recurring problems: too many disconnected tools, runaway costs from soaring telemetry volumes, and limited control over data retention and compliance. This complexity makes it harder for teams to meet SLAs and respond quickly to issues. In fact, 70% of enterprises now rely on four or more monitoring tools, leading to unpredictable costs and extended downtime.
CubeAPM stands out as the best enterprise monitoring tool with its smart sampling, which cuts storage overhead and on-premise deployment helps you stay compliant. This full-stack enterprise observability platform gives breadth across infrastructure and depth into application performance, all at a predictable cost.
In this article, we’ll explore the top enterprise monitoring tools to help you choose the right solution for your organization.
8 Best Enterprise Monitoring Tools
- CubeAPM
- Datadog
- New Relic
- Dynatrace
- Splunk AppDynamics
- Elastic Observability
- IBM Instana
- Coralogix
What is an Enterprise Monitoring Tool?
An enterprise monitoring tool is a platform that provides end-to-end visibility across applications, infrastructure, networks, and user experiences in large, complex organizations. Unlike basic monitoring solutions that only track uptime or server health, enterprise-grade tools unify metrics, logs, traces, and digital experience data to help teams detect issues early, meet SLAs, and stay compliant with regulations.
These tools are critical because modern enterprises run on multi-cloud, hybrid, and microservices environments, where even a minor blind spot can lead to downtime, regulatory fines, or lost customer trust. Enterprise monitoring ensures that IT and DevOps teams can keep systems performant, secure, and aligned with business outcomes.
Example: Financial Transaction Monitoring with CubeAPM
Consider a global bank processing millions of daily payment transactions. With CubeAPM’s distributed tracing and high-resolution metrics, the bank can detect a slowdown in its payment API within seconds, trace it back to a misconfigured database cluster, and resolve it before customers experience failed payments.
CubeAPM’s on-premise deployment also ensures compliance with strict financial regulations, while its $0.15/GB pricing allows the bank to ingest 10 TB of telemetry data monthly without unpredictable bills—something that’s much harder to achieve with host- or vCPU-based pricing models from other vendors.
CubeAPM’s Strength: Monitoring Breadth + APM Depth
Enterprise monitoring and application performance monitoring (APM) are closely related but focus on different layers:
- Monitoring = Breadth → Broad coverage across infrastructure, Kubernetes, multi-cloud services, logs, and user experience.
- APM = Depth → Code-level tracing, transaction performance, dependency mapping, and error diagnostics within applications.
Most enterprises need both—wide visibility plus deep root-cause insights. CubeAPM combines these strengths into one unified platform:
Enterprise Monitoring Features (Breadth):
- Kubernetes, VM, and cloud infrastructure monitoring
- Unified metrics, logs, traces, and events collection via OpenTelemetry
- Real User Monitoring (RUM) + synthetic testing for end-user visibility
- Unlimited retention for compliance and audits
- On-premise and VPC deployment for data sovereignty
APM Features (Depth):
- High-resolution distributed tracing with RED metrics (Rate, Errors, Duration)
- SLO and SLA monitoring mapped to business impact
- Error grouping and root-cause diagnostics
- Transaction-level visibility for APIs, microservices, and legacy systems
- Code-level insights for Java, .NET, Node.js, Python, and Go
Why it matters: When combined, CubeAPM delivers enterprise-wide observability that gives both the wide-angle view (breadth) to avoid blind spots and the microscope (depth) to resolve issues at the code or transaction level. This dual strength makes it a powerful tool for enterprises where performance, compliance, and cost predictability must all coexist.
Why Teams Choose Different Enterprise Monitoring Tools
Cost Predictability at Scale
Enterprises generate enormous telemetry volumes, often 10 TB or more per month, from logs, traces, metrics, and user data. Pricing models that charge per host, vCPU, or data unit (like DDUs) can quickly spiral into multi-million-dollar annual bills. That’s why some enterprises gravitate toward per-GB ingestion models that keep costs predictable, while others accept higher spend from host-based models if the feature depth justifies it. Predictability is the deciding factor here, not the lowest price.
Data Residency and Compliance Requirements
Global enterprises must comply with data residency and sovereignty laws such as GDPR (EU), HIPAA (US healthcare), DPDP (India), and emerging sovereign cloud frameworks. These regulations often prohibit sensitive telemetry data (like PII in logs or traces) from leaving specific regions. Enterprises, therefore, choose monitoring tools that offer on-premise or private cloud deployments, or SaaS options with strict region locking and audit controls. Tools that can’t meet compliance standards are often disqualified early in vendor evaluations.
Legacy Workload Coverage (SAP, Mainframe, Oracle)
While startups and SMBs are cloud-native, enterprises still depend on legacy ERP systems like SAP and even mainframes (z/OS, COBOL apps) for critical business functions. Monitoring platforms that can trace across SAP ABAP transactions, Oracle DBs, or mainframe processes alongside modern Kubernetes workloads win enterprise adoption. For example, banks often require full visibility across customer-facing microservices that tie back into mainframe systems. Tools without legacy coverage may be supplemented with secondary vendors or ruled out entirely.
Multi-Cloud and Kubernetes Coverage
Large enterprises rarely rely on a single provider—they run workloads across AWS, Azure, GCP, and on-premise data centers, often with hundreds of Kubernetes clusters orchestrating microservices. Monitoring platforms are judged on their ability to provide deep Kubernetes insights (pod health, service mesh telemetry, cluster costs) and multi-cloud integrations that normalize data across providers. Enterprises prioritize tools that reduce silos and avoid the “one tool per environment” problem.
AI-Assisted Root Cause vs Search-Driven Forensics
Some enterprises favor platforms with AI-driven causal analysis that automatically suppress alert noise and point directly to the root cause, speeding up MTTR. Others prefer search-centric platforms that excel at forensic, ad-hoc analysis of raw telemetry, giving SREs more control in complex incidents. The split often comes down to organizational culture: AI-guided operations vs engineering-led investigations.
Governance and Enterprise Security Controls
Enterprises need more mature features for governance. Tools are often evaluated for SSO/SAML support, role-based access controls (RBAC), audit logs, and quota enforcement. Without these, large organizations risk shadow access, compliance violations, or uncontrolled telemetry usage. Mature governance is not optional in enterprise observability—it’s table stakes for security and accountability.
Data-Pipeline Flexibility and Retention Strategy
Data growth is relentless, and storing everything in “hot indexed” form is no longer sustainable at the enterprise level. Enterprises increasingly prefer platforms that let them route telemetry into different pipelines: hot (real-time monitoring), warm (frequent queries), or cold/archive (compliance storage). Some vendors now offer index-free querying from cloud storage, enabling enterprises to retain petabytes at low cost while still searching when needed.
Business Impact and SLO Focus
Enterprises care less about raw CPU spikes and more about service level objectives (SLOs), SLAs, and business KPIs. Monitoring tools that connect technical telemetry to real business outcomes (e.g., “checkout API latency increased → revenue at risk”) are prioritized. This shift from “is the server up?” to “is the business impacted?” is why many enterprises now evaluate tools on their ability to support SLO culture and error budgets, not just dashboards and alerts.
8 Best Enterprise Monitoring Tools
1. CubeAPM
Overview
CubeAPM is a modern enterprise monitoring solution built with OpenTelemetry at its core. Instead of stitching together multiple tools, it gives enterprises a single place to track metrics, logs, traces, user journeys, and synthetic tests. The platform has been designed with the realities of global organizations in mind: compliance requirements, growing data volumes, and the need to control costs without sacrificing visibility.
Key Advantage
The standout advantage of CubeAPM is its ability to keep monitoring costs under control at scale. Its flat-rate pricing model is combined with advanced smart sampling, which prioritizes and preserves the data that truly matters for troubleshooting and performance analysis. This approach allows enterprises to cut storage and data transfer waste dramatically while still maintaining a full picture of their systems. The result is observability that doesn’t break the budget, even as environments grow.
Key Features
- Enterprise-ready infrastructure monitoring: Monitors Kubernetes clusters, containers, VMs, and cloud services while tying infrastructure events directly to traces and logs.
- Comprehensive log monitoring: Collects and enriches log data in one place with fast filtering and search, making compliance audits and forensic analysis easier.
- User experience visibility (RUM): Measures front-end performance and end-user experience, with the option to host RUM data on-premise for regulated industries.
- Synthetic testing: Simulates transactions and API calls so enterprises can catch issues before customers do.
- Unlimited retention: Historical telemetry is stored without extra charges, allowing long-term trend analysis and post-incident reviews.
- Deep distributed tracing: Provides complete visibility across service interactions with RED metrics and SLO views, helping teams pinpoint slowdowns or failure points quickly.
- Error grouping and tracking: Automatically highlights recurring problems across services, reducing the time engineers spend diagnosing the same issues.
Pros
- Strong on-prem and private-cloud options for organizations with compliance needs
- Straightforward pricing that avoids hidden or surprise costs
- All MELT components in one platform, minimizing the need for multiple tools
- Fast, human-in-the-loop support via Slack and WhatsApp channels
- 800+ integrations for major enterprise tools and systems
Cons
- Less suitable for teams that prefer fully managed SaaS solutions with no infrastructure ownership
- Focused only on observability and does not include built-in cloud security features
CubeAPM Pricing at Scale
CubeAPM uses a transparent pricing model of $0.15 per GB ingested. For a mid-sized business generating 45 TB (~45,000 GB) of data per month, the monthly cost would be ~$7,200/month.
*All pricing comparisons are calculated using standardized Small/Medium/Large team profiles defined in our internal benchmarking sheet, based on fixed log, metrics, trace, and retention assumptions. Actual pricing may vary by usage, region, and plan structure. Please confirm current pricing with each vendor.
Tech Fit
CubeAPM is well-suited to enterprises operating hybrid or multi-cloud setups. It supports common enterprise languages like Java, .NET, Node.js, Python, and Go via OpenTelemetry, and integrates seamlessly with major platforms, including AWS, Azure, GCP, and on-prem environments. Coverage extends to Kubernetes clusters, VMs, and widely used databases such as MySQL, PostgreSQL, Redis, and Kafka. For industries like finance, healthcare, and government, the ability to run RUM and synthetic monitoring fully on-premise provides an added layer of compliance and control.
2. Datadog
Overview
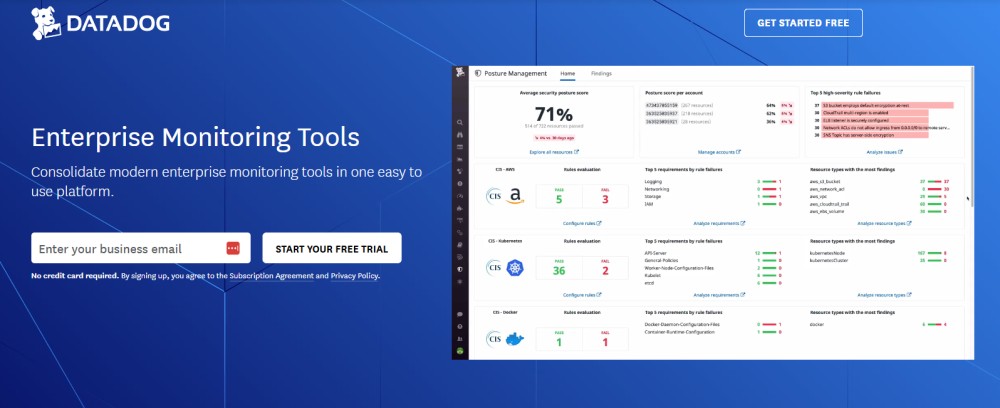
Datadog is one of the most widely adopted SaaS-based observability platforms, known for its broad product coverage and “all-in-one” approach. It gives enterprises a single dashboard to monitor infrastructure, applications, logs, networks, digital experiences, and even security modules, making it a popular choice for organizations with hybrid or multi-cloud setups.
Key Advantage
The main strength of Datadog is its breadth of coverage combined with strong cross-correlation. Enterprises can move seamlessly between APM, logs, traces, and user monitoring within the same interface, accelerating root-cause analysis and improving collaboration across teams.
Key Features
- Enterprise Network Monitoring: Monitors everything from devices to cloud networking layers, giving visibility across hybrid estates.
- Business Metrics Correlation: Links application and infrastructure telemetry to business KPIs for impact-driven triage.
- Enterprise-grade Application Performance Monitoring (APM): Code-level traces and continuous profiling provide detailed insights into service behavior.
- Log Management: Flexible ingest and indexing options help balance real-time queries with long-term storage needs.
- RUM and Synthetics: Tracks frontend performance, replays user sessions, and runs synthetic API/browser tests to catch issues proactively.
- Optional Security Modules: Includes features like SIEM and CNAPP for enterprises that want observability and security under one roof.
Pros
- Extremely wide product range and hundreds of pre-built integrations
- Strong cross-signal correlation for faster investigations
- Mature documentation, dashboards, and enterprise admin controls
Cons
- Complex pricing with many billable units increases costs at scale
- SaaS-only delivery
Datadog Pricing at Scale
Datadog charges differently for different capabilities. APM starts at $31/month; infra starts at $15/month; logs start at $0.10/GB, and so on.
For a mid-sized business ingesting around 45 TB (~45,000 GB) of data per month, the cost would come around $27,475/month.
Tech Fit
Datadog works best for enterprises that want a fast-to-deploy SaaS platform spanning multiple environments like AWS, Azure, GCP, Kubernetes, and traditional VMs. It supports a wide range of programming languages, including Java, .NET, Node.js, Python, and Go. The platform is ideal for organizations that value a broad integration ecosystem, intuitive dashboards, and the ability to add optional security features alongside observability.
3. New Relic
Overview
New Relic is a usage-based, SaaS observability platform designed to centralize application, infrastructure, log, trace, and digital-experience telemetry in one place. It’s aimed at large organizations that want a single control plane with strong admin governance, curated experiences, and a broad catalog of quickstarts and integrations.
Key Advantage
New Relic’s defining edge is its usage-first pricing and unified workflow. By metering data ingestion and user access (or a compute model), enterprises can roll out a single platform across many teams with predictable governance, dashboards, and alerting while keeping deployment friction low.
Key Features
- APM 360 and distributed tracing: End-to-end traces, code-level context, and curated service views to accelerate triage.
- Log management: Flexible ingest with configurable retention and obfuscation, plus “logs in context” for faster investigations.
- Infrastructure and Kubernetes monitoring: Node, container, and cluster health tied to app signals for true full-stack visibility.
- Digital experience (browser, mobile, synthetics): Frontend performance, session timelines, and proactive checks in one workflow.
- AIOps and alerting: Incident intelligence, anomaly detection, and rich alert policies integrated with on-call tools.
- OpenTelemetry: Supports OTel to simplify data collection along with dashboards.
Pros
- 700+ integrations
- Unified SaaS platform with wide product depth and mature governance
- Strong cross-signal correlation from apps to infra to user experience
- Large integration and quickstart catalog to speed enterprise rollout
Cons
- Pure SaaS delivery may not satisfy strict data-sovereignty requirements
- Costs rise with higher ingestion, additional users, or longer retention
New Relic Pricing at Scale
New Relic’s billing is based on data ingested, user licenses, and optional add-ons. The free tier offers 100 GB of ingest per month, then it costs $0.40 per GB after that.
For a business ingesting 45 TB of logs per month, the cost would come around $25,990/month.
Tech Fit
Best for enterprises standardizing on a single SaaS observability plane across AWS, Azure, GCP, Kubernetes, and VM estates, with large engineering orgs that benefit from curated experiences, broad integrations, and flexible pricing models. Polyglot teams (Java, .NET, Node.js, Python, Go, and more) get consistent instrumentation patterns, shared dashboards, and streamlined incident workflows.
4. Dynatrace
Overview
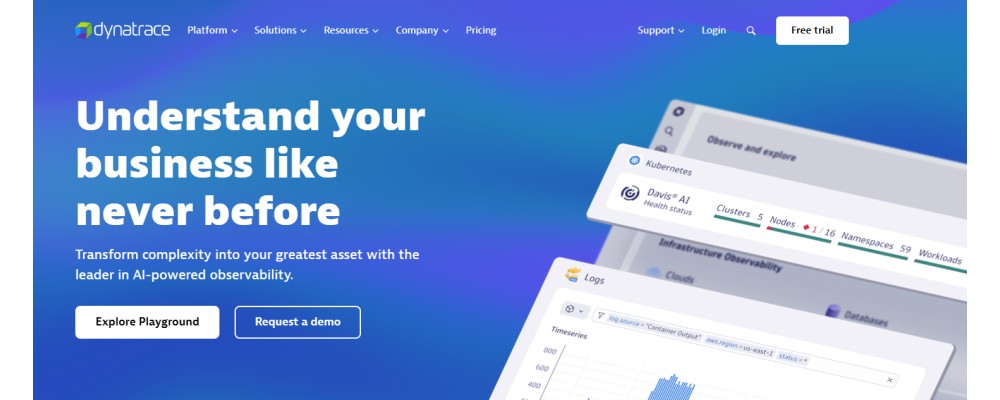
Dynatrace is an enterprise observability platform that unifies application, infrastructure, digital experience, and business telemetry under one roof. It emphasizes AI-driven automation (Davis®), automatic discovery/instrumentation (OneAgent), and high-cardinality analytics in Grail—aimed at complex, fast-changing estates running across hybrid and multi-cloud.
Key Advantage
Dynatrace’s defining strength is causal AI with automatic topology awareness. Davis® combines dependency graphs (Smartscape) with unified data in Grail to pinpoint root cause and blast radius with minimal manual tuning, which shortens MTTR and scales reliably in large microservices and Kubernetes environments.
Key Features
- OneAgent auto-instrumentation: Installs once and automatically discovers services, processes, and dependencies to capture metrics, logs, traces, and profiles.
- Davis® AI & causal analysis: Correlates anomalies to precise root cause using topology and runtime context, reducing alert noise and mean time to repair.
- Grail datalake: the tool provides a central hub for logs, metrics, traces, and events, along with high-cardinality analytics, so you can perform faster investigations.
- Smartscape topology: Maintains a live service map across apps, hosts, containers, and networks to visualize impact paths and dependencies.
- Kubernetes & cloud monitoring: Provides workload, pod, node, and cluster health with out-of-the-box dashboards and alerting.
- Digital experience monitoring: Combines RUM, session replay, and synthetics to track real user journeys and proactively test critical flows.
- Business observability: Ingests business events/metrics to connect technical issues to KPI impact for prioritized response.
Pros
- AI-assisted root cause with strong automation at enterprise scale
- Broad coverage from infra to apps to digital experience in one platform
- Deep Kubernetes and cloud insights with live dependency maps
- High-cardinality analytics that keep investigations in context
- Mature governance, SSO/RBAC, and admin cost visibility
Cons
- Pricing involves multiple units (hosts, data ingest/retain, sessions) and needs careful evaluation at scale
- Learning curve and administrative overhead for smaller teams
Dynatrace Pricing at Scale
Dynatrace charges:
- Full stack: $0.01/8 GiB hour/month or $58/month/8GiB host
- Log Ingest & process: $0.20 per GiB
For a similar 45 TB (~45,000 GB/month) volume, the cost would be $21,850/month.
Tech Fit
Dynatrace fits large, dynamic enterprises running polyglot services (Java, .NET, Node.js, Python, Go) across Kubernetes, containers, and traditional hosts in AWS/Azure/GCP plus data centers. It’s especially strong where teams want automated discovery, AI-driven RCA, and a single platform spanning application performance, infra health, digital experience, and business impact analytics.
5. Splunk AppDynamics
Overview
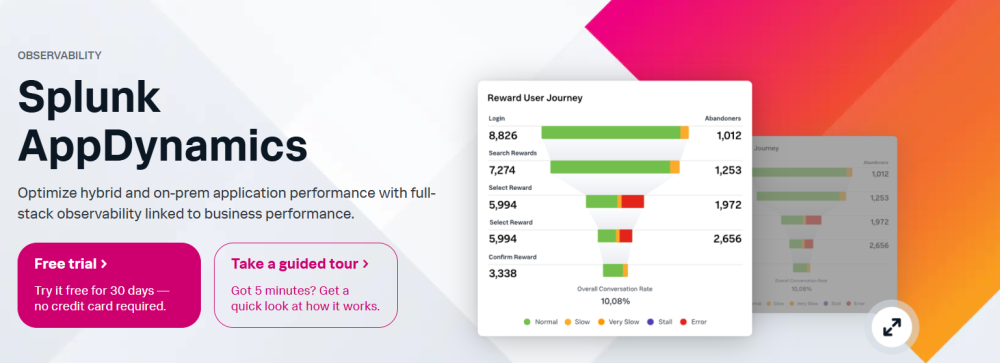
Splunk AppDynamics is a full-stack application performance and digital experience platform designed for enterprises that need deep visibility into both hybrid and on-prem environments. It specializes in mapping application performance directly to business outcomes, combining APM, business transactions, user experience monitoring, network correlation, and runtime application security. For enterprises with strict sovereignty requirements, it also offers an on-prem controller managed through the Enterprise Console.
Key Advantage
The platform’s key strength is business transaction monitoring tied directly to KPIs. By mapping requests into end-to-end transactions—such as order processing or payments—AppDynamics gives teams insight not only into what failed, but also into who is affected and how it impacts business performance. This allows operations teams to prioritize fixes that matter most to customers and revenue.
Key Features
- Extensive Business transaction tracing: Captures requests across tiers and APIs, correlates them to critical journeys, and highlights root causes at the code level.
- Digital experience monitoring for enterprises: Provides real user monitoring, mobile analytics, and synthetic tests to validate customer-facing journeys before they break.
- SAP diagnostics: Offers specialized visibility into SAP environments, isolating slow queries, locks, and ABAP issues with prebuilt dashboards.
- Network correlation: Tracks the effect of ISPs, SaaS dependencies, and internal networks on application performance, reducing cross-team guesswork.
- Runtime application security (optional): Detects and blocks attacks in real time, with full application context for faster remediation.
- On-prem controller and lifecycle management: Deploy and manage controllers and the events service on-prem with HA support and GUI/CLI tooling.
Pros
- Transaction-centric model connects app performance to real business KPIs
- Strong SAP visibility for mixed enterprise stacks
- Option for a fully on-prem controller to support compliance requirements
- End-to-end coverage across applications, user journeys, and networks
Cons
- Alert inefficiencies
- Slower update/innovation cycle
Splunk AppDynamics Pricing at Scale
AppDynamics pricing is based on CPU cores (vCPUs). The essential “Infrastructure Edition” starts at $6 per vCPU per month, while the “Premium Edition,” which includes log analytics along with app and DB monitoring, begins at $33 per vCPU per month.
For a mid-size organization ingesting 45 TB data, the cost could be: $8,625/month.
Tech Fit
Splunk AppDynamics is best suited for enterprises running complex, hybrid, or SAP-centric environments where tying application performance directly to business impact is critical. It has strong coverage for Java and .NET services, with support for Node.js, Python, and Go, plus integrations with Kubernetes, databases, and third-party APIs. For organizations that value business-aligned monitoring and compliance-friendly on-prem deployment, it is a strong contender—though for enterprises prioritizing cost efficiency at scale, CubeAPM offers a more predictable alternative.
6. Elastic Observability
Overview
Elastic Observability is a full-stack monitoring and analytics solution built on the Elastic platform. It unifies logs, metrics, traces, and digital experience data into a single workflow, with advanced search, visualization, and machine learning capabilities. Enterprises can choose self-managed deployments, Elastic Cloud, or a serverless option, giving flexibility in how and where they operate.
Key Advantage
Its defining strength is search-grade analytics at scale. Elastic’s indexing and query engine allow enterprises to sift through massive amounts of telemetry with precision, making it ideal for deep forensic analysis and troubleshooting without switching tools.
Key Features
- OpenTelemetry-native ingest: Vendor-neutral collection of metrics, logs, and traces across applications, infrastructure, and cloud services.
- Enterprise-level Application performance monitoring: End-to-end tracing, service maps, SLO tracking, and error analysis with code-level context.
- Log analytics: High-speed, large-scale log collection and querying with customizable dashboards and visualizations.
- Machine learning and AIOps: Built-in anomaly detection and pattern recognition to surface issues before they impact users.
- Extensive Digital experience monitoring: Real user monitoring and synthetics to validate user journeys across web and mobile.
- Tiered data storage: Options for hot, warm, and cold storage tiers to optimize retention costs while keeping data searchable.
Pros
- Strong commitment to open standards with OpenTelemetry support
- Flexible deployment options: self-managed, Elastic Cloud, or serverless
- Exceptional log and search capabilities at enterprise scale
- Built-in AI and ML features for anomaly detection
- Tiered storage for cost optimization
Cons
- Learning curve; users need familiarity with tools such as ElasticSearch and Kibana
- Multiple billing units for ingest, storage, and egress can complicate cost forecasting
Elastic Observability Pricing at Scale
Elastic’s Serverless Observability pricing starts around $0.15/GB for ingest and $0.02/GB/month for retention. Egress beyond the free tier is $0.05/GB, premium support is an additional 5-15% of monthly spend, and synthetic monitoring is billed separately at $0.10 per 10,000 test runs.
Mid-sized scenario (45 TB/month ingest): estimated total is ≈ $17,435/month.
Tech Fit
Elastic Observability is best suited for enterprises that want powerful analytics, flexible deployment, and open-source compatibility. It performs particularly well in log-heavy environments, long-term retention scenarios, and multi-cloud Kubernetes setups. It supports common enterprise languages like Java, .NET, Node.js, Python, and Go, and offers strong integrations with cloud platforms. Enterprises with skilled SRE or platform teams will find it highly capable, while organizations that prioritize simpler, predictable billing at high ingest volumes may find CubeAPM the more cost-efficient choice.
7. IBM Instana
Overview
IBM Instana is a real-time enterprise observability platform designed for complex, fast-changing environments. It emphasizes 1-second data granularity, trace-every-request visibility, and automated service discovery, giving operations teams continuous, high-fidelity insights across hybrid and multi-cloud infrastructures.
Key Advantage
Instana’s biggest strength is its ability to deliver instant, high-fidelity visibility with minimal manual effort. Automatic discovery continuously maps services and dependencies as they evolve, while its 1-second metrics and full traces ensure issues can be detected and resolved quickly—even in dynamic microservices and Kubernetes environments.
Key Features
- 1-second granularity and full-trace coverage: Provides real-time metrics and captures every request for precise troubleshooting.
- Automated discovery and topology: Continuously updates service, process, and dependency maps as infrastructure changes.
- AI-driven incident investigation: Uses built-in intelligence to explain anomalies and guide root-cause analysis.
- Kubernetes and cloud observability with cost context: Offers deep container monitoring and built-in cost analysis to align performance with spend.
- Digital experience and synthetics for enterprises: Includes real user monitoring and global synthetic checks for proactive validation.
- Logs and database visibility: Correlates logs and database performance with traces and metrics for complete context.
Pros
- Provides high-fidelity monitoring with 1-second data resolution
- Requires little manual setup thanks to automated discovery
- Strong coverage across cloud-native, containerized, and hybrid environments
- AI-assisted investigations shorten troubleshooting time
Cons
- Host-based licensing can become expensive at scale
- Learning curve
- UI Issues
IBM Instana Pricing at Scale
Instana uses a Managed Virtual Server (MVS) licensing model, with published tiers for Essentials, Standard, and On-demand plans.
Essentials: $20/MVS/month (infra)
Standard: $75/MVS/month (full-stack monitoring)
On-demand: $20/MVS/month (extra for logs and retention); pay-per-use: $0.03/MVS hour/month
For 45 TB of ingestion, an organization may pay $17,375/month.
Tech Fit
IBM Instana is best suited for enterprises running complex microservices, Kubernetes clusters, and hybrid or multi-cloud architectures. It supports a wide range of enterprise languages such as Java, .NET, Node.js, Python, and Go. It is especially useful for organizations seeking real-time, high-resolution insights with minimal manual setup, and for teams that benefit from AI-driven incident analysis. However, for enterprises focused on predictable per-GB pricing at scale, CubeAPM generally provides a more cost-efficient option.
8. Coralogix
Overview
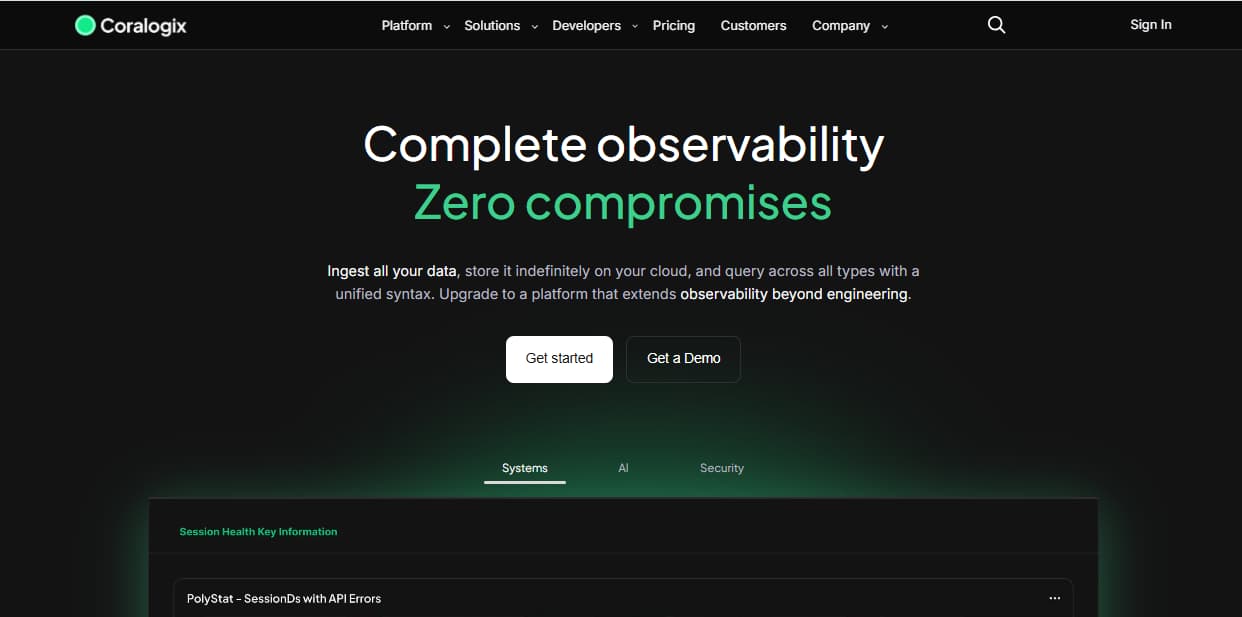
Coralogix is a full-stack observability platform that emphasizes real-time streaming, index-free querying, and cost-optimized data pipelines. It unifies logs, metrics, traces, APM, infrastructure, and digital experience monitoring with enterprise-grade governance features such as RBAC, SSO, and audit trails. Unlimited users and hosts are included, making it attractive for enterprises with large, distributed teams.
Key Advantage
Coralogix’s main advantage is its pipeline-based data optimization with index-free search. Instead of indexing all data upfront, enterprises can define pipelines to route logs and traces based on usage needs—such as monitoring, Frequent Search, or compliance—and query archived data directly from storage. This lowers costs significantly while still providing full visibility when needed.
Key Features
- Index-free querying: Access archived data directly without re-indexing, keeping hot data fast and reducing storage overhead.
- Infinite retention in your storage: Data is stored in your S3 bucket with compression, allowing on-demand queries for long-term investigations.
- Flexible data pipelines: Route telemetry into pipelines optimized for monitoring, frequent search, or archival to control costs.
- APM and infrastructure monitoring: Offers distributed tracing, service maps, infrastructure explorers, and database monitoring.
- Digital experience monitoring: Real user monitoring, error tracking, and synthetic checks help catch regressions before customers are impacted.
- Enterprise-grade controls: Provides role-based access, SAML/SSO, audit logs, and quota management for large organizations.
- OpenTelemetry and integrations: Supports standardized data collection with hundreds of integrations across modern cloud-native stacks.
Pros
- Infinite data retention
- Pipeline-first architecture that lowers indexing and storage costs
- Allows you to query from your cloud storage directly
- Unlimited users and hosts are included by default
- Strong OpenTelemetry compatibility and broad integration ecosystem
Cons
- Requires careful planning of pipelines and quotas to manage costs
- Learning curve
Coralogix Pricing at Scale
Coralogix pricing is based on usage, with separate per-GB rates for logs, traces, and metrics. Logs are billed at $0.42/GB, traces at $0.16/GB, and metrics at $0.05/GB. For an enterprise ingesting 45 TB per month, the cost would be around $13,200/month.
Tech Fit
Coralogix is a strong choice for log-heavy enterprises that need granular control over data storage and retention, and for teams that rely heavily on Grafana and OpenTelemetry. It suits organizations that want cost flexibility through pipelines and index-free querying, and that have the engineering expertise to manage usage models.
How to Choose the Right Enterprise Monitoring Tool
1. Deployment and Compliance Options
Enterprises under regulated industries, such as finance, healthcare, and government, must focus on tools that provide on-premise, VPC, or region-locked SaaS deployment. This ensures compliance with GDPR, HIPAA, DPDP, and upcoming sovereign-cloud requirements. Any tool without these deployment models can be a non-starter.
2. Predictable Total Cost of Ownership
At enterprise scale, observability often means 10 TB+ of telemetry monthly. Tools with per-host or vCPU pricing can escalate into millions annually. Enterprises should model long-term costs, including ingest, retention, egress, and users, and prioritize platforms with flat, transparent pricing to avoid budget shocks.
3. OpenTelemetry and Standards Support
Large companies should go for tools that are OpenTelemetry-native and compatible with major languages (.NET, Java, Python, Go, Node.js) to skip vendor lock-ins. This ensures consistency across distributed teams, simplifies migrations, and enables hybrid monitoring strategies without costly re-instrumentation.
4. Legacy and Modern Workload Coverage
Enterprises often run SAP, Oracle, and even mainframe systems alongside cloud-native microservices. A monitoring tool must provide deep visibility across both legacy and modern environments, so that critical business processes are traceable end-to-end without gaps.
5. Kubernetes and Multi-Cloud Observability
Enterprises rarely standardize on one cloud—they operate across AWS, Azure, GCP, and private data centers. A strong monitoring tool should deliver first-class Kubernetes insights (pod health, autoscaling, cost, service mesh) and normalize telemetry across all cloud providers.
6. Governance and Security Controls
With hundreds of engineers accessing telemetry, enterprises need SSO/SAML integration, role-based access control (RBAC), audit trails, and quota management. These governance features are essential to maintain security, prevent misuse, and meet compliance audits at scale.
7. AI-Driven Root Cause and Noise Reduction
At enterprise scale, the biggest challenge is not collecting data but reducing noise and finding the root cause quickly. Tools with AI-assisted RCA and anomaly detection can cut false alerts, surface impact radius, and reduce MTTR significantly—critical for meeting strict SLAs.
8. Business Impact and SLO Alignment
Modern enterprises want monitoring that connects technical health to business outcomes. Tools that can link telemetry to SLOs, SLAs, and KPIs (e.g., “checkout latency affecting revenue”) help prioritize issues and justify observability investments to executives.
Conclusion
Enterprises today struggle with fragmented monitoring stacks, runaway costs from high telemetry volumes, and compliance risks in multi-cloud environments. Choosing the wrong tool often means limited visibility, alert fatigue, and unpredictable bills.
CubeAPM solves these challenges with an OpenTelemetry-native platform, unified MELT coverage, and simple $0.15/GB pricing that scales predictably even at 10 TB+ per month. Its support for on-prem and VPC deployments ensures compliance while preserving enterprise-grade visibility.
For enterprises seeking cost efficiency, compliance readiness, and full-stack observability, CubeAPM is the clear choice. Get started with CubeAPM today and simplify your enterprise monitoring.
Disclaimer: The information in this article reflects the latest details available at the time of publication and may change as technologies and products evolve.
FAQs
1. How does enterprise monitoring differ from traditional IT monitoring?
Traditional IT monitoring focuses on uptime and server health. Enterprise monitoring covers the entire technology stack—applications, cloud, microservices, networks, and user experience—offering a unified view across complex, distributed environments.
2. Can enterprise monitoring improve compliance audits?
Yes. Enterprise monitoring tools maintain audit trails, access logs, and retention policies that make it easier to demonstrate compliance with regulations during audits.
3. What role does AI play in enterprise monitoring?
AI is used to reduce alert noise, detect anomalies, and speed up root cause analysis. In large enterprises, this helps teams cut through thousands of daily signals and focus on issues that impact SLAs and business outcomes.
4. How does enterprise monitoring support digital transformation?
As enterprises adopt microservices, Kubernetes, and multi-cloud strategies, monitoring tools ensure seamless visibility across old and new systems. This reduces downtime risks during cloud migrations or modernization initiatives.
5. Can enterprise monitoring integrate with existing ITSM or DevOps workflows?
Yes. Modern enterprise monitoring tools integrate with ticketing systems (ServiceNow, Jira), on-call tools (PagerDuty, Opsgenie), CI/CD pipelines, and collaboration apps (Slack, Teams), ensuring incidents flow directly into established enterprise workflows.


