Observability is now central to modern engineering. The observability tools market can become US$4.1 billion strong by 2028, as many organizations rely on these platforms to manage cloud-native systems.
However, traditional monitoring tools that only track CPU or uptime simply aren’t enough. Today’s teams need full visibility across metrics, logs, traces, and user experience data to detect, diagnose, and resolve issues faster and more accurately. Without that depth, teams are forced to sift through dashboards to piece together fragmented clues—time-consuming and prone to error.
Modern observability tools, such as CubeAPM, deliver clear context, low-noise alerts, and end-to-end insight so engineering teams can move from firefighting to proactive reliability. CubeAPM is one of the best observability tool providers with full OpenTelemetry support, MELT observability, smart sampling, flexible self-hosting, and transparent pricing.
In this article, we cover the top observability tools, comparing features, pricing, pros, cons, and best-fit scenarios to guide your decision.
Top Observability Tools
- CubeAPM
- Datadog
- New Relic
- Dynatrace
- Grafana Cloud
- Splunk Apdynamics
- Elastic Observability
- Coralogix
What is an Observability Tool?

An observability tool is a platform that helps engineering and operations teams understand the internal state of their systems by analyzing the data they generate—primarily logs, metrics, and traces (often called MELT: Metrics, Events, Logs, Traces). Instead of just showing surface-level monitoring (like CPU usage or uptime checks), observability tools allow teams to ask questions in real time, even about issues they didn’t anticipate.
For example, if an e-commerce site experiences checkout delays, observability tools can trace the problem across frontend latency, database queries, and API calls to pinpoint the root cause. In a healthcare system, they can ensure compliance by tracking every transaction while safeguarding sensitive data.
The advantages are clear:
- Faster incident resolution with deep root-cause analysis.
- Cost control by identifying inefficient services.
- Improved user experience through proactive monitoring.
- Future-proofing with OpenTelemetry-first support, ensuring freedom from vendor lock-in.
In short, observability tools turn complex, distributed systems into environments where engineers and business leaders alike can see, understand, and act with confidence.
APM tools vs Observability tools
APM Tools: Application Performance Monitoring (APM) tools focus on tracking the health of applications—things like response times, throughput, and error rates. They excel at detecting known performance issues and giving developers insights into how individual services or transactions behave.
Observability Tools: Instead of just monitoring known metrics, observability tools collect and correlate logs, metrics, traces, and user experience data (MELT) to answer questions you didn’t anticipate. While APM tools are valuable for application-level monitoring, observability platforms provide system-wide context across infrastructure, microservices, and user journeys.
Why Do Businesses Look for Different Observability Tools?
Cost Control & Signal-to-Noise Reduction
As telemetry volumes explode, raw “collect everything” strategies lead to ballooning bills and unusable dashboards. Modern teams now look for tools with tail-based sampling, log lifecycle management, and SLO-driven alerting to cut noise. Instead of paying for irrelevant logs or metrics, the focus is on retaining only data tied to errors, latency, or business outcomes—this makes observability affordable and actionable.
Ease of Use & Adoption
A common Reddit and G2 theme is frustration with steep learning curves, fragmented UIs, and long setup times. In the 2025 Grafana survey, 62% of teams said usability and interoperability drove tool selection. Engineers want opinionated defaults, clear onboarding paths, and guided playbooks to reduce time-to-value. A simple UI also helps non-technical stakeholders—like product managers—understand system health.
OpenTelemetry & Interoperability
With OpenTelemetry becoming the industry standard (NetworkWorld), organizations expect to instrument once and send data anywhere. This means choosing tools that ingest OTEL data natively, support multiple export backends, and offer compatibility with Prometheus, Elastic, or Datadog-style agents. Beyond avoiding lock-in, this also gives teams leverage to optimize costs across vendors and ensure long-term resilience if their stack changes.
Unified Signal Correlation (MELT)
Fragmented tools make troubleshooting painfully slow. Studies show enterprises still run 8–9 observability tools on average, creating silos that obscure the real issue (Nofire 2025 Observability Data Report). The shift now is toward MELT observability—Metrics, Events, Logs, and Traces in one platform. Unified observability reduces tool sprawl, accelerates root-cause analysis, and creates a shared view for developers, SREs, and leadership.
Tool Scope and Integration Needs Vary
Different organizations prioritize different layers of observability—some need deep APM and RUM, others emphasize log-heavy analytics or Kubernetes-native visibility. Tools also vary in how well they integrate with CI/CD, security stacks, and collaboration platforms. Teams often switch platforms to find the scope and ecosystem that matches their workflows.
No Single Platform Covers Everything
Despite vendor claims, no observability tool perfectly covers all use cases. Enterprises frequently run two or more platforms in parallel—for example, one for cost-effective log storage and another for frontend monitoring. This tool sprawl reflects real-world gaps and is a driver for evaluating new entrants.
Open-Source vs Commercial: Trade-offs Drive Choices
Open-source tools like Grafana OSS or SigNoz offer flexibility and low entry cost, but require engineering effort to scale and maintain. Commercial platforms provide managed services and advanced features, but costs can escalate quickly. The choice often comes down to balancing control, cost, and ease of use.
AI, Automation & Future-Ready Observability
AI-driven root cause analysis, anomaly detection, and automated remediation are must-haves today. Teams want platforms that learn from historical patterns and adapt to dynamic workloads instead of just reacting. Future-ready observability now means embracing AI, automation, and OpenTelemetry-native pipelines to stay ahead of complexity.
Top 8 Observability Tools
1. CubeAPM
Overview
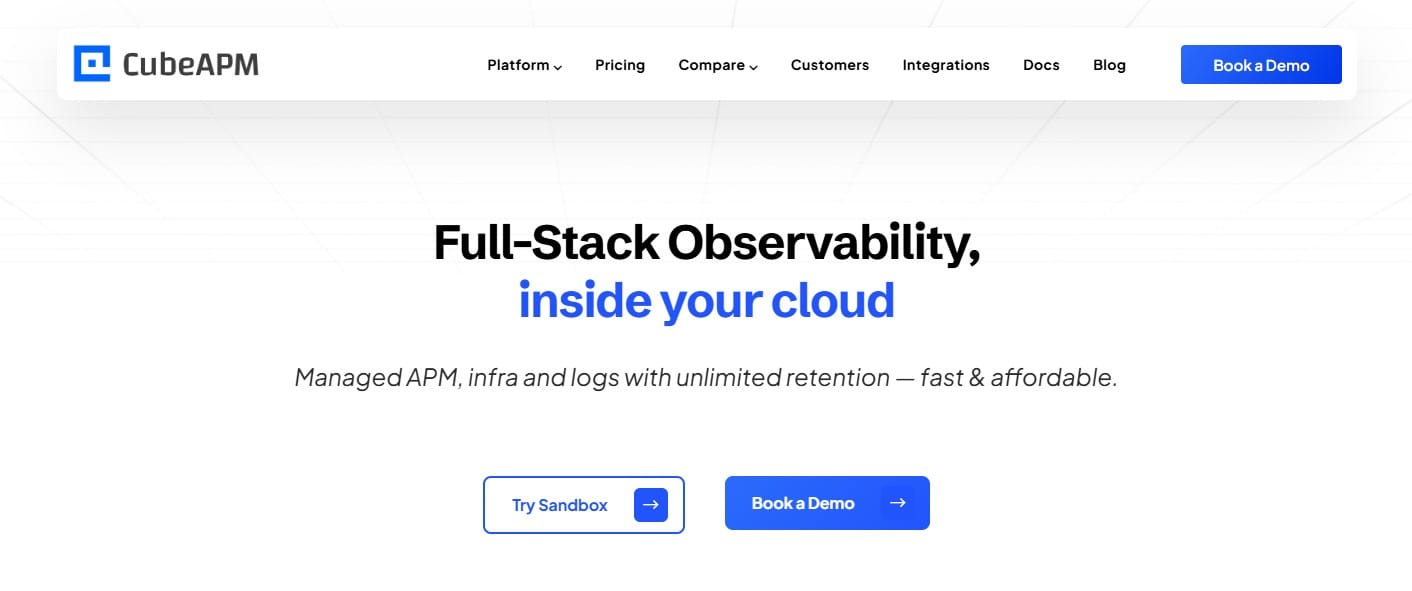
CubeAPM is an OpenTelemetry-native full-stack observability platform that brings together logs, metrics, traces, infrastructure, synthetics, RUM, and error tracking in a single dashboard. It’s built for speed, cost transparency, and compliance, offering teams the option to self-host for data localization or run in the cloud for simplicity. By processing telemetry closer to where it’s generated, CubeAPM delivers faster performance at a fraction of the cost compared to legacy SaaS APM providers. Its focus on ease of use, smart sampling, and flexible deployment has made it one of the most compelling choices for organizations moving away from expensive incumbents.
Key Advantage
CubeAPM’s biggest advantage is its smart sampling engine, which retains critical error and latency traces while filtering out routine noise. This ensures teams only pay for valuable insights, keeping costs predictable and analysis sharper without drowning in redundant data.
Key Features
- Built-in Interactive Dashboards: provide ready-to-use charts for latency, throughput, error rates, and service dependencies so teams get instant visibility without complex setup.
- Distributed Tracing & Error Inbox: captures the entire request flow across microservices and groups errors by endpoint, making it easy to pinpoint root causes quickly.
- Smart Sampling: applies contextual filters to retain anomalies like slow requests or failures while discarding repetitive traces, significantly reducing data ingestion costs.
- Infrastructure Monitoring: offers out-of-the-box support for Kubernetes, databases, caches, and messaging systems with preconfigured metrics visualized automatically.
- Rich Alerting & SLO Management: integrates with Slack, Email, PagerDuty, and other channels while supporting SLO-based multi-burn rate alerts that minimize alert fatigue.
Pros
- No hidden fees or egress charges, full transparency
- Seamless integration with 800+ platforms and agents
- Easy onboarding with intuitive dashboards and workflows
- OTEL-first architecture for vendor flexibility
- Option for self-hosting to meet compliance and data residency needs
Cons
- No cloud security management functionalities, focused primarily on observability
- Not suitable for teams looking for SaaS-only tools
CubeAPM Pricing at Scale
CubeAPM uses a transparent pricing model of $0.15 per GB ingested. For a mid-sized business generating 45 TB (~45,000 GB) of data per month, the monthly cost would be ~$7,200/month.
*All pricing comparisons are calculated using standardized Small/Medium/Large team profiles defined in our internal benchmarking sheet, based on fixed log, metrics, trace, and retention assumptions. Actual pricing may vary by usage, region, and plan structure. Please confirm current pricing with each vendor.
Tech Fit
CubeAPM is best suited for organizations running Kubernetes, microservices, and multi-cloud environments where scalability and interoperability are essential. It is especially valuable for industries like finance, healthcare, and government that require data localization and strict compliance. Its OTEL-native design also makes it ideal for developer-first teams who want flexibility, low operational overhead, and predictable costs without sacrificing depth of observability.
2. Datadog
Overview
Datadog is an observability platform that allows engineering teams to track application performance, infrastructure health, logs, and user experience. What makes it stand out is the sheer coverage—whether you’re running Kubernetes clusters, monitoring APIs, or analyzing frontend performance, Datadog has a module for it. Many companies choose it because it helps them consolidate multiple monitoring tools into one platform, even though the pricing can get complicated at scale.
Key Advantage
Datadog’s biggest advantage is the breadth of its ecosystem. With hundreds of integrations and built-in products, it can plug into almost any stack and give a unified view of systems without needing to piece together different tools.
Key Features
- APM with distributed tracing: traces requests across services, surfaces latency and error hot spots, and maps service dependencies to speed up root-cause analysis.
- Log management and pipelines: ingests and processes high volumes of logs with flexible routing and controls to decide what to retain, index, or archive for cost efficiency.
- Infrastructure and container monitoring: tracks hosts, Kubernetes clusters, and containers with curated views and health insights for ephemeral workloads.
- RUM and session replay: measures frontend performance and user journeys across web and mobile, with the option to replay sessions for faster UX troubleshooting.
- Synthetics (API and browser tests): continuously tests critical endpoints and flows from multiple locations, and ties test failures back to APM for full end-to-end context.
Pros
- Extremely broad feature set across MELT and digital experience monitoring
- Deep integration ecosystem for cloud, databases, queues, and developer tools
- Mature dashboards and visualizations that shorten time to value
- Strong RUM and synthetics for end-user performance and regression catching
- Frequent releases and AI-assisted workflows for faster triage
Cons
- Pricing complexity across hosts, GB ingestion, sessions, spans, and test runs
- No self-hosting; only SaaS
Datadog Pricing at Scale
Datadog charges differently for different capabilities. APM starts at $31/month; infra starts at $15/month; logs start at $0.10/GB, and so on.
For a mid-sized business ingesting around 45 TB (~45,000 GB) of data per month, the cost would come around $27,475/month.
Tech Fit
Datadog is best for organizations that value an all-in-one SaaS observability suite and don’t mind paying extra for the convenience. It’s well-suited for cloud-native teams running Kubernetes, multi-cloud services, or complex distributed systems that need coverage across logs, metrics, traces, RUM, and synthetics in a single pane of glass.
3. New Relic
Overview
New Relic is a popular SaaS-first observability platform that gives teams one place to watch application performance, infrastructure health, logs, and the end-user experience. It’s designed for busy engineering orgs that want to plug in quickly, see their services and dependencies light up, and get everyone—from backend folks to frontend and mobile teams—working from the same data. If you’re standardizing on a single console with broad coverage and polished workflows, New Relic is often on the shortlist.
Key Advantage
Breadth with one data model; New Relic ties APM, infra, logs, RUM, synthetics, errors, and dashboards together so cross-team investigations feel cohesive instead of hopping between tools.
Key Features
- APM with distributed tracing: follows requests across services and surfaces latency and error hotspots so teams can zero in on the slow step or failing dependency faster
- Log management and pipelines: ingests high-volume logs with routing and controls so you can decide what to retain, index, or archive for spend management
- Infrastructure and container monitoring: tracks hosts, clusters, and containers with curated health views that suit ephemeral Kubernetes workloads
- RUM with session replay: shows real user performance and lets you replay sessions to see what users actually experienced during an incident or regression
- Synthetics and change tracking: continuously tests APIs and browser flows, and overlays deploy markers so you can connect failures to recent releases quickly
Pros
- Wide coverage across MELT and digital experience monitoring
- Mature dashboards and shared queries that help teams align
- Errors Inbox and release markers that shorten triage loops
- Strong mobile and frontend capabilities, including session replay
- Large integration catalog and steady product velocity
Cons
- Usage-based model with ingest plus user types can feel complex to govern at scale
- No self-hosting; only SaaS delivery
New Relic Pricing at Scale
New Relic’s billing is based on data ingested, user licenses, and optional add-ons. The free tier offers 100 GB of ingest per month, then it costs $0.40 per GB after that.
For a business ingesting 45 TB of logs per month, the cost would come around $25,990/month.
Tech Fit
New Relic fits teams that want a polished, all-in-one SaaS observability suite covering backend, infra, and digital experience in one place. It’s a strong match for organizations running Kubernetes and multi-cloud apps that value fast time-to-value and broad product coverage, and are comfortable managing usage policies to keep data ingestion and retention costs in check.
4. Dynatrace
Overview
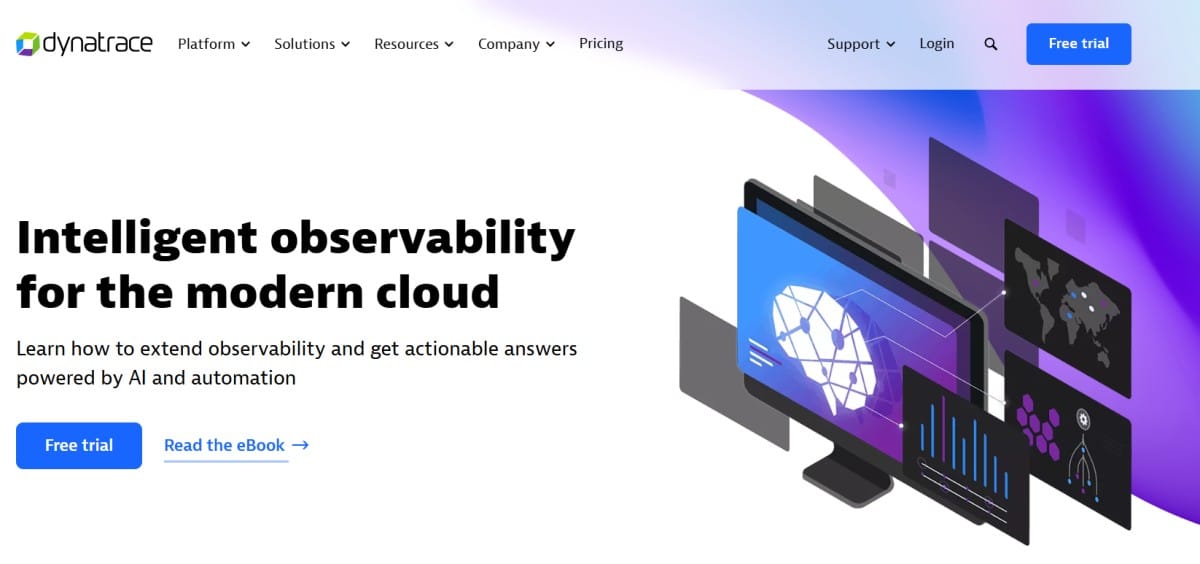
Dynatrace is built for teams that run complex, fast-moving systems and want one place to see how apps, infrastructure, and user experience tie together. Its OneAgent can auto-discover services and dependencies. Also, the platform layers in Davis AI for anomaly detection and root-cause hints. For organizations standardizing on a single console with strong automation and enterprise controls, it’s a common short-list pick for full-stack observability.
Key Advantage
AI-assisted troubleshooting at scale; Davis AI correlates signals across services and infrastructure to surface the most likely root cause, so teams spend less time hopping between tools and more time fixing what matters
Key Features
- Full-stack APM & distributed tracing: follows requests across microservices, highlights latency and errors, and maps service dependencies so engineers can zero in on the failing hop quickly.
- Grail log and event analytics: ingests high-volume logs and events into a searchable store with retention and query controls so you can tune cost without losing investigative depth.
- Kubernetes and cloud monitoring: auto-discovers clusters, pods, and nodes and ties workload health to service and infrastructure metrics for cleaner triage in ephemeral environments.
- Real User Monitoring & Session Replay: captures web and mobile performance from the user’s point of view and lets teams replay problem sessions to understand what actually happened.
- Synthetics for APIs and browsers: continuously tests key endpoints and user flows from multiple locations and links failures back to traces for end-to-end context.
Pros
- Broad product surface covering MELT, RUM, synthetics, and automation
- Strong AI-driven problem detection and causal analysis
- OneAgent auto-discovery reduces manual instrumentation overhead
- Mature dashboards and workflow guardrails for large teams
- Enterprise governance and access controls for regulated environments
Cons
- Pricing model spans hosts, ingest, retention, queries, and digital experience units
- Steep learning curve for new users due to platform depth
Dynatrace Pricing at Scale
Dynatrace log costs break down into three dimensions—ingestion, retention, and querying:
- Full stack: $0.01/8 GiB hour/month or $58/month/8GiB host
- Log Ingest & process: $0.20 per GiB
For a similar 45 TB (~45,000 GB/month) volume, the cost would be $21,850/month.
Tech Fit
Dynatrace fits enterprises that want AI-assisted, end-to-end observability across applications, Kubernetes, and user experience with strong governance baked in. It’s a solid match for multi-team environments that value automation, release-aware insights, and a single pane of glass, provided there’s an appetite to manage consumption settings and data policy so costs don’t creep as usage grows.
5. Grafana Cloud
Overview
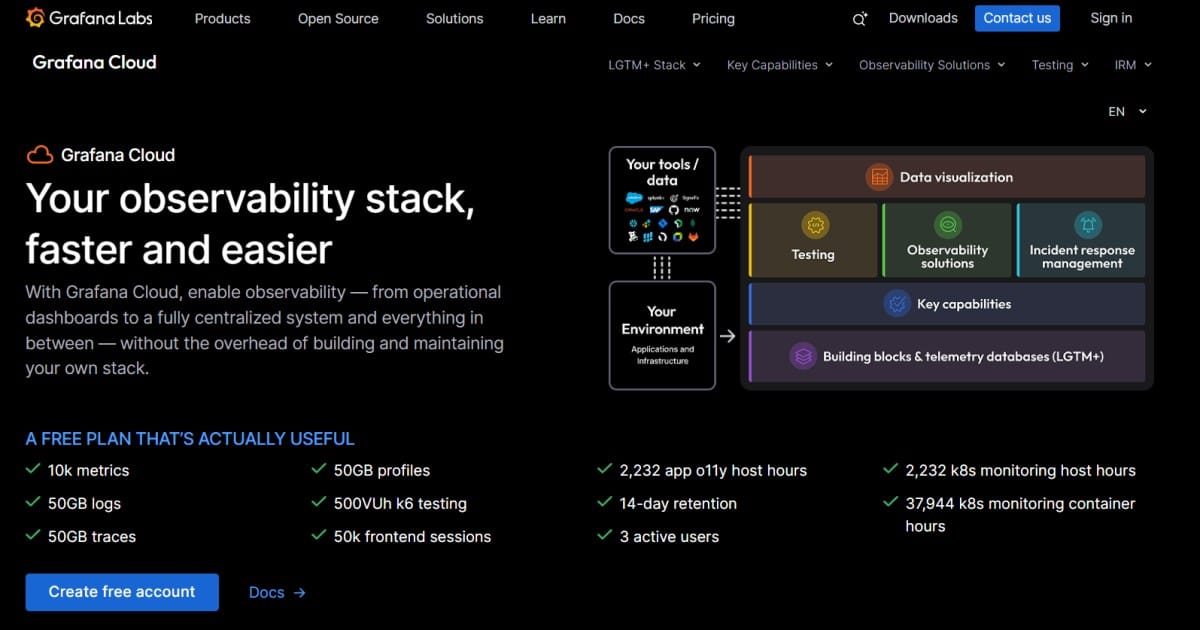
Grafana Cloud is the managed version of the open-source stack many teams already know: Grafana for dashboards, Loki for logs, Tempo for traces, Mimir/Prometheus for metrics, and Pyroscope for profiles. The appeal is simple—get the power of the OSS ecosystem without running it yourself, and keep logs, metrics, traces, and profiles under one roof. If your engineers love Grafana dashboards and you want an OTEL-friendly, OSS-aligned observability platform with guardrails, Grafana Cloud is a natural step up from self-hosting.
Key Advantage
Open-source DNA with a managed experience; you keep the flexibility and familiar query languages while handing off the scaling, upgrades, and reliability work to Grafana’s platform team
Key Features
- LGTM+ stack (Loki, Grafana, Tempo, Mimir, Pyroscope): unifies logs, metrics, traces, and profiles with first-class dashboards so investigations can move across signals without context switching.
- OpenTelemetry and Prometheus compatibility: accepts OTEL and Prometheus data natively, so you can instrument once and avoid lock-in while keeping existing exporters and agents.
- Built-in cost controls and usage visibility: includes billing dashboards, usage alerts, and retention controls so teams can shape what they ingest and how long they keep it to avoid bill creep.
- Cloud and k8 monitoring: auto-discovers k8 clusters and workloads, and links pod health to service and infrastructure metrics. This simplifies triage.
- RUM, synthetics, and incident workflows: measures real user performance, runs API and browser tests on schedules, and ties failures back to traces and logs for end-to-end context.
Pros
- OSS-first approach with a smooth path from self-host to managed
- Strong dashboards and query ergonomics across logs, traces, and metrics
- OTEL and Prometheus are friendly for flexible instrumentation strategies
- Useful cost-management tooling to monitor ingest, queries, and retention
- Wide ecosystem and steady product velocity
Cons
- Complex to set up
- Support beyond the community level is in paid plans
Grafana Cloud Pricing at Scale
Grafana Cloud pricing is transparent and usage-based (Pro plan adds a $19/month platform fee). Key list prices: Metrics at $6.50 per 1k active series, Logs/Traces/Profiles at $0.50 per GB ingested; Kubernetes Monitoring beyond the included free usage is $0.015 per host hour and $0.001 per container hour. The free tier includes helpful allowances (e.g., 10k series, 50 GB logs/traces/profiles, 2,232 host hours, 37,944 container hours).
For the mid-sized scenario of 45 TB data ingestion, teams may have to pay $11,875/month.
Tech Fit
Grafana Cloud fits teams who like the open-source way of working but prefer not to operate and scale Loki, Tempo, Mimir, and Pyroscope themselves. It’s a strong match for DevOps and SRE organizations running Kubernetes and multi-cloud services, especially if you want OTEL and Prometheus compatibility, flexible dashboards, and clear knobs to manage ingest and retention without giving up the OSS ergonomics your engineers already use every day.
6. Splunk AppDynamics
Overview
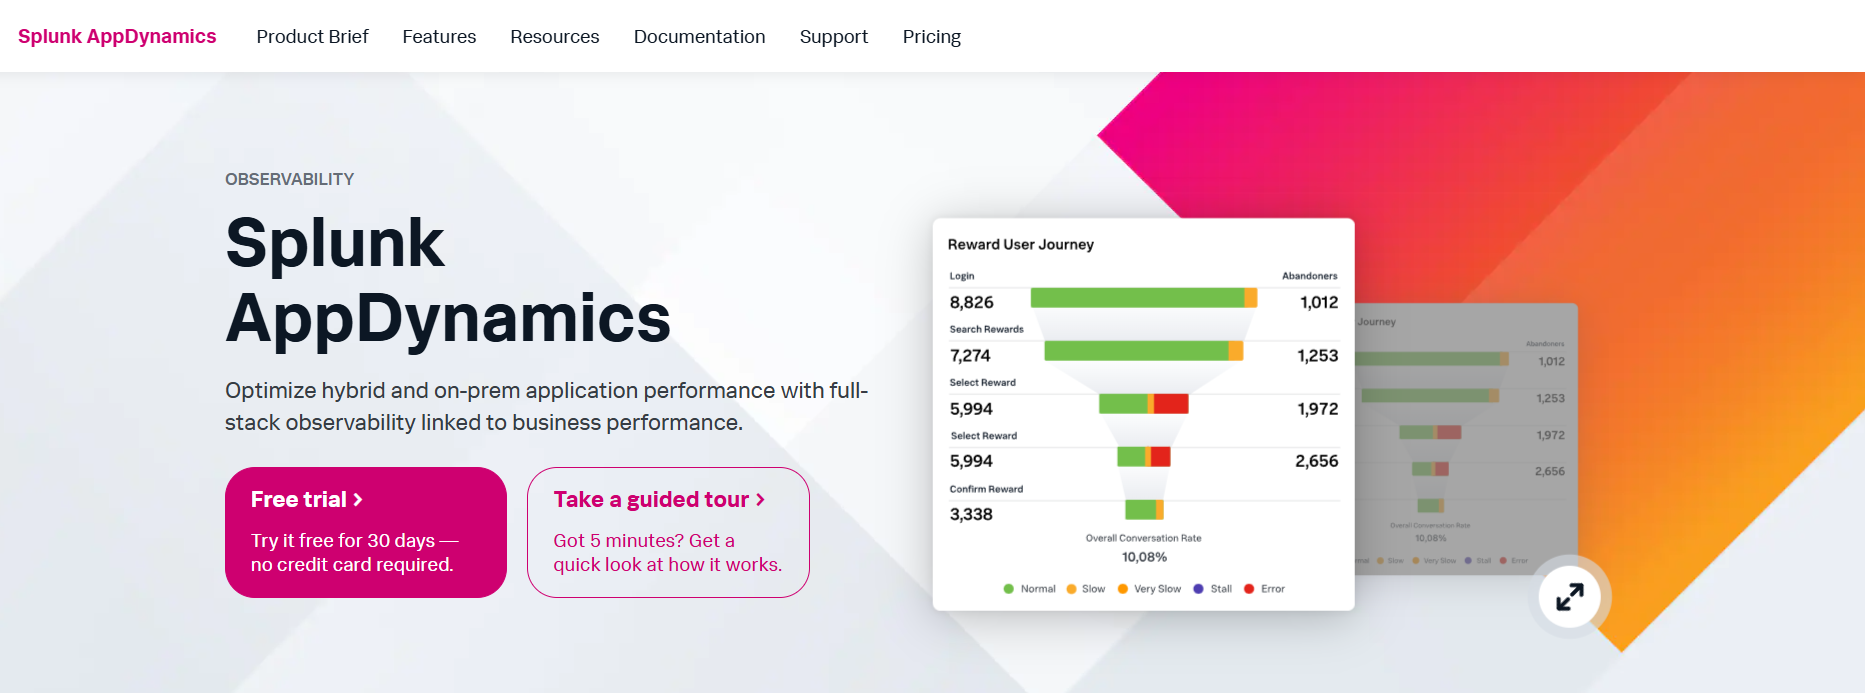
Splunk AppDynamics focuses on full-stack application observability with a strong link to business performance. It’s built to watch classic three-tier and hybrid apps end-to-end—services, databases, and user experience—while layering in baselines and anomaly detection so teams can tell when behavior drifts from normal. If you’re running on-prem or hybrid systems and want application maps, business transactions, and clean drill-downs from user to code, this is the lane it’s designed for.
Key Advantage
Business-linked APM for hybrid and on-prem apps; you get code-level performance tied to business transactions and user journeys so teams can prioritize fixes that actually move customer and revenue metrics.
Key Features
- Business transactions & service maps: model critical user flows and visualize how services, databases, and external calls interact, so slowdowns are traced to the exact hop quickly.
- Self-learned baselines & anomalies: learn normal behavior per metric and flag statistically significant deviations to reduce false positives during busy or quiet periods.
- Real User Monitoring (RUM): capture user journeys and frontend performance on web and mobile. Connects UX back to underlying services and queries.
- Synthetics (API and browser): run scripted tests from multiple locations to catch issues before users do and link failures to backend traces for faster root cause.
- Hybrid/on-prem depth: instrument traditional three-tier and SAP scenarios with emphasis on on-prem control and correlation to business outcomes.
Pros
- Strong APM with business transaction context
- Solid fit for hybrid and on-prem environments
- RUM and synthetics that tie back to backend performance
- Baselines and anomaly detection to cut alert noise
- Clear product path as part of the Splunk observability portfolio
Cons
- Learning curve
- Slower update cycle
- Alert issues
Splunk AppDynamics Pricing at Scale
AppDynamics pricing is based on CPU cores (vCPUs). The essential “Infrastructure Edition” starts at $6 per vCPU per month, while the “Premium Edition,” which includes log analytics along with app and DB monitoring, begins at $33 per vCPU per month.
For a mid-size organization ingesting 45 TB of data, the cost could be: $8,625/month.
Tech Fit
Splunk AppDynamics suits teams that run hybrid or on-prem applications and want APM tied closely to business transactions and user experience, plus guardrails like baselines to reduce noise. It’s a practical pick for organizations that need classic three-tier visibility, SAP or complex middleware support, and a clean path to integrate with other Splunk observability products—so long as you’re comfortable managing vCPU-based licensing and add-ons.
7. Elastic Observability
Overview
Elastic Observability brings the ELK roots (Elasticsearch + Kibana) to a modern, OTEL-friendly platform that covers logs, metrics, traces, profiling, RUM, and synthetics. The draw is powerful search and analytics on top of large telemetry volumes, plus flexible storage tiers so you can keep more data hot or searchable without running everything yourself. If your teams already think in Elasticsearch/Kibana terms and want deep query freedom with a managed experience, Elastic is a natural contender for full-stack observability.
Key Advantage
Elastic performs search-driven investigations and lets you pivot across logs, metrics, traces, and profiles with rich ad-hoc querying. Engineers can execute root cause analysis without switching tools.
Key Features
- OpenTelemetry-native intake: accepts OTEL signals for traces, metrics, and logs so you can instrument once and avoid lock-in while streaming data directly into Elastic.
- ES/QL and ad-hoc analytics: query telemetry interactively using a unified language and Kibana workflows to slice high-cardinality data during incidents.
- Tiered storage and searchable snapshots: tune hot, warm, and long-term retention to control cost while keeping historical data discoverable when you need it.
- AIOps and AI Assistant: surface anomalies and patterns automatically and use natural-language assistance to speed up triage.
- Universal Profiling and experience monitoring: add code-level profiling plus RUM and synthetics to connect backend performance with actual user journeys.
Pros
- OTEL-first ingestion with strong search and query ergonomics
- Flexible retention with tiered storage to keep more data searchable
- Wide integrations and mature Kibana dashboards
- Serverless and cloud-hosted options to match operating preferences
- Good path for teams already using Elasticsearch in-house
Cons
- Learning curve; needs strong familiarity with ElasticSearch, Kibana, and KQL
- Paid support is costly; 5-15% of billing
Elastic Observability Pricing at Scale
Elastic’s Serverless Observability pricing starts around $0.15/GB for ingest and $0.02/GB/month for retention. Egress beyond the free tier is $0.05/GB, premium support is an additional 5-15% of monthly spend, and synthetic monitoring is billed separately at $0.10 per 10,000 test runs.
Mid-sized scenario (45 TB/month ingest): Estimated total around $17,435/month.
Tech Fit
Elastic Observability fits teams that want search-centric workflows and fine-grained control over how telemetry is stored, queried, and retained. It’s a strong match for organizations running Kubernetes and multi-cloud services that also want to keep a longer history searchable for compliance or post-incident analysis, provided you’re comfortable tuning ingestion, storage tiers, and optional add-ons to keep spend aligned with your goals.
8. Coralogix
Overview
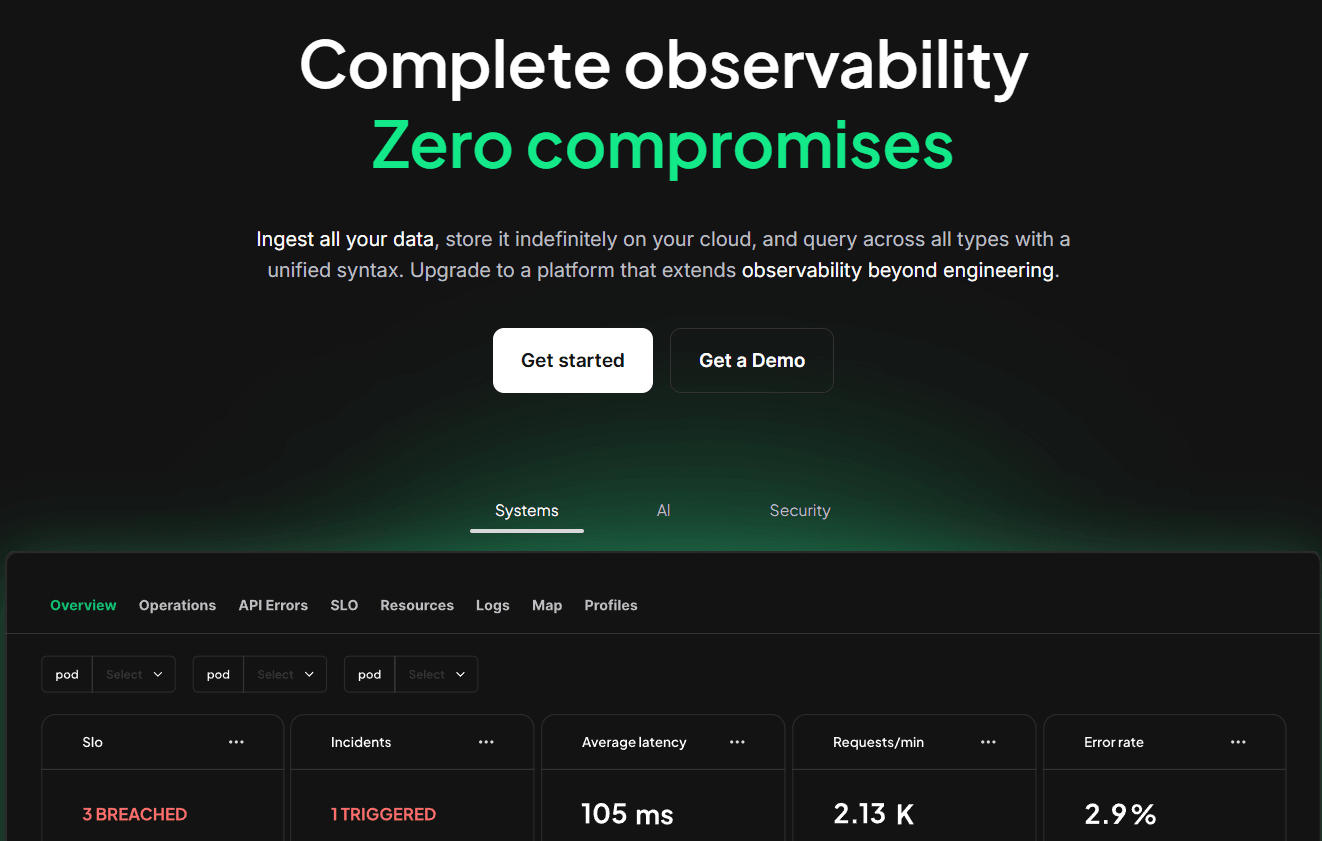
Coralogix is a full-stack observability platform built to keep large volumes of telemetry searchable without forcing you to index everything up front. It brings logs, metrics, and traces together, then routes each stream through purpose-built pipelines so you can keep high-value data hot while sending routine traffic to cheaper paths. If your team wants strong search and analytics with practical knobs for cost control, Coralogix is a thoughtful, OTEL-friendly option.
Key Advantage
It offers pipeline-based cost control by sending different data to “Frequent Search,” “Monitoring,” or “Compliance/Archive” pipelines. You can shape what stays hot and what gets stored more cheaply, so investigations remain fast without paying to index every event.
Key Features
- Index-free architecture: avoids always-on indexing and lets you keep investigations fast by searching recent or high-value data directly, while reserving cheaper paths for routine traffic.
- OpenTelemetry-native ingestion: accepts OTEL signals for logs, metrics, and traces so you can instrument once and stream data in without proprietary agents.
- Tiered pipelines for TCO: routes data into Frequent Search for interactive queries, Monitoring for dashboards and alerts, or Compliance/Archive for long-term retention at lower cost.
- Flexible querying and analytics: pivots across logs, traces, and metrics with rich filters and correlations, so on-call engineers can move from symptom to root cause quickly.
- Alerting, SLOs, and experience data: ties detectors and SLO burn rates to the same telemetry, and supports frontend and synthetic signals to validate user journeys end to end.
Pros
- Strong cost controls via pipeline routing and unit budgeting
- Search-forward workflow that scales to high log volumes
- OTEL-friendly ingestion and broad ecosystem integrations
- Good fit for teams that need long retention
- Managed experience that removes a lot of self-hosting overhead
Cons
- Learning curve
- Occasional UI issues
Coralogix Pricing at Scale
Coralogix pricing is consumption-based or per-GB.
- Logs: $0.42/GB
- Traces: $0.16/GB
- Metrics: $0.05/GB
For a mid-sized company ingesting 45 TB/month of logs, metrics, and traces, the cost comes down to about $13,200.
Tech Fit
Coralogix suits teams that generate heavy log volumes and want granular control over what stays hot, what powers dashboards, and what moves to cheaper storage. It’s a solid match for Kubernetes and microservices environments where engineers value fast search on recent data, OTEL-native ingestion, and clear levers to keep spend aligned with the importance of each signal.
Best APM Tools by Use Case & Technology
Kubernetes-Heavy Environments
Kubernetes brings scale, but also complexity with ephemeral pods, service discovery, and high-cardinality data. Observability platforms here must excel at auto-discovery, container visibility, and multi-cloud monitoring.
- Datadog: popular for Kubernetes observability with automatic pod discovery and deep dashboards for container workloads
- CubeAPM: OTEL-native and cost-efficient, it scales smoothly with Kubernetes clusters while offering strong trace-log-metric correlation
- Grafana Cloud: built around open-source Prometheus and Loki, it provides strong visualization and affordable monitoring for clusters
Frontend-Oriented & Cloud-Hosted Services
For modern SaaS and mobile apps, observability goes beyond the backend—it must capture real user monitoring (RUM), frontend errors, and API latency.
- CubeAPM: combines RUM, error tracking, and distributed tracing to give developers end-to-end visibility from UI clicks to backend services
- New Relic: known for robust RUM and mobile monitoring, tying frontend performance with backend traces in a single platform
- Grafana Cloud: integrates RUM and synthetics into its observability suite, offering visibility across frontend and API interactions
Observability in Secure or Compliant Networks
Regulated industries (finance, healthcare, government) require observability solutions that respect strict data residency, GDPR, and HIPAA requirements.
- CubeAPM (Self-Host): deployable on-premises, it offers full OTEL observability while ensuring sensitive data stays inside your secure boundary
- Dynatrace: provides enterprise-grade on-prem deployments with strict compliance features for large regulated organizations
- Splunk AppDynamics: strong in enterprise observability, with hybrid deployment options to meet compliance standards
AI/ML-Driven Observability
AI applications demand observability that not only tracks infra metrics but also detects anomalies, drift, and inference errors in real time.
- Dynatrace: its Davis AI engine continuously correlates anomalies across infrastructure, apps, and AI workloads
- Elastic APM: leverages AIOps to surface unusual telemetry patterns and provide intelligent anomaly detection
- Datadog: offers AI-powered triage and log pattern detection, making it easier to spot unexpected behavior in complex ML stacks
Self-Hosted / Open-Source Friendly
For teams prioritizing cost control, customization, or compliance, self-hosted and open-source observability tools provide the flexibility to run on their own terms.
- SigNoz: an open-source APM built on OTEL, giving teams self-hosted observability without vendor lock-in
- Elastic APM: part of the ELK stack, it offers open-source tracing, logging, and metrics with strong community support
- Grafana OSS: widely adopted for metrics and visualization, extendable with Loki and Tempo to cover logs and traces
How to Choose the Right Observability Tool
Consider the following factors while choosing an observability platform for your team:
1. Prioritize Signal Quality Over Quantity
Collecting “everything” often overwhelms teams with noise while inflating costs. Today, engineering leaders emphasize the need for tail-based sampling, anomaly filtering, and SLO-aligned alerting to focus only on signals that truly impact reliability and user experience. The right tool should highlight anomalies tied to latency, errors, or service degradation instead of flooding teams with irrelevant metrics. This ensures engineers spend less time sifting through dashboards and more time solving real problems.
2. Consider Total Cost of Ownership (TCO) Over Time
Pricing remains one of the most debated issues in observability. Beyond license fees, costs often spiral due to data ingestion, retention, user seats, and add-on features like synthetics or RUM. A mid-sized company ingesting 10TB monthly can see bills range from $1,500 to $8,000+, depending on the vendor. The ideal tool offers transparent, predictable pricing models that scale with usage — making it easier for teams to budget without bill shock as telemetry grows.
3. Ensure Broad Stack Compatibility & Vendor Flexibility
Modern infrastructures blend Kubernetes, serverless, VMs, and multi-cloud environments. A suitable observability platform must offer native OpenTelemetry support, SDKs across major languages, and integrations with popular CI/CD and infrastructure tools. Vendor lock-in is a growing concern, so tools that let teams instrument once and redirect data to multiple backends provide far greater flexibility. This adaptability safeguards long-term observability investments.
4. Evaluate Ease of Deployment & Ongoing Use
Complexity kills adoption. Many teams complain that tools with steep learning curves slow down onboarding and reduce ROI. Effective solutions emphasize guided setup, intuitive dashboards, and strong documentation so teams can go live in hours rather than weeks. Ease of use also means empowering developers, not just SREs, with accessible insights — turning observability from a specialized function into a collaborative, organization-wide capability.
5. Assess Data Residency, Deployment Flexibility & Compliance
Compliance with GDPR, HIPAA, PCI-DSS, and regional residency laws often requires self-hosted or region-locked deployments. The best tools offer flexible deployment models — from SaaS to hybrid to fully on-premises — giving organizations control over their telemetry data while still maintaining modern observability capabilities.
6. Look for Advanced Root Cause Analysis & AI Capabilities
As infrastructures become more dynamic, manual troubleshooting can’t keep up. Observability platforms are increasingly embedding AI-driven anomaly detection, automated root cause hints, and predictive alerting. These features help teams detect issues before they escalate, catch drift in AI/ML pipelines, and reduce alert fatigue by surfacing only meaningful incidents. Today, AI-assisted observability is no longer a nice-to-have — it’s a necessity for scaling operations efficiently.
Conclusion
Teams struggle when choosing the right observability tool because of unpredictable costs, noisy data, complex onboarding, and compliance hurdles. Even with advanced features, many tools fail to balance signal quality, affordability, and ease of use — leaving engineers frustrated and budgets stretched thin.
This is where CubeAPM stands apart. As the best observability tool provider, it combines full OpenTelemetry support, MELT (Metrics, Events, Logs, Traces) correlation, smart sampling, and 800+ integrations in a platform that’s simple to deploy and scale. With transparent $0.15/GB pricing, flexible self-hosting, and compliance-ready options, CubeAPM helps teams achieve deep visibility without runaway costs.
If your goal is to make observability powerful yet predictable, CubeAPM is the solution you’ve been waiting for. Start today and see how CubeAPM transforms your observability strategy into a true business advantage.
Disclaimer: The information in this article reflects the latest details available at the time of publication and may change as technologies and products evolve.
FAQs
1. What are the top observability tools?
Some of the most popular observability tools include CubeAPM, Datadog, New Relic, Dynatrace, Grafana Cloud, Splunk AppDynamics, Elastic Observability, and Coralogix. These platforms provide varying levels of visibility into logs, metrics, and traces, with CubeAPM standing out for its OpenTelemetry-first design and cost transparency.
2. How do observability tools differ from monitoring tools?
Monitoring tools track known metrics and thresholds, while observability tools go deeper, allowing teams to explore unknown issues through logs, metrics, traces, and events. This makes it easier to troubleshoot complex, distributed systems. Tools like CubeAPM integrate all four signal types into a single platform, ensuring faster root cause analysis and better collaboration.
3. Why is pricing such a big issue with observability tools?
Pricing in observability often scales with data ingestion, retention, and user seats. Vendors like Datadog and New Relic can be costly for smaller teams with tight budgets, as data volumes grow. CubeAPM solves this problem with a simple $0.15/GB model, making it easy for teams to plan and avoid unexpected bills even at scale.
4. Which observability tool is best for Kubernetes and cloud-native environments?
For Kubernetes-heavy and multi-cloud setups, teams often use Datadog, Dynatrace, or Grafana Cloud. However, CubeAPM has gained traction due to its native OpenTelemetry support, strong Kubernetes integrations, and smart sampling strategy, making it ideal for cloud-native teams seeking performance without overspending.
5. What should I look for when choosing the right observability tool?
Key factors include cost predictability, OpenTelemetry compatibility, ease of deployment, compliance readiness, and AI-assisted insights. Many tools excel in one or two areas but fall short in others. CubeAPM strikes the right balance by offering full MELT support, self-hosting flexibility, and advanced AI-driven sampling in one affordable package.


