Businesses are drowning in log data—struggling to sift through terabytes daily, balancing soaring costs against the need for actionable insights and compliance. The global log management market is estimated at around US$3.76 billion, and it’s set to double to US$7.88 billion by 2030.
Log management tools solve this with centralized storage, indexing, search, visualization, real-time alerting, and compliance-ready retention policies. Advanced platforms also integrate with OpenTelemetry (OTel) and use machine learning for anomaly detection, DevOps troubleshooting, SIEM-driven security analytics, and more.
But choosing the wrong tool can lead to runaway costs, alert fatigue, or blind spots in your stacks. CubeAPM is one of the best log-monitoring tool providers on the market. It offers full support for OTEL and MELT, multiple agent support, flexible self-hosting, cost-effective pricing, and high-quality support.
In this article, we’ll walk you through the top 8 log-monitoring tools in 2025, comparing their features, pricing, and ideal use cases to help you find the right fit for your team.
Top 8 Log Management Tools
- CubeAPM
- Datadog
- New Relic
- Dynatrace
- SigNoz
- Graylog
- Splunk Apdynamics
- Sumo Logic
What is a Log Management Tool?
A log management tool is software that helps organizations collect, process, analyze, and visualize log data from across their IT systems. Logs are automatically generated by applications, servers, containers, databases, and network devices. Without centralized management, these logs quickly pile up into terabytes of raw data, making it nearly impossible to extract useful insights.
Modern teams can use log management platforms to:
- Search and filter logs in real time, pinpointing anomalies within seconds.
- Correlate logs with traces and metrics, providing end-to-end observability across distributed systems.
- Set up alerts and dashboards to monitor system health proactively.
- Meet compliance needs by retaining logs securely for audits (HIPAA, PCI DSS, GDPR).
Example: Resolving E-Commerce Outages in Minutes with Efficient Log Management
For example, imagine an e-commerce company during a holiday sales surge. Suddenly, customers start reporting failed checkouts. Without a log management tool, engineers would need to manually dig into fragmented server logs across multiple clusters. With a centralized solution, the team can instantly query checkout service logs, correlate them with database latency traces, and discover that a misconfigured connection pool is throttling requests. The issue gets resolved in minutes instead of hours, saving revenue and user trust.
In short, log management tools turn raw, noisy machine data into actionable insights, helping teams maintain uptime, reduce MTTR (Mean Time to Recovery), and keep infrastructure costs predictable.
Why Teams Choose Different Log Management Tools
Centralized Logging & Searchability
Teams want to avoid SSH’ing into multiple servers and tailing logs individually. Using a log management tool, they can centralize logs from containers, microservices, and cloud platforms into one searchable interface.
Troubleshooting & Root Cause Analysis
When production issues occur (e.g., latency spikes, failed requests, service crashes), engineers need to correlate logs across systems. Without centralized log management, debugging distributed systems is almost impossible.
Scalability & Retention
Native logging (like kubectl logs or plain text files) doesn’t scale for large deployments. Log management tools handle massive ingestion volumes and provide retention policies. Engineers mention wanting to “store 30–90 days of logs without S3 DIY hacks.”
Correlation with Metrics & Traces
Logs are useful, but when you combine them with APM metrics and distributed traces, they give full observability. This is why teams often evaluate log management alongside APM tools.
Rising Data Costs and Performance Overhead
Log volumes have exploded with cloud-native and microservice architectures. Many tools charge per GB ingested, per query, and even for retention. As logs grow into terabytes, bills spiral quickly—sometimes costing more than the infrastructure itself.
Over-logging can also slow down servers, forcing teams to provision more instances just to handle the monitoring load. This makes engineers feel like they’re paying double—once for the logs, and again for the infrastructure needed to process them.
Alert Fatigue and Slow Troubleshooting
In many setups, logs, metrics, and traces live in separate tools. Developers must piece together insights manually, which delays incident response and increases alert fatigue. When every tool has its own dashboards and alerts, teams drown in noise instead of focusing on the real issues. The lack of context across telemetry signals means that problems take longer to detect, diagnose, and resolve.
Vendor Lock-In and Opaque Pricing
One of the biggest complaints in communities like Reddit is that pricing models are too complex and unpredictable. Teams often start on a free or low-cost tier, only to see bills spike as log volumes grow. Pricing based on multiple factors—like ingestion, indexing, storage, and query scans—makes it hard to forecast costs. On top of that, proprietary agents and formats make it difficult to switch vendors, locking teams into expensive long-term contracts.
Challenges Balancing Open-Source and SaaS
Open-source tools like SigNoz or Graylog offer flexibility and control but often require significant operational overhead—managing clusters, scaling storage, and maintaining pipelines. On the other hand, SaaS options like Datadog or Sumo Logic are easier to use but come with steep costs at scale. Teams are often caught between saving money and investing time in maintenance, or saving time but overpaying for a SaaS platform.
Need for OpenTelemetry and Future-Proofing
OpenTelemetry has become the de facto standard for instrumentation in 2025. Teams want tools that are OTEL-native so they can avoid re-instrumenting code if they change providers. This gives them portability and ensures that their observability setup will keep working even as vendors change pricing, features, or product direction. Tools without strong OTEL support feel outdated, forcing teams to consider alternatives that align with modern standards.
8 Log Management Tools
1. CubeAPM
Overview
CubeAPM is an advanced log management and APM platform that has an OpenTelemetry (OTEL)-centric design. It processes metrics, logs, traces, and events from applications and infrastructure, giving teams a straightforward way to search, analyze, and monitor systems in real time. Its architecture is optimized for speed—delivering results 2–4× faster than older platforms—while helping businesses cut costs by as much as 60–80%. CubeAPM also offers flexible deployment, whether on-premises, self-hosted, or hybrid setups, making it suitable for organizations with different compliance or budget needs.
Key Advantage
CubeAPM stands out for being cost-effective and highly performant. Its Smart Sampling capability automatically filters out repetitive or less relevant logs and retains the most meaningful data. This allows businesses to manage large-scale telemetry while keeping storage needs and expenses predictable. Combined with OTEL-native support, CubeAPM provides broad visibility without the lock-in or hidden fees of legacy vendors.
Key Features
CubeAPM’s log management capabilities are designed for teams handling modern, distributed systems:
- Flexible ingestion pipeline: Works seamlessly with multiple agents and shippers, including Elastic (Logstash, Fluent), Loki, OTEL, and Vector. This makes it easy to plug into existing setups without rebuilding pipelines.
- Rich log structuring: Handles both structured and unstructured logs. Nested JSON fields are automatically flattened and indexed, so engineers can run precise queries across any field without extra parsing effort.
- Configurable log fields: Offers customization of important fields such as _msg (log message), _time (timestamp), and stream fields. Teams can control these at ingestion using headers or query parameters, ensuring consistency across logs.
- Smart Sampling: Intelligently reduces noise by prioritizing logs linked to slow transactions, errors, or spikes in latency. This keeps costs manageable while still preserving the data needed for root cause analysis.
- MELT coverage: By integrating Metrics, Events, Logs, and Traces in one place, CubeAPM allows engineers to quickly jump between a log entry, its related metric anomaly, and the distributed trace that triggered it—helping identify issues faster.
Pros
- 800+ integrations
- Supports many agents for log aggregation, such as k8, Amazon S3 and ECS, Logstash, tec
- High performance with fast log searches
- Predictable and lower cost compared to legacy vendors; no egress charges
- Smart Sampling ensures important data isn’t lost
- OTEL and MELT support for modern observability
- Flexible deployment, including self-hosting
Cons
- An observability-focused provider, with no support for cloud security management features
- May not suit if you’re looking for a SaaS-only platform
Tech Fit
CubeAPM is well-suited for cloud-native environments that rely on Kubernetes and microservices, as well as polyglot applications built on Java, Node.js, Python, and Go. It’s particularly valuable for organizations adopting OpenTelemetry and looking for transparency in costs while handling high volumes of log data. For heavily regulated industries, CubeAPM’s on-prem deployment makes it an ideal fit.
Pricing at Scale
CubeAPM uses a transparent pricing model of $0.15 per GB ingested. For a mid-sized business generating 45 TB (~45,000 GB) of data per month, the monthly cost would be ~$7,200/month.
This predictable pricing makes it easier for teams to budget and plan, while Smart Sampling ensures that the most important logs are always retained without driving up unnecessary costs.
*All pricing comparisons are calculated using standardized Small/Medium/Large team profiles defined in our internal benchmarking sheet, based on fixed log, metrics, trace, and retention assumptions. Actual pricing may vary by usage, region, and plan structure. Please confirm current pricing with each vendor.
2. Datadog
Overview
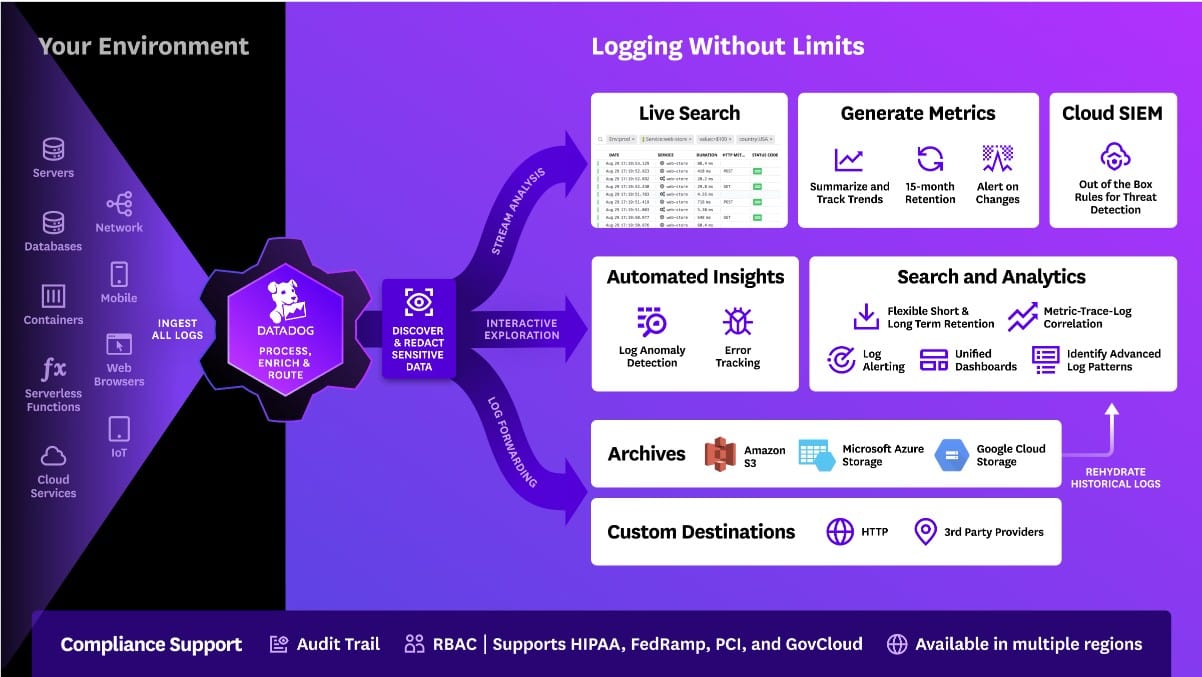
Datadog is one of the most widely adopted SaaS platforms for observability, covering logs, metrics, traces, security, and user monitoring in a single interface. It’s known for its extensive integrations across cloud providers, containers, and databases, making it a go-to choice for enterprises managing complex, distributed systems.
Key Advantage
Datadog’s strength lies in its breadth of capabilities. Teams can monitor infrastructure, analyze logs, trace distributed services, track user sessions, and run security checks—all in one platform. This makes Datadog attractive for organizations that want to consolidate multiple monitoring tools into a single vendor solution.
Key Features
Datadog offers one of the most feature-packed log management solutions:
- Log ingestion and processing at scale: Handles millions of log events per second, with support for real-time parsing and enrichment. Teams can process logs as they come in and route them to the right services, or archive them to cheaper storage when they’re not immediately needed.
- Flexible storage with Flex Logs: For teams dealing with huge log volumes, Datadog’s Flex Logs tier separates log ingestion from retention. This allows logs to be stored more affordably, while only indexing the ones that need to be searchable, helping balance visibility with cost.
- 600+ built-in integrations: Datadog has one of the largest ecosystems in the industry, covering AWS, Azure, GCP, Kubernetes, Docker, popular databases, and messaging queues. This makes onboarding faster, especially for large or hybrid environments.
- Advanced dashboards and alerting: Logs can be turned into metrics, charted on custom dashboards, and tied to alerts. This allows DevOps and SRE teams to detect anomalies quickly and correlate them with metrics or traces.
- Telemetry pipelines for cost control: Datadog provides routing and filtering pipelines so teams can decide which logs to index, which to archive, and which to discard. This feature is crucial for keeping costs predictable when dealing with terabytes of daily data.
Pros
- A broad set of observability and security features
- Large ecosystem of integrations across clouds and infrastructure
- Flex Logs helps optimize costs for high-volume data
- Strong dashboards and alerting for operational teams
Cons
- Pricing complexity with per host and ingestion-based pricing
- SaaS-only; no self-hosting
Tech Fit
Datadog is best suited for enterprises running at scale on multi-cloud and Kubernetes environments, where its integrations and breadth of features can be fully leveraged. It fits teams with dedicated DevOps, SRE, and security staff who need deep visibility across their entire stack. For smaller companies that prioritize cost transparency and predictability, Datadog’s pricing model may feel restrictive.
Pricing at Scale
Datadog charges differently for different capabilities. APM starts at $31/month; infra starts at $15/month; logs start at $0.10/GB, and so on.
For a mid-sized business ingesting around 45 TB (~45,000 GB) of data per month, the cost would come around $27,475/month.
3. New Relic
Overview
New Relic offers an intelligent observability platform that brings together log management, metrics, traces, APM, infrastructure, and serverless monitoring, digital experience, and AIOps—all in one package. Teams love it for handling every telemetry type under a single roof, with a strong focus on real-time insight and user-friendly tools.
Key Advantage
The biggest draw of New Relic is how it blends logs into a broader observability context, with features like AI-driven anomaly detection, enriched dashboards, and seamless correlation across your full stack. Log insights are delivered with context—from tracing to metrics to frontend performance—so you don’t just see failures, you understand why they happened and how to fix them.
Key Features
Here’s what stands out about New Relic’s log capabilities, described naturally and conversationally:
- Effortless log ingestion: You can push logs from almost anything—APM agents, Fluentd, syslog, AWS Kinesis, or even without any agent at all. It fits right in with your existing tools and environment.
- Logs that talk to your context: Logs aren’t siloed—they come with trace IDs, error details, and metric data already attached. So when you spot a log, you often get the full picture, rather than needing to chase multiple tools.
- Fast, intuitive search and dashboards: Whether you’re using Lucene syntax or NRQL (New Relic Query Language), you can refine searches instantly. Dashboards are drag-and-drop ready and can power alerting in seconds.
- Smart, generative alerts: Their AI looks for unexpected patterns in your logs, curving out noise and highlighting signals. So you get alerted to real problems before they escalate.
- Built-in compliance and retention workflow: Everything from ingestion to archival is baked into the platform. Retention policies are simplified and don’t require juggling separate storage tools.
Pros
- Full-stack observability with logs, metrics, traces, and more in the same tool
- AI-powered log analysis and alerts
- Easy log forwarding with rich context
- Built-in data retention and compliance features
Cons
- Pricing involves multiple dimensions—user tier, log ingestion, retention levels
- SaaS-only; no self-hosting
Tech Fit
New Relic shines in complex environments where teams want a single view of their entire software ecosystem—including applications, infrastructure, and digital experience. It suits development and SRE teams seeking fast incident resolution, AI-based insights, and robust visual tooling. If you’re managing modern microservices, customer-facing apps, or hybrid cloud stacks, New Relic plays very nicely with all of that.
Pricing at Scale
New Relic’s billing is based on data ingested, user licenses, and optional add-ons. The free tier offers 100 GB of ingest per month, then it costs $0.40 per GB after that.
For a business ingesting 45 TB of logs per month, the cost would come around $25,990/month.
4. Dynatrace
Overview
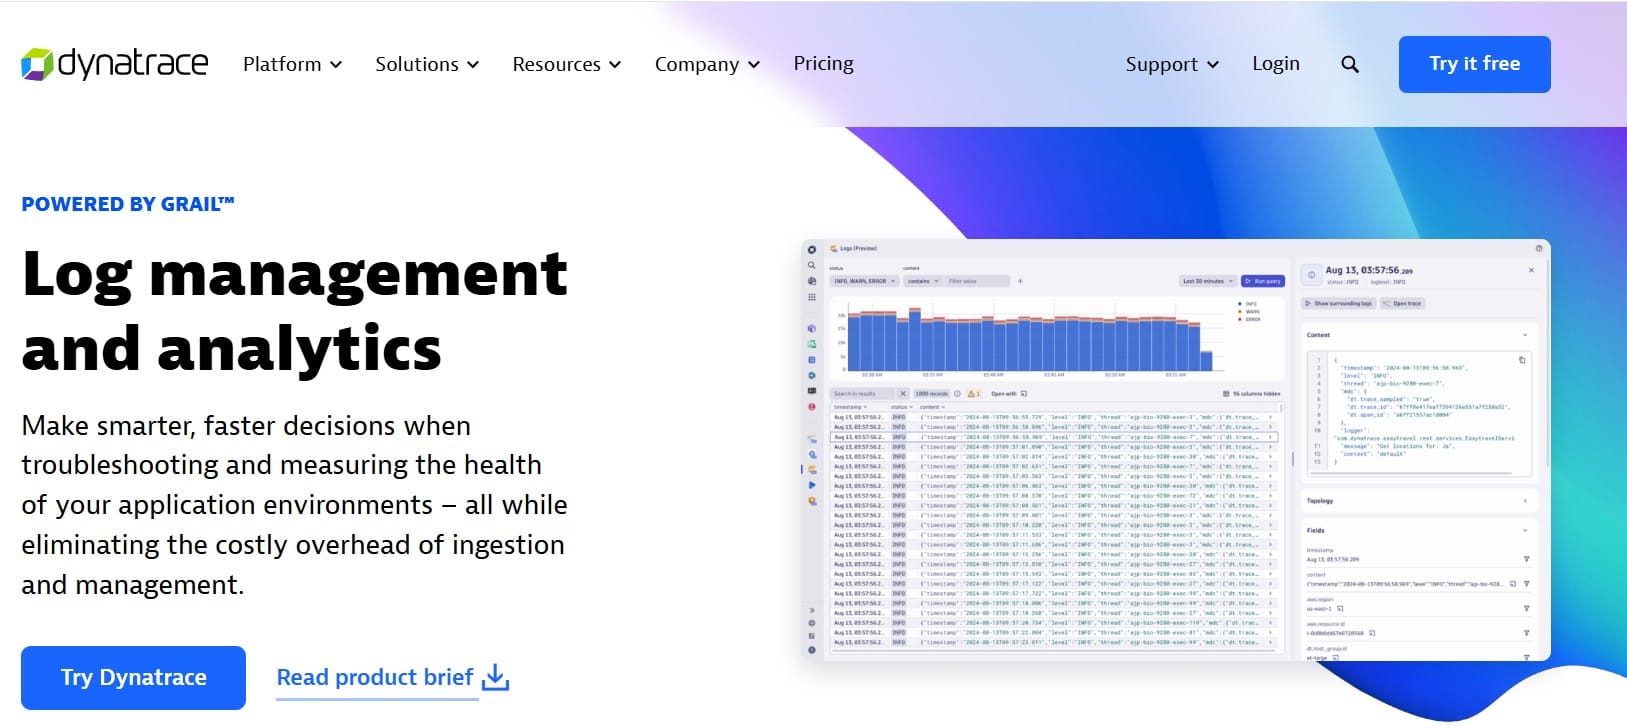
Dynatrace offers a feature-rich observability platform built to support large-scale, cloud-native, and traditional environments alike. It delivers capabilities across applications, infrastructure, Kubernetes, logs, security, and digital experience within one unified Grail-based system—bringing context-rich insights from logs, metrics, traces, and events.
Key Advantage
Its standout strength is AI-driven full-stack visibility—Dynatrace applies context automatically as logs are ingested, making it easier for teams to spot anomalies and root causes without stitching data from multiple tools.
Key Features
- Smart log ingestion and enrichment: Incoming logs are automatically tagged with infrastructure metadata and topology context, so they’re meaningful right out of the box. That saves time compared to manual tagging.
- Powerful retention options: Choose between “Retain with Included Queries”—which bundles 10–35 days of storage with unlimited querying—or usage-based pricing, perfect for longer retention and flexible access demands.
- DQL-powered querying: Dynatrace Query Language (DQL) lets you explore logs with real-time queries, dashboards, and notebooks—combining logs with metrics, traces, and events in contextual analysis workflows.
- AI-assisted diagnostics: Leverages Davis AI to detect unusual behavior across logs and automatically surface likely root causes, reducing manual investigation time.
- Fine-grained cost controls: You can configure log buckets to apply different retention and query models per workload—enabling predictable costs for hot data alongside affordable archival strategies.
Pros
- Context-aware logs and rich environment enrichment
- Retention is based on short-term log analysis or long-term log storage
- AI features reduce noise and accelerate problem diagnosis
- Integrates with metrics, events, and traces (via Grail)
Cons
- Pricing involves multiple tiers and can be tough to predict for heavy log use
- Can become costly at scale, especially with long retention and frequent queries
- Requires effort to understand DQL and configure cost-efficient buckets
Tech Fit
Dynatrace is well-suited for large organizations running Kubernetes, hybrid cloud, and microservice environments that need rich insights across infrastructure, applications, logs, and security. Teams with mature DevOps or SRE practices will benefit from its AI-assisted analysis and unified telemetry context—but these benefits come with a higher cost and planning complexity.
Pricing at Scale
Dynatrace log costs break down into three dimensions—ingestion, retention, and querying:
- Full stack: $0.01/8 GiB hour/month or $58/month/8GiB host
- Ingest & process: $0.20 per GiB
- Retention: $0.02 per GiB/day (free querying for up to 35 days)
- Querying (usage-based): $0.0035 per GiB scanned—only charged outside the included retention days
For a similar 45 TB volume, the cost would be $21,850/month.
5. SigNoz
Overview
The open-source observability platform, SigNoz, offers observability for logs, metrics, and traces. Built on OpenTelemetry, it can be self-hosted or run via the managed cloud offering, giving teams full control or effortless setup depending on their needs.
Key Advantage
SigNoz stands out for being simple to understand and flexible to deploy—and its pricing is delightfully predictable. You never pay per user, per host, or per custom metric. Instead, you pay only for the data you actually send, making it especially attractive for cost-conscious teams and growing startups.
Key Features
- Clean, usage-based pricing: No surprise seat fees or container taxes. You just pay for log data sent—$0.30 per GB—so it’s easy to estimate and control your cost from day one.
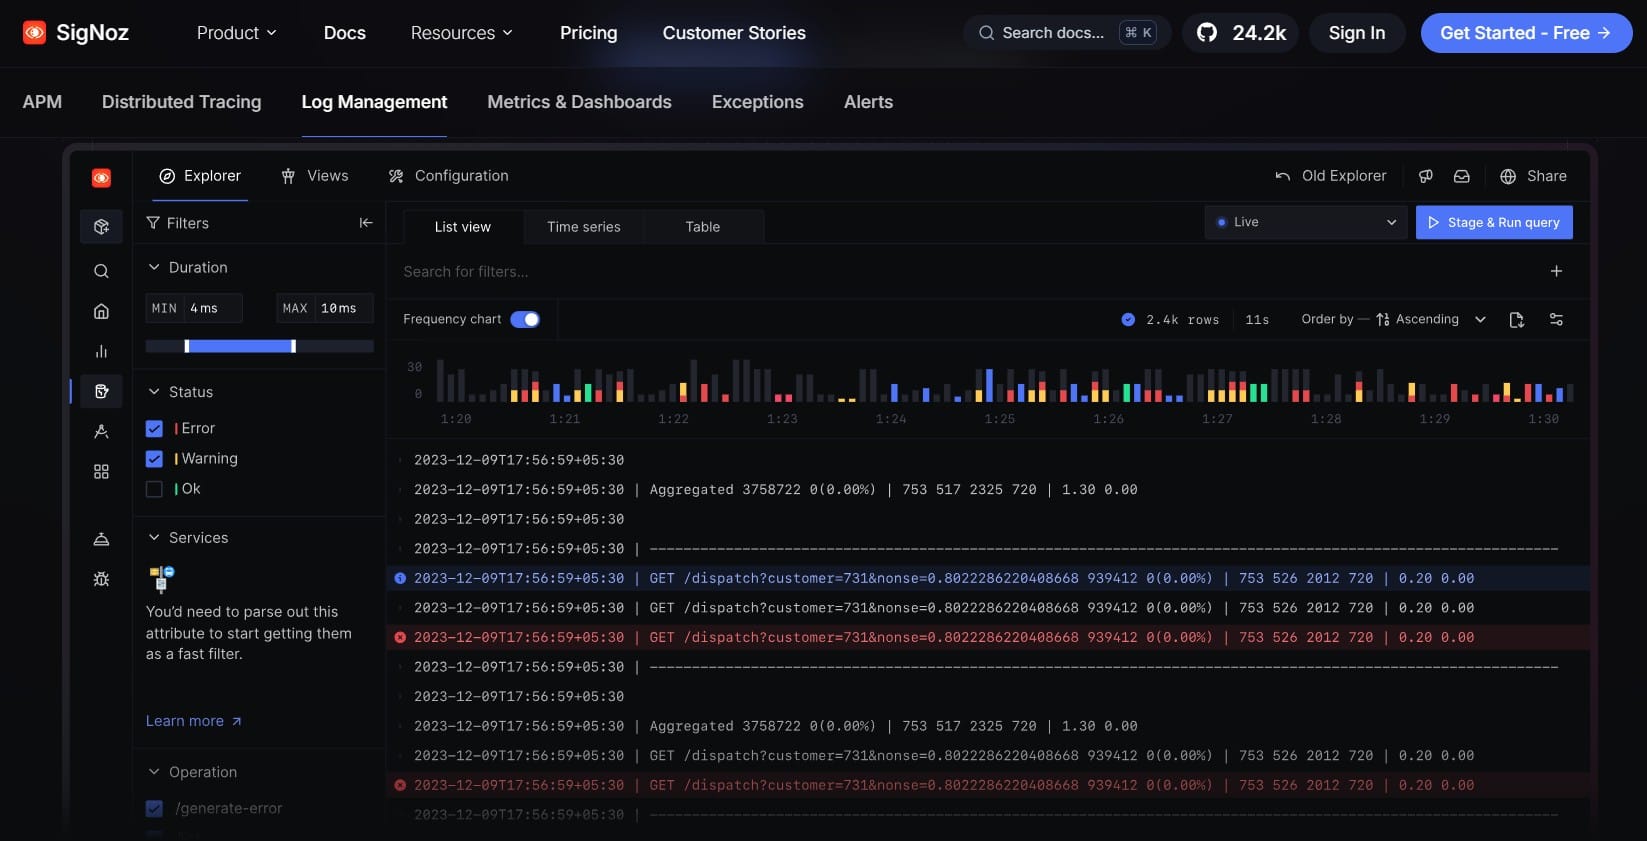
- Unified view of MELT: With logs, metrics, and traces in one place, SigNoz lets you trace a slow request to a backend function, then zoom directly into the logs that pinpoint the issue—without switching tools.
- OpenTelemetry-native: Built with OTEL at its core, SigNoz plugs effortlessly into your existing instrumentation setup—no proprietary agents needed.
- Live tail and saved views: You can watch logs as they come in (live tail), set up saved searches, and drop those views into dashboards and alerts—simple yet powerful.
- Retention flexibility: You choose how long to keep your data—throwaway short-term logs or deeper historical archives—and your bill scales only with what you keep.
Pros
- Pricing is transparent, with no hidden fees
- Covers all three – logs, metrics, and traces
- Smooth integration wth OpenTelemetry support
- Flexibility with self-host or cloud
Cons
- Managed cloud begins at around $49/month, which may be higher for very small teams
- Self-hosting requires in-house expertise and infrastructure
Tech Fit
SigNoz works well for teams that value transparency and control. If you’re already using OTEL, it slots right in. When you’re comfortable managing your own infrastructure and want predictable pricing, SigNoz is a great fit. For cloud-native apps, microservices, or teams wrestling with budget uncertainties on other platforms—it delivers observability without surprises.
Pricing at Scale
SigNoz charges a flat $0.30 per GB ingested. Using our 45 TB, scenario, the cost could be $16,000/month.
6. Graylog
Overview
Graylog is a flexible log management and analytics platform available both as a free, open-source version (Graylog Open) and a feature-rich Enterprise edition. It offers tools for capturing, parsing, enriching, and searching log data in real-time. Deploy it on-premises, in the cloud, or in hybrid setups, and you’ll find a system designed for teams needing both visibility and control—without unnecessary costs or complexity.
Key Advantage
Graylog’s standout quality lies in its consumption-based pricing model. You’re billed only for the data you actively store and analyze—not what you ingest. This makes pricing far more in sync with actual usage instead of static capacity guesses, offering both flexibility and budget predictability.
Key Features
Graylog delivers a smooth experience designed to keep your logs meaningful and accessible:
- Pay for what matters: Logs are routed smartly—high-priority data stays in analytics, while the rest moves to a low-cost data lake with quick retrieval when needed. This means lower bills and better control.
- Built-in pipeline tools: You can route, enrich, filter, and prioritize logs before storing them. That helps reduce noise and ensures only relevant data is queried.
- Guided onboarding and dashboards: Especially with the Enterprise edition, dashboards and parsing rules are pre-built. New users can get started quickly without needing deep expertise.
- Seamless retrieval from standby storage: Historical logs aren’t deleted—you can selectively restore just the data you need for retrospective investigations.
- Consistent experience across environments: Whether you’re self-hosting on-prem, running Graylog on AWS, or using Graylog Cloud, the feature set remains the same.
Pros
- Transparent, usage-based billing that adapts to how much data you actually analyze
- Tools to enrich, route, and archive logs efficiently
- Fast onboarding and built-in dashboarding for quicker insights
- Flexible deployment model
Cons
- Enterprise edition starts at around $15,000/year, which might be steep for modest setups
- Self-hosting still requires operational effort in terms of infrastructure and tuning
Tech Fit
Graylog suits teams comfortable running and managing infrastructure, or organizations that require full control over log data. With strong pipeline capabilities and flexible deployment options, it’s a solid choice for DevOps, SecOps, and compliance-focused teams. For those seeking predictable cost and flexible control over how logs are handled, Graylog delivers exactly that—without locking you into rigid pricing or architecture.
Pricing at Scale
Graylog’s Enterprise pricing starts from around $15,000 per year, covering log management, data lake capabilities, and analytics tools.
- Annual cost: $15,000/year, which breaks down to approximately $1,250/month
- No extra charges for ingestion, indexing, or retention—everything’s included under that umbrella
- You retain all logs and only pay based on what you analyze, keeping costs steady even in spikes
7. Splunk AppDynamics
new relic alternatives
Overview
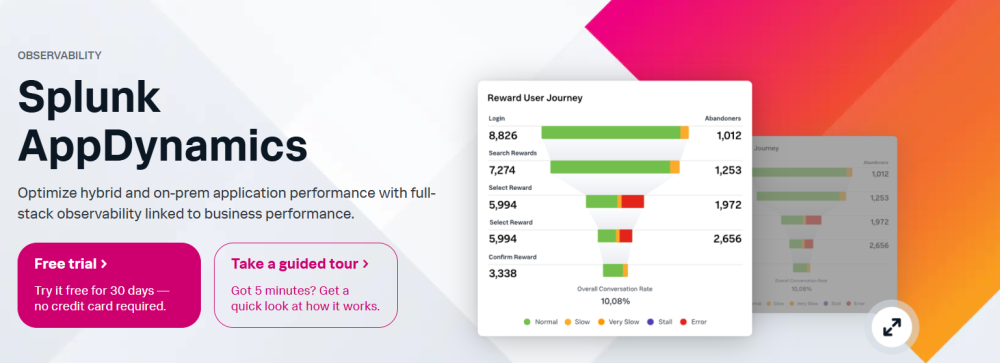
Splunk AppDynamics provides full-stack visibility into application performance, designed to bridge your code’s behavior with real business outcomes. It spans infrastructure, application, database, and user experience monitoring—all enriched with AI and analytics, making it easier to spot performance issues and pinpoint the root cause—whether you’re running in the cloud or on-premises.
Key Advantage
AppDynamics stands out for linking technical performance back to business impact. It detects slowdowns or failures, links them to specific infrastructure, code, or user actions, and shows how that affects revenue or conversions. It’s built for teams that need deep observability but also want to prioritize what truly matters to the business.
Key Features
- End-to-end APM coverage: From infrastructure to application code and databases, AppDynamics gives you visibility across each layer with rich context.
- Business performance correlation: You can map IT issues directly to business metrics like conversion rates or revenue trends—no guessing needed.
- Built-in security observability: AppDynamics monitors runtime behavior to detect anomalies or threats inside your apps, helping you reduce risk.
- SAP and legacy system support: If you’re running SAP or legacy technology, AppDynamics includes tailored dashboards (e.g., Order-to-Cash, Procure-to-Pay) out of the box.
- Comprehensive user experience monitoring: From digital experience to real-user and synthetic monitoring, it offers broad coverage of how customers interact with your systems.
Pros
- Strong APM that connects performance to business metrics
- Excellent support for hybrid, on-prem, and SAP systems
- Embedded security and user experience tools
- Fast troubleshooting through context-rich insights
Cons
- Slower updates cycle
- Alert issues
Tech Fit
AppDynamics is ideal for teams running hybrid or on-prem environments—especially those using SAP or legacy systems—who need deep observability tied to business outcomes. It’s a match for organizations that want rich runtime insights, user experience tracking, and security all wrapped into one solution. However, smaller teams or cost-sensitive startups may find its pricing rigid.
Pricing at Scale
AppDynamics pricing is based on CPU cores (vCPUs). The essential “Infrastructure Edition” starts at $6 per vCPU per month, while the “Premium Edition,” which includes log analytics along with app and DB monitoring, begins at $33 per vCPU per month.
For a mid-size organization ingesting 45 TB data, the cost could be: $8,625/month.
8. Sumo Logic
Overview
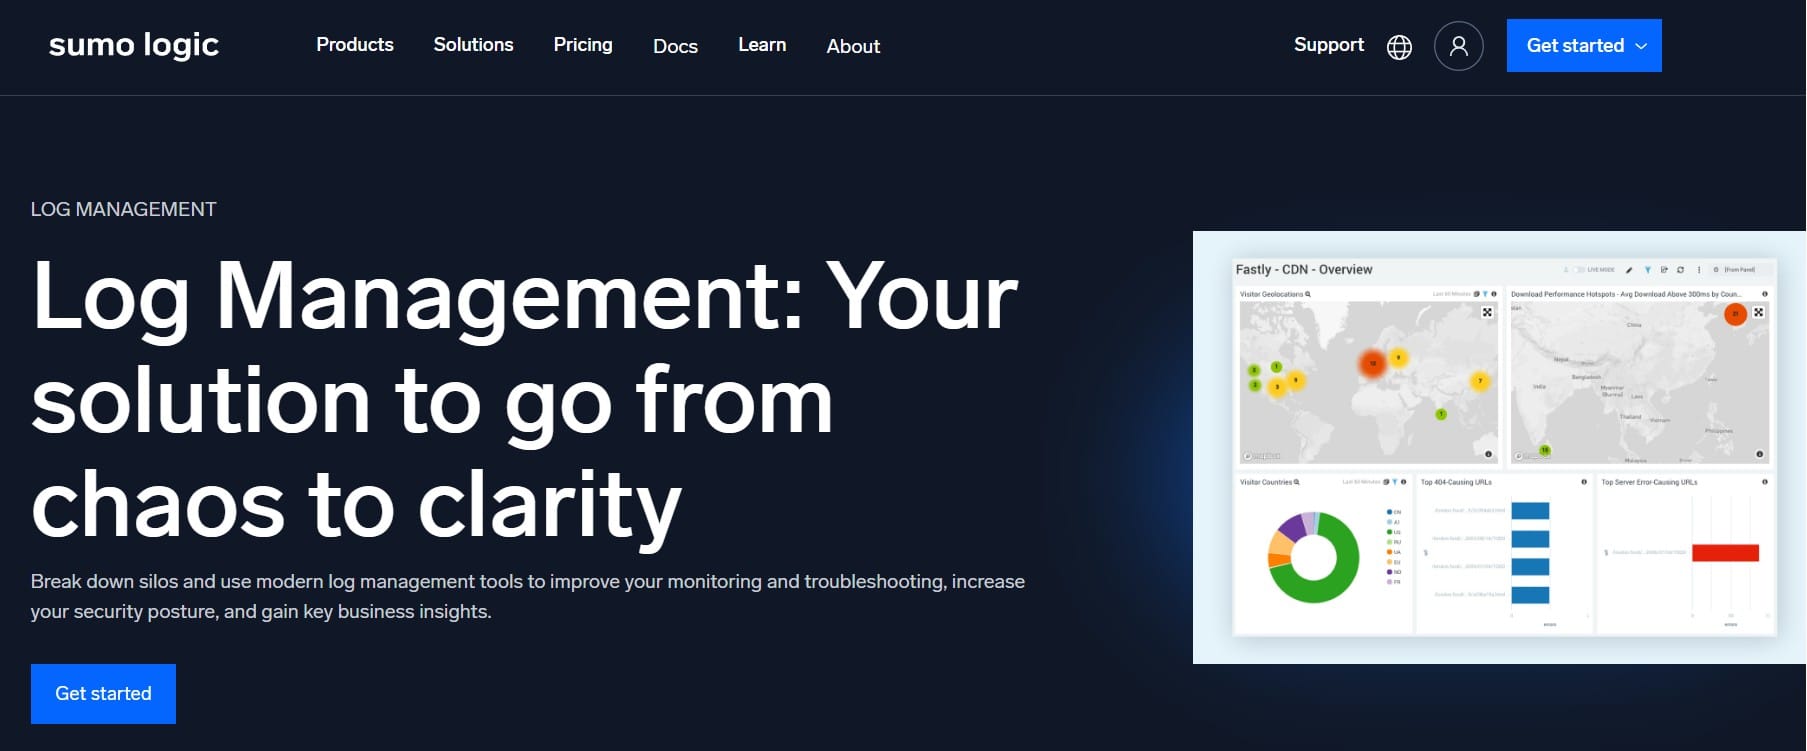
Sumo Logic is a cloud-native platform for log management and analytics with strong capabilities in troubleshooting, security analytics, and compliance. It’s popular with teams that want fast onboarding, 450+ integrations, and tooling that scales from basic monitoring to SIEM without having to rewire pipelines. Flex Pricing is the headline idea: bring in all your data at $0 ingest and pay for the analytics you run.
Key Advantage
Flex Pricing flips the usual ingest-based model on its head. You don’t budget for how much log data you ship—ingest is free—then you set scan budgets and pay for what you actually analyze, plus a small storage/retention component you control per source. This helps teams avoid painful trade-offs like deleting logs to stay under a cap.
Key Features
- $0 ingest with scan budgets: Bring in everything, then cap analysis with scan budgets so queries don’t blow past your target spend. Scans are counted when searches, dashboards, or monitors traverse stored data.
- Credit-based pricing: You buy Cloud Flex Credits that are consumed by storage and analytics (for example, storing logs, running searches, or scanning dashboards).
- Retention you configure: Keep data for as long as you need; storage consumes a nominal amount of credits and is set per data source so cold vs hot history is your call.
- Tools for cost control: Scan budgets and usage dashboards make it clear how much data you’re scanning, so you can right-size search behavior without guessing.
- Broad observability footprint: App, infrastructure, Kubernetes, cloud services, and security use cases are all supported, so logs sit next to metrics, traces, and SIEM if you need them.
Pros
- $0 ingest removes hard choices about what to collect
- Scan budgets make analytics spend predictable
- Retention is configurable per source
- Strong integration catalog and security content
Cons
- UI issues
- Learning curve
Tech Fit
Sumo Logic suits teams that want to centralize log intake without worrying about ingest caps, then keep tight control over the analysis layer. If your engineers run frequent searches across broad time ranges, you’ll need to set scan budgets carefully. It’s a solid fit for cloud-first stacks, Kubernetes estates, and organizations that may grow into SIEM while keeping one pane of glass.
Pricing at Scale
Sumo’s Flex model has three main parts for logs: ingest ($0), storage/retention (credits per GB stored over time), and analytics scans (credits per GB scanned).
Using the same mid-sized scenario—45 TB/month, the cost could be roughly $16,045/month.
Best Log Management Tools by Use Case & Technology
Startups & SMBs
- CubeAPM: Offers cost-effective log monitoring with smart sampling, predictable $0.15/GB pricing, and optional self-hosting. Perfect for growing teams that need observability without surprise bills.
- SigNoz: An open-source, OTEL-native tool that gives smaller companies full control over data and deployment. Great for startups wanting transparency and avoiding vendor lock-in.
- New Relic: With its free 100 GB/month plan and intuitive dashboards, it’s ideal for small teams looking to quickly set up log monitoring alongside APM and frontend observability.
Large Enterprises
- CubeAPM: Offers a self-hosting option to help large businesses stay compliant with data localization rules.
- Dynatrace: Provides AI-driven anomaly detection, automated root cause analysis, and rich log context, making it a strong choice for enterprises managing multi-cloud and hybrid systems.
- Datadog: Covers everything from logs to security in a single platform with 600+ integrations. Large enterprises value it for its breadth, even if costs run high at scale.
- Splunk AppDynamics: Excels at tying application performance back to business outcomes, with deep visibility into infrastructure, apps, and SAP systems, making it enterprise-ready.
Kubernetes-Heavy Environments
- CubeAPM: Built with OTEL from the ground up, CubeAPM gives rich log, trace, and metric correlation for dynamic Kubernetes environments at a fraction of the cost.
- Datadog: Auto-discovers containers, monitors pods, and integrates tightly with Kubernetes, giving SRE teams real-time insights into clusters.
- Sumo Logic: Cloud-native architecture with $0 ingest pricing makes it easy to handle logs from fast-scaling containerized workloads.
Serverless-First Apps
- CubeAPM: Provides function-level tracing and log correlation that works seamlessly with AWS Lambda and other serverless services, ensuring performance bottlenecks are easy to catch.
- New Relic: Strong support for serverless environments, allowing logs from functions to be connected directly with traces and metrics for end-to-end visibility.
Java Applications
- CubeAPM: Offers strong Java support with OpenTelemetry auto-instrumentation, JVM metrics, and trace-to-log correlation.
- New Relic: Offers deep JVM instrumentation, profiling, and log correlation, making it highly effective for enterprise-scale Java apps.
- Dynatrace: Automates the discovery of Java components and applies AI analysis to logs and metrics, speeding up issue detection in large Java deployments.
- Splunk AppDynamics: Known for its strong SAP and legacy Java monitoring, it ties application logs directly to performance KPIs and business outcomes.
Node.js Applications
- CubeAPM: With OTEL-native support, CubeAPM tracks asynchronous traces, logs, and metrics across Node.js microservices, ensuring visibility in complex apps.
- Sumo Logic: Provides quick integration for modern JavaScript stacks, ideal for SaaS platforms and Node-heavy services.
- New Relic: Connects frontend and backend logs with performance traces, giving a holistic view of Node.js app health.
SaaS Products
- CubeAPM: Transparent pricing and efficient log sampling make it perfect for SaaS companies scaling quickly without wanting runaway observability costs.
- SigNoz: Works well for SaaS teams who want a self-hosted OTEL-first stack, keeping costs under control while ensuring full visibility.
- New Relic: Its easy onboarding and managed cloud service help SaaS teams quickly integrate observability into their platforms.
On-Prem Compliance
- Graylog: Suited for regulated industries like finance and healthcare, with strong on-prem deployments and customizable retention.
- SigNoz: Offers full self-hosting and retention controls, ensuring data never leaves your environment.
- CubeAPM: Supports on-prem deployments with cost transparency, making it a great fit for industries with strict compliance requirements.
How to Choose the Right Log Management Tool
Selecting a log management solution isn’t about picking the one with the longest feature list—it’s about finding the tool that fits your scale, budget, and workflows. Here are the key factors to weigh before making a decision:
1. Data Volume and Cost Model
Log volumes grow quickly as systems scale. Some tools charge per GB ingested, others per GB scanned, and some bundle indexing and retention separately. If your team generates terabytes of logs every month, flat and predictable pricing (like CubeAPM’s $0.15/GB) may be more sustainable than layered fee structures that spike unpredictably.
2. Integration and Ecosystem
Check whether it integrates easily with your stack—cloud providers, Kubernetes, CI/CD pipelines, and databases. Tools like Datadog and New Relic have broad ecosystems, while open-source tools like SigNoz and Graylog offer flexibility but may require more setup.
3. OpenTelemetry and Standards Support
OTEL-native tools ensure you’re not locked into a vendor. OpenTelemetry gives you portability across platforms and makes your observability setup future-proof. If you’re already instrumenting with OTEL, choosing a platform like CubeAPM or SigNoz will save significant integration work.
4. Retention and Compliance
Every industry has different retention needs. SaaS teams may only need 7–30 days of logs, while healthcare or finance may require months or even years for compliance. Tools like Graylog and CubeAPM allow full on-prem retention, while cloud-first tools like Sumo Logic or Datadog may add extra charges for longer storage.
5. Ease of Use vs. Depth of Features
Some tools are designed to be simple and quick to adopt, while others are packed with advanced features but require more learning. New Relic, for example, is easy for smaller teams to get started with, whereas Splunk AppDynamics is powerful but better suited for enterprises with larger teams to manage complexity.
6. AI and Automation
Modern observability isn’t just about collecting logs—it’s about cutting through the noise. Dynatrace and Datadog apply AI to surface anomalies and probable root causes. If your team is small and can’t afford to chase false alarms, AI-powered platforms may reduce alert fatigue and save valuable time.
7. Deployment Flexibility
Ask yourself: Do you need a managed SaaS tool, or is self-hosting essential for compliance and data control? Cloud-based services like Sumo Logic and Datadog reduce ops overhead, but self-hosted platforms like Graylog and SigNoz give you more control. CubeAPM offers both options, making it adaptable to your infrastructure needs.
Conclusion
Log management has evolved from being a back-office utility into a core part of modern observability. With teams generating terabytes of logs each month, the choice of tool now affects not only performance and security but also long-term costs. From enterprise-heavy platforms like Dynatrace, Datadog, and Splunk AppDynamics to open-source options like SigNoz and Graylog, every tool brings strengths—and trade-offs.
For teams that want predictable pricing, OpenTelemetry-native support, and the flexibility to deploy on-prem or in the cloud, CubeAPM clearly stands out. Its $0.15/GB pricing, smart sampling, and MELT integration make it the most cost-effective option for high-volume logging without losing context or insights.
Book a free demo to explore CubeAPM.
Disclaimer: The information in this article reflects the latest details available at the time of publication and may change as technologies and products evolve.
FAQs
1. What is the most cost-effective log management tool?
CubeAPM is the most cost-effective option for teams with large log volumes. With flat $0.15/GB pricing, it avoids the layered fees of Datadog, New Relic, or Sumo Logic, which can climb to 3–6× higher for the same workload.
2. Which tool is best for enterprises with complex infrastructures?
Dynatrace and Datadog are strong for large enterprises due to their automation, AI features, and vast integrations. But for enterprises focused on cost predictability and compliance, CubeAPM provides a more budget-friendly alternative.
3. Are there open-source log management solutions?
Yes, SigNoz and Graylog are the most popular open-source platforms. They’re OTEL-friendly and self-hostable, but they require more operational effort compared to managed services.
4. Which log management tool works best for Kubernetes and serverless apps?
Datadog and CubeAPM both integrate deeply with Kubernetes and serverless environments. CubeAPM, in particular, offers function-level tracing and log correlation at a fraction of the cost.
5. Can I host a log management tool on-prem for compliance?
Yes, tools like CubeAPM, SigNoz, and Graylog can be self-hosted or deployed on-prem to meet strict compliance requirements. This makes them suitable for industries like finance, healthcare, and government.


