Uptrace has carved a niche in the APM ecosystem by offering lightweight tracing, Prometheus integration, and native OpenTelemetry support — all with a minimal footprint. However, as teams expand their environments, Uptrace’s limited real-user and front-end monitoring, along with growing maintenance overhead, are prompting many to explore more robust alternatives.
CubeAPM stands out as the most powerful alternative to Uptrace. With a pricing model starting at $0.15/GB and zero per-user fees, it offers unmatched cost-efficiency. It delivers full-stack observability, real-time distributed tracing, and smart sampling, while also supporting on-prem deployments to meet compliance requirements.
In this article, we break down the top 7 alternatives to Uptrace in 2025, comparing tools based on observability coverage, deployment flexibility, cost transparency, OpenTelemetry compatibility, and more.
Top 7 Uptrace Alternatives
- CubeAPM
- Datadog
- Dynatrace
- Splunk AppDynamics
- New Relic
- Better Stack
- Coralogix
- Sumo Logic
APM Tools Comparison: Uptrace vs CubeAPM vs Others (2025)
| Tool | *Pricing(Small, Mid, Large) | OTEL Native | Support TAT | Deployment Option |
| CubeAPM | Small: $2,080 Mid: $7,200 Large: $15,200 | Yes | Within minutes | Self-hosted |
| Uptrace | Small: $1,695 Mid: $5,600 Large: $12,500 | Yes | Not available | SaaS and Self-hosted |
| Datadog | Small: $8,185 Mid: $27,475 Large: $59,050 | *No | <2hrs-48hrs | SaaS only |
| Dynatrace | Small: $7,740 Mid: $21,850 Large: $46,000 | *No | 4hrs to days | SaaS and Self-hosted |
| Sumo Logic | Small: $4,641 Mid: $16,065 Large: $33,915 | *No | 1hr to 1day | SaaS only |
| New Relic | Small: $7,896 Mid: $25,990 Large: $57,970 | *No | 2hrs to days | SaaS only |
| Coralogix | Small: $4,090 Mid: $13,200 Large: $29,000 | Yes | Within minutes | SaaS only |
| Splunk AppDynamics | Small: $2,650 Mid: $9,825 Large: $20,150 | *No | 2hrs to days | SaaS and Self-hosted |
| Better Stack | Small: $5,723 Mid: $20,550 Large: $43,350 | *No | Within hours | SaaS only |
*All pricing comparisons are calculated using standardized Small/Medium/Large team profiles defined in our internal benchmarking sheet, based on fixed log, metrics, trace, and retention assumptions. Actual pricing may vary by usage, region, and plan structure. Please confirm current pricing with each vendor.
*OTEL Sources: Datadog uses proprietary SDKs; Dynatrace uses collectors; Splunk AppDynamics uses collectors; Sumo Logic uses collectors, Better Stack uses collectors.
Why Look for Uptrace Alternatives?
While Uptrace is a capable OpenTelemetry-native observability tool, it remains limited in several key areas that matter once teams scale into production or operate across multiple services and environments:
1. Gaps in Full-Stack Observability
Although Uptrace technically supports the MELT stack via OTEL, it does not natively provide essential components like Real User Monitoring (RUM) or synthetic monitoring. This means there’s no built-in visibility into frontend performance or the ability to simulate and test user journeys proactively. Teams must stitch together third-party tools to achieve full coverage — adding cost, complexity, and integration risk.
2. Operational Overhead at Scale
Running Uptrace in production means managing your own observability infrastructure — including ClickHouse, OTEL Collectors, storage retention, alerting configs, and visualization. This approach may be suitable for small environments, but it becomes a significant maintenance burden in fast-growing teams. There’s no automation for scaling storage or HA, and tuning performance is entirely manual.
3. Limited Ecosystem Integrations
Uptrace has a limited integration ecosystem, which is a major disadvantage for teams running distributed systems in a diverse environment.
Criteria for Suggesting Uptrace Alternatives
To identify the best Uptrace replacements, we evaluated each tool based on a mix of operational, technical, and business-critical factors, including:
Here are the key criteria we used to select better-suited Uptrace alternatives:
1. Full-Stack Observability
Modern teams need end-to-end visibility — from backend traces to frontend performance. We focused on tools that offer comprehensive MELT support (Metrics, Events, Logs, Traces) along with real-user monitoring (RUM) and synthetic monitoring. Uptrace lacks these frontend observability features, creating visibility gaps across the user journey.
2. Ease of Use & Operational Simplicity
Tools with a lightweight setup, clean UI, and fast onboarding process received higher preference. CubeAPM can be deployed and configured within an hour, compared to the steep learning curves of some enterprise solutions.
3. OpenTelemetry (OTEL) Support
When suggesting alternatives, we prioritized platforms that offer richer auto-instrumentation, multi-signal OTLP ingestion, advanced semantic-convention mapping, and support for multiple agents or collectors beyond standard OTel. Strong OTel support reduces vendor lock-in and improves data portability.
4. Enterprise Support & Incident Readiness
We assessed tools based on support SLAs, response channels (e.g., Slack, ticketing), and onboarding resources. Tools like CubeAPM offer Slack-based support with sub-5-minute response times, giving teams peace of mind during critical incidents. Uptrace’s support is largely community-driven and may not meet the needs of large production teams.
5. Advanced Analytics & Troubleshooting Features
We prioritized alternatives that offer richer analytics, faster debugging workflows, and deeper behavioral insights for complex microservice environments.
1. Uptrace Overview

Known For
OpenTelemetry-native distributed tracing and metrics collection. Uptrace is an observability platform built around OpenTelemetry and ClickHouse. It’s popular among small teams looking for cost-effective, vendor-neutral tracing infrastructure.
Standout Features
- Native OpenTelemetry support: Seamless OTEL ingestion without custom agents or wrappers.
- ClickHouse backend: Offers high-speed analytics on trace data using SQL.
- Basic metrics integration: Prometheus-compatible metrics ingestion.
- Minimal UI/UX: Lightweight, fast-loading interface for basic diagnostics.
Key Features
- Distributed tracing using OpenTelemetry across services.
- Self-hosted deployment with support for Docker collector Setups.
- Prometheus integration for system and service-level metrics.
- SQL-based trace queries using ClickHouse for advanced users.
- Basic dashboards and alerting for trace anomalies.
Pros
- Fully OpenTelemetry-native; no vendor lock-in.
- Cost-effective for small-scale deployments (free community version).
- Supports custom deployments and runs entirely within your infrastructure.
- Easy integration with Prometheus metrics.
Cons
- Some advanced features require setup efforts, especially when self-hosted
- Operational overhead, especially when self-hosted
- High operational overhead to manage ClickHouse, OTEL Collector, and configs.
Best For
- Small teams or startups with strong DevOps expertise.
- Teams are comfortable managing self-hosted observability stacks.
- Environments prioritizing trace-based debugging over full MELT coverage.
Pricing & Customer Reviews
- Traces and Logs: starts at $0.08 per GB
- Metrics: starts at $0.001 per series
- ProductHunt Rating: 4.8/5
Top 8 Uptrace Alternatives
1. CubeAPM

Known For
Full-stack OpenTelemetry-native observability with cost-efficiency and smart sampling.
CubeAPM is an enterprise-grade observability platform that delivers full MELT coverage (Metrics, Events, Logs, Traces) with blazing-fast ingestion, compliance-friendly self-hosting, and 60–80% lower TCO compared to legacy APM tools.
Key Features
- Smart Sampling: Context-aware sampling dynamically retains high-value data (e.g., latency spikes, 5xx errors) while filtering noise. This reduces ingestion volume and cost without losing important traces.
- Real-Time Tracing & Metrics: End-to-end distributed tracing combined with metrics from infra and apps.
- Infrastructure Monitoring: Built-in support for AWS, Kubernetes, and Linux-based infra metrics.
- Synthetic Monitoring & RUM: Simulate user flows and monitor real-world frontend performance.
Standout Features
- Smart sampling enables a high signal-to-noise ratio and efficient storage.
- On-prem hosting that complies with data residency laws and avoids public cloud egress fees.
- Unlimited user seats with flat usage-based pricing—no per-user charges like New Relic or Datadog.
- Instant migration support from Datadog, New Relic, or Uptrace in under an hour.
- High-resolution dashboards with customizable MELT views and anomaly alerting.
Pros
- Up to 80% lower cost compared to Datadog, New Relic, and others.
- Smart sampling enables a high signal-to-noise ratio and efficient storage.
- Full MELT coverage, including logs, metrics, RUM, synthetics, and error tracking.
- Slack/WhatsApp support from core engineers with response times in minutes.
- Designed for self-hosted observability at scale.
Cons
- Not suited for teams looking for off-prem solutions
- Strictly an observability platform and does not support cloud security management
Best For
- Engineering orgs seeking lower cost and control over telemetry
- Startups and mid-sized teams are scaling fast, but watching budgets
Pricing & Customer Reviews
- Pricing: Ingestion-based pricing of $0.15/GB
- Rating: 4.7/5 (based on pilot programs, Slack feedback, and demos)
CubeAPM vs Uptrace
While Uptrace focuses on tracing, logs, and metrics, CubeAPM offers full-stack observability, including logs, infra, synthetics, and RUM. It also delivers smart sampling, which Uptrace lacks. CubeAPM is the go-to choice for teams scaling past Uptrace’s capabilities without inflating costs.
2. Datadog
Known For
Cloud-native full-stack observability platform with deep integrations across the DevOps ecosystem. Datadog is one of the most widely used SaaS-based observability platforms, offering infrastructure monitoring, APM, log analytics, and security monitoring — all from a single control plane.
Key Features
- Infrastructure Monitoring: Agent-based host and container metrics with built-in dashboards.
- Application Performance Monitoring (APM): Distributed tracing across services, databases, and APIs.
- Log Management: Centralized log aggregation with Live Tail and search capabilities.
- Security Monitoring: Detect vulnerabilities and compliance violations in real time.
- Synthetic Monitoring & RUM: Test user journeys and monitor real frontend performance.
- Custom Dashboards and Alerting: Rich visualization engine with threshold, anomaly, and composite alerts.
Standout Features
- 900+ integrations with tools like AWS, Kubernetes, Jenkins, and GitHub.
- Watchdog AI engine automatically surfaces anomalies and trends.
- Unified platform for logs, infra, APM, RUM, and cloud security — in one pane.
- High scalability for large multi-region deployments with real-time metrics.
Pros
- Feature-rich and mature across all observability domains.
- Excellent support for multi-cloud and containerized environments.
- Intuitive dashboards, AI-powered alerts, and great documentation.
- Smooth integration into modern CI/CD workflows.
Cons
- Expensive at scale — pricing is fragmented across ingestion, hosts, events, and feature tiers.
- Opaque billing — many users complain about surprise bills and unpredictable costs.
- Steep learning curve
- Overwhelming UI, especially for beginners
Best For
- Enterprises that need a one-stop shop for DevOps observability, especially in cloud-native ecosystems.
- Teams with large budgets prioritize out-of-the-box integrations and dashboards.
Pricing & Customer Reviews:
- APM Pro: starts at $35/host/month;
- Logs: $0.1/GB ingested
- Infrastructure Pro: starting at $15/host/month
- G2 Review Rating: 4.4/5
While users praise Datadog’s deep feature set and integrations, common complaints center around pricing complexity, overages, and a steep learning curve.
Datadog vs Uptrace
Datadog offers far more features than Uptrace (e.g., security monitoring, synthetics, logs, and RUM), but comes at a steep cost with complex billing. Uptrace may be better for early-stage startups, but Datadog is a clear upgrade — if budget is not a constraint. However, teams seeking cost-efficient, OpenTelemetry-native observability often choose tools like CubeAPM over both.
3. Dynatrace
Known For
AI-driven full-stack observability and automation for enterprise-scale environments.
Dynatrace is a premium observability platform known for its powerful AI engine (Davis), auto-discovery, and deep code-level diagnostics — making it popular with large enterprises running complex hybrid cloud infrastructure.
Key Features
- Davis AI Engine: Dynatrace’s AI-powered engine auto-correlates metrics, traces, and logs to detect and predict anomalies.
- Full-Stack Monitoring: Unified visibility from infrastructure to user experience (including synthetics, RUM, and logs).
- Automatic Dependency Mapping: Auto-discovers services, APIs, databases, and their dependencies.
- Log Management & Indexing: Context-rich log ingestion with dynamic log sampling and indexing.
- Cloud-Native Support: First-class support for Kubernetes, serverless, and multicloud environments.
- Code-Level Tracing & Insights: Drill into execution paths and bottlenecks with JVM, .NET, Node.js, and more.
Standout Features
- No manual configuration — everything auto-instrumented and auto-discovered.
- AI-powered root cause analysis that reduces mean time to resolution (MTTR).
- Business KPI monitoring integrated into observability flows.
- Application Security Module for vulnerability detection.
Pros
- Enterprise-grade scalability with strong automation.
- Exceptionally detailed tracing and performance diagnostics.
- Real-time anomaly detection without heavy tuning.
- Seamless hybrid cloud support with distributed tracing.
Cons
- High pricing and opaque billing for AI, logs, and cloud modules.
- Expensive, making it challenging for smaller teams
- Complex configuration adds operational overhead
- Overwhelming UI, which might hinder smooth usability
Best For
- Large enterprises and Fortune 500s needing automated observability at scale.
- Teams looking for predictive diagnostics, not just monitoring.
Pricing & Customer Reviews
- Infrastructure Monitoring: $29/month per host
- Full-Stack Monitoring: $58/month per 8 GiB host
- G2 Review Rating: 4.4/5
Users love its automation and Davis AI engine but flag pricing opacity, steep learning curve, and rigid agent-based instrumentation as downsides.
Dynatrace vs Uptrace
Dynatrace delivers far deeper observability than Uptrace — with automated service maps, predictive AI, and security coverage. However, it’s not OpenTelemetry-native, and its high pricing makes it inaccessible for smaller teams. Uptrace is more lightweight but lacks the intelligence and enterprise capabilities that define Dynatrace. For OpenTelemetry-first teams, CubeAPM offers a powerful, lower-cost middle ground.
4. Splunk AppDynamics
Known For
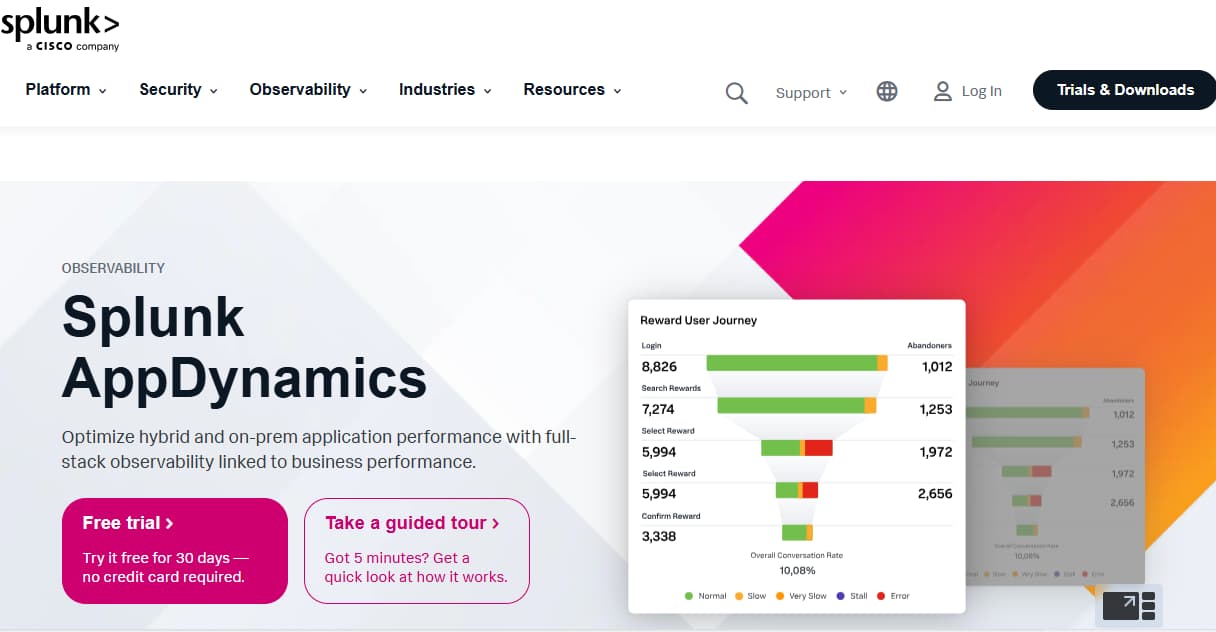
Enterprise-grade APM with deep application diagnostics and business transaction monitoring. Originally developed by Cisco (AppDynamics) and now integrated into Splunk’s observability suite, Splunk AppDynamics is geared toward large organizations needing detailed performance analysis tied to business KPIs.
Key Features
- Business Transaction Monitoring: Tracks end-to-end flow of transactions across services and infrastructure.
- Application Performance Management (APM): Offers deep performance metrics and root-cause diagnostics for application components.
- Infrastructure Visibility: Correlates application behavior with underlying server, container, and cloud performance.
- Custom Dashboards & Health Rules: Alerts based on business outcomes, user experience, and performance SLAs.
- Synthetic Monitoring: Simulates user interactions to detect performance bottlenecks proactively.
- Code-level Diagnostics: Visual code traces and method-level insights for Java, .NET, PHP, and Node.js.
Standout Features
- Tight application-to-business mapping helps IT and business leaders align on performance goals.
- Tag-based Smart Alerting and SLA tracking are built into the UI.
- Deep diagnostics of monolith and legacy architectures.
- Recently enhanced by Splunk’s observability stack for extended log and infra visibility.
Pros
- Ideal for transaction-heavy applications like e-commerce or finance platforms.
- Highly detailed performance breakdowns at method, class, and tier level.
- Business-centric alerting with SLA and KPI correlation.
- Part of a larger Splunk ecosystem with advanced logging and SIEM.
Cons
- Complex setup and configuration — especially for custom instrumentation.
- High cost for teams looking to scale
- UI feels less intuitive, impeding usability
Best For
- Large-scale enterprises with Java/.NET apps needing business-centric APM.
- Teams already using Splunk for logs or SIEM and want a consolidated ecosystem.
Pricing & Customer Reviews
- AppDynamics APM: starts at $33/month/CPU core
- Infra Monitoring: starts at $6/month/CPU core
- G2 Review Rating: 4.3/5
Splunk AppDynamics vs Uptrace
While AppDynamics provides much deeper application diagnostics and business KPIs than Uptrace, it does so at high cost, high licensing fees, and setup complexity. Uptrace is simpler and open-source, but not enterprise-grade. CubeAPM stands out as the OTEL-native, business-aware alternative with self-hosting, advanced dashboards, and no per-user fees.
5. New Relic
Known For
A usage-based, full-stack observability platform that covers everything from APM and infrastructure monitoring to logs, RUM, synthetics, and mobile telemetry. New Relic is recognized for its unified Telemetry Data Platform (TDP) and dashboarding powered by its query language, NRQL.
Key Features
- Full MELT Observability: Offers integrated support for metrics, events, logs, traces, RUM, synthetics, and error tracking—all accessible from a single UI.
- Telemetry Data Platform (TDP): Acts as a centralized ingestion and query engine for all telemetry data—including OTEL, Prometheus, and custom agents.
- Dashboards & NRQL Analytics: Real-time data querying and flexible dashboards with New Relic Query Language (NRQL) for in-depth telemetry analytics.
- RUM, Synthetics, and Mobile Monitoring: Robust browser and mobile performance monitoring with detailed session tracking and uptime monitoring.
Standout Features
- Telemetry Data Lake: Stores and queries logs, metrics, and traces from a unified backend.
- Rich Dashboards with NRQL: Enables deep slice-and-dice analytics across telemetry dimensions.
- All-in-One Observability: Offers MELT support in one suite (though some depth depends on using New Relic agents).
Pros
- End-to-end observability with one UI
- Flexible ingestion of OpenTelemetry and Prometheus data
- Strong support for frontend (RUM) and mobile observability
- Easy onboarding with auto-instrumentation for many languages
- Mature alerting, SLOs, and anomaly detection capabilities
Cons
- Pricing Complexity: Charges for ingestion and per user—can lead to spiraling costs
- User Licenses Are Expensive: Full-access licenses start at $349/user/month
- Users find the learning curve steep
- The initial setup is complex
Best For
Mid-to-large DevOps teams that want quick setup, rich dashboards, and all-in-one observability—and are comfortable with cloud-only, usage-based pricing.
Pricing & Customer Reviews
- Free Tier: 100GB/month ingested
- Data Ingestion (Pro plan): $0.40/GB ingested beyond the free 100GB limit
- Usaged Pricing (Pro Plan): $349/user for full platform user
- G2 Rating: 4.4/5
New Relic vs Uptrace
New Relic offers a mature, all-in-one observability platform with deep performance analytics, but it relies heavily on proprietary agents and becomes expensive as data volume grows. Uptrace is a lightweight, OpenTelemetry-first alternative focused on distributed tracing and predictable ingestion pricing. Choose New Relic for enterprise-grade ecosystems that need broad integrations, and Uptrace when you want simpler deployment, lower costs, and OTel-native instrumentation.
6. Better Stack

Known For
Log and uptime monitoring with sleek dashboards and developer-friendly UX.
Better Stack (previously Better Uptime) combines log monitoring, incident alerting, and uptime checks with beautifully designed dashboards — ideal for developers who want lightweight observability with minimal setup.
Key Features
- Uptime Monitoring: HTTP, ping, port, and SSL checks with on-call schedules and status pages.
- Log Management: Built-in logging platform with SQL-like search, alerting, and retention controls.
- Incident Management: On-call scheduling, incident tracking, and escalation workflows.
- Team Collaboration: Slack, MS Teams, and email integrations for fast alert routing.
- Custom Dashboards: Clean, modern UI with Markdown support and status reporting.
- Developer Experience: Fast onboarding with YAML config and Git-based alert workflows.
Standout Features
- One of the cleanest UIs in observability — perfect for startups and indie teams.
- Combines uptime monitoring and log management in a unified product.
- Free plan for basic monitoring use cases with generous limits.
- Status pages, incident logs, and alerts for public communication.
Pros
- Easy to use, no steep learning curve.
- Ideal for frontend, APIs, and external service uptime monitoring.
- Fast search across logs with real-time alerting.
- Simple, elegant dashboards are great for public or internal status pages.
Cons
- It can get expensive as you scale
- Missing features such as outgoing webhooks
- Setup can feel complicated for beginners
- Log management can be limiting for long-term or detailed analysis.
Best For
- Solo developers, startups, and small teams need basic monitoring and logs.
- Teams looking for a better alternative to Pingdom or basic uptime checkers.
Pricing & Customer Reviews
- Free tier available for personal projects
- Logs: $0.15/GB
- Metrics: $7.50, 2TB included
- Errors: $0.000075/exception
- G2 Review Rating: 4.6/5
Developers love the UX and the simplicity, but many note that it lacks the deep features like outgoing webhooks, and also has a steep learning curve.
Better Stack vs Uptrace
Better Stack is an incident management + logging + uptime monitoring platform, whereas Uptrace is built for logs, traces, and metrics. Neither provides full-stack observability. But for teams prioritizing frontend uptime and lightweight alerting, Better Stack is a better fit. For backend or infra observability, CubeAPM delivers full MELT coverage with OpenTelemetry, smart sampling, and infra dashboards.
7. Coralogix
Known For
Coralogix is a modern observability platform that delivers full-stack monitoring capabilities. Its unique Streama™ architecture allows logs, metrics, and traces to be parsed and routed in real time — even before storage — making it popular for teams prioritizing ingestion control.
Key Features
- Streama™ Architecture: Real-time processing pipeline lets users route telemetry before indexing to control costs.
- Log Management: Highly scalable log ingestion with customizable parsing, tagging, and pipelines.
- Metrics & Traces: Integrated support for metrics and distributed tracing via OpenTelemetry.
- Dynamic Data Routing: Archive, monitor, or drop data based on routing rules — before paying for storage.
- Built-in Dashboards & Alerting: Pre-built views for ELK, Kubernetes, and serverless environments.
- Compliance & Archival: Archived data stored in the customer’s own cloud account (e.g., S3, GCS).
Standout Features
- Unique data routing logic helps optimize ingestion costs dramatically.
- Archived data stored in your own cloud, reducing long-term storage costs.
- Live tailing, full-text search, and correlation for fast log investigation.
- ISO, GDPR, SOC 2, and other compliance certifications in place.
Pros
- Excellent for log-heavy environments (e.g., Kubernetes, CI/CD pipelines).
- Advanced log pipeline customization and filtering.
- Strong OpenTelemetry support for traces and metrics.
- Smart cost control via real-time filtering and dynamic routing.
Cons
- Steep learning curve due to complex interface
- Overwhelming UI is challenging, especially for beginners
Best For
- Teams that ingest high volumes of logs and want granular control over what to store.
- Organizations focused on compliance and cost-optimized log retention.
Pricing & Customer Reviews
- Logs: $0.42 / GB
- Traces: $0.16 / GB
- Metrics: $0.05 / GB
- G2 Review Rating: 4.6/5
Customers appreciate Coralogix for its streaming-first architecture and cost flexibility, but warn of pricing complexity, log-only focus, and lack of end-to-end observability.
Coralogix vs Uptrace
Coralogix is ideal for teams that want advanced full-stack analytics and pipeline control, while Uptrace focuses on tracing and metrics. For teams looking to unify logs, traces, infra, and synthetics — CubeAPM offers the best of both worlds, with transparent pricing and native OTEL compatibility.
8. Sumo Logic
Known For
Cloud-native log analytics with built-in security, metrics, and monitoring for enterprise DevSecOps.
Sumo Logic is a SaaS-based observability and SIEM platform offering unified visibility across logs, metrics, and security analytics. It’s widely used by enterprises seeking compliance-ready cloud observability with native integrations for AWS, GCP, and Azure.
Key Features
- Log Management & Analytics: Powerful search and correlation engine for real-time log ingestion and visualization.
- Metrics Monitoring: Tracks system and app-level metrics with custom dashboards and alerts.
- Cloud-Native Integrations: Deep support for Kubernetes, AWS, Azure, GCP, and serverless environments.
- Security Analytics (SIEM): Includes threat detection, compliance audits, and incident response modules.
- Dashboards & Alerting: Built-in content packs, alerts, and customizable dashboards.
Standout Features
- All-in-one platform for observability + security — great for DevSecOps teams.
- SOC 2, GDPR, HIPAA compliance ready.
- Query-based log search + visualization similar to Splunk and ELK.
- Real-time correlation across telemetry and security events.
Pros
- Strong log analysis and compliance tooling.
- Scalable architecture for large orgs with multi-cloud environments.
- Integrated security and observability workflows.
- Extensive prebuilt dashboards for common services.
Cons
- Difficult learning curve, which might slow down onboarding
- Expensive, especially when scaling
- Slow performance, such as delays in UI responsiveness
Best For
- Enterprises with strong security + compliance requirements.
- Teams are already committed to SaaS infrastructure and log-first workflows.
Pricing & Customer Reviews
- Starts at $3.14 per TB scanned
- G2 Review Rating: 4.2/5
Customers value Sumo Logic for its security integrations and scalable log management, but commonly cite cost, rigid plans, and limited tracing as reasons to explore other APM options.
Sumo Logic vs Uptrace
Sumo Logic provides stronger security analytics and log compliance, while Uptrace focuses on traces and OTEL-based debugging. CubeAPM combines both capabilities — logs, traces, RUM, and synthetics — under one roof with predictable pricing and OpenTelemetry-native ingest.
Conclusion: Choosing the Right Uptrace Alternative
As observability needs mature, many teams are moving beyond lightweight tracing tools like Uptrace in search of platforms that offer full MELT visibility, cost control, and enterprise-grade reliability. Whether it’s the need for real user monitoring, smarter sampling, or self-hosted compliance, the market now offers modern, OpenTelemetry-friendly alternatives that go far beyond what Uptrace was built to do.
Why CubeAPM Leads the Pack
Among all Uptrace alternatives, CubeAPM stands out for its OpenTelemetry-first design, smart sampling, full-stack observability, and blazing-fast, compliance-ready hosting options. With 60–80% cost savings, no per-user fees, and support for logs, infra, synthetics, RUM, and traces — CubeAPM delivers everything modern engineering teams need, without the operational drag or pricing surprises.
Whether you’re scaling past Uptrace’s limitations or seeking deeper visibility without vendor lock-in, CubeAPM offers a frictionless, developer-friendly, and future-ready upgrade — built for the next generation of observability.
Disclaimer: The information in this article reflects the latest details available at the time of publication and may change as technologies and products evolve.
FAQs
1. What is the best alternative to Uptrace?
CubeAPM is widely considered the top Uptrace alternative in 2025. It offers full-stack MELT observability, OpenTelemetry-native ingestion, smart sampling, and 60–80% cost savings over legacy tools — all with support for self-hosting and unlimited users.
2. Why are teams switching from Uptrace?
Teams often outgrow Uptrace due to its limited feature set — it lacks log support, real user monitoring, smart sampling, and enterprise-grade hosting. As observability needs grow, users turn to more complete platforms like CubeAPM, Datadog, and Dynatrace.
3. Is CubeAPM better than Uptrace for OpenTelemetry?
Yes, CubeAPM is fully OpenTelemetry-native and adds features Uptrace lacks — such as smart sampling, infrastructure monitoring, synthetics, and RUM — making it a stronger fit for modern observability pipelines.
4. Which Uptrace alternative is most cost-effective?
CubeAPM offers the best value, with transparent usage-based pricing (e.g., $0.15/GB for ingestion) and no per-user fees. It delivers enterprise-grade features at a fraction of the cost of Datadog or Dynatrace.
5. Can I migrate from Uptrace to CubeAPM easily?
Yes, CubeAPM supports easy migration from Uptrace in under an hour. It integrates natively with OpenTelemetry and provides Slack-based onboarding support to ensure a smooth transition.


