PRTG Network Monitor is a powerful, all-in-one monitoring tool with broad protocol support and flexible, sensor-based monitoring. However, its extensive features can feel overwhelming for new users, and the initial setup may be complex without prior experience.
CubeAPM is the best alternative to Paessler, offering unified MELT observability with 800+ integrations, simple $0.15 per GB pricing, an easy setup process, and an intuitive interface built for modern teams.
In this article, we’ll explore the top Paessler PRTG alternatives in 2025, their strengths, limitations, and pricing models.
Top 8 Paessler PRTG Network Monitor Alternatives in 2025
- CubeAPM
- AppSignal
- Microsoft Azure Monitor
- New Relic
- Zenoss
- Dynatrace
- Stackify Retrace
- Datadog
Why Teams Look for Paessler PRTG Alternatives
1. Complex Initial Setup
While powerful once configured, the initial setup process is often described as complex and time-consuming, particularly for users without prior experience in similar monitoring platforms.
“Setting up SSL for secure web access was more complicated than I expected.”(G2 Review)
2. Steep Learning Curve for Advanced Use
Getting full value from PRTG typically requires time to understand sensors, dependencies, and alert tuning, which can slow adoption for teams that need quicker time to insight.
“Some advanced features require a learning curve.” (G2 Review)
Criteria for Suggesting Paessler PRTG Alternatives
1. Transparent and Predictable Pricing
PRTG’s sensor-based model becomes costly as environments expand. The best alternatives provide flat or usage-based pricing with clear tiers for data ingest, storage, and users, avoiding hidden costs.
2. Cloud-native and OpenTelemetry Support
Modern teams need observability designed for Kubernetes, serverless, and microservices. Strong alternatives are OpenTelemetry-first and integrate seamlessly into containerized and hybrid cloud environments.
3. Full MELT Coverage
Alternatives should combine APM, distributed tracing, logs, metrics, RUM, synthetics, and error tracking in one place, eliminating the need to stitch together multiple tools.
4. Scalability and High Performance
A good replacement must scale from small IT setups to enterprise workloads without relying on probe-heavy architectures. Efficient sampling and data pipelines help reduce overhead.
5. Ease of Setup and Migration
PRTG requires probe configuration and sensor tuning. Stronger alternatives offer one-click integrations, API compatibility, and simple onboarding, making migration smoother.
Paessler PRTG Overview
Known For
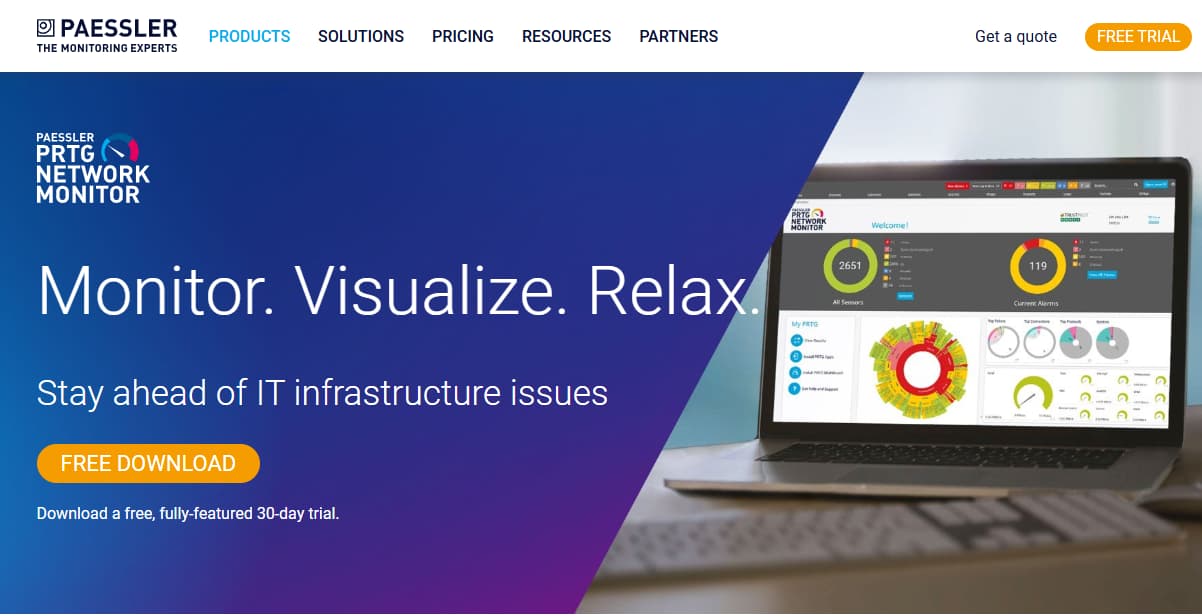
Paessler PRTG is known for being a long-standing all-in-one monitoring solution built around a sensor-based model, where each sensor tracks a specific metric such as bandwidth usage, CPU load, or application response time. It has earned a reputation among IT teams for providing comprehensive visibility into networks, servers, applications, and devices through a single console, making it especially popular with mid-market enterprises and managed service providers.
Standout Features
- 200+ preconfigured sensors covering SNMP, WMI, NetFlow, packet sniffing, and REST
- Auto-discovery to scan networks and deploy sensors automatically
- Distributed monitoring with probes across multiple sites
- Flexible alerting and notifications (email, SMS, push, API hooks)
- Real-time dashboards and customizable network maps
Key Features
- Multi-protocol monitoring (SNMP, WMI, HTTP, ICMP, NetFlow, sFlow)
- Remote probe support for distributed environments
- Custom sensors and scripting for unique use cases
- Role-based access controls for secure operations
- Advanced reporting and scheduled exports
- Clustering and failover for high availability
Pros
- Mature and stable platform with decades of trust in IT monitoring
- Wide coverage of network devices, servers, and applications
- Quick to set up with auto-discovery and prebuilt sensors
- Strong alerting flexibility with multiple notification channels
- Suitable for hybrid and multi-site environments
Cons
- Steep learning curve, especially for new users
- Complex initial setup
Best For
IT teams and MSPs that need reliable, centralized monitoring of infrastructure, networks, and hybrid environments, especially where traditional server and device visibility is a priority.
Pricing & Customer Reviews
- Free edition with up to 100 sensors
- PRTG 500 – $179/month (up to 500 aspects, ~50 devices)
- PRTG 1000 – $325/month (up to 1,000 aspects, ~100 devices)
- PRTG 2500 – $675/month (up to 2,500 aspects, ~250 devices)
- PRTG 5000 – $1,183/month (up to 5,000 aspects, ~500 devices)
- PRTG 10000 – $1,492/month (up to 10,000 aspects, ~1,000 devices)
- PRTG Enterprise – $1,671/month starting (scales beyond 10,000 aspects, for distributed & multi-location monitoring)
- Larger deployments can use PRTG Enterprise Monitor, starting around $16,000/year for 20,000 sensors.
- Customer rating: 4.5/5 on G2, with users praising reliability and coverage, but often criticizing sensor-based pricing and dated UI.
Top 8 Paessler PRTG Alternatives
1. CubeAPM

Known For
CubeAPM is known as a modern, OpenTelemetry-first observability platform built to solve the cost and complexity challenges of legacy APMs like Paessler PRTG. Instead of relying on sensor counts, CubeAPM provides flat usage-based pricing and full-stack observability—covering logs, metrics, traces, RUM, synthetics, and infrastructure.
Key Features
- Unified observability across APM, distributed tracing, logs, infrastructure, RUM, and synthetics
- Native OpenTelemetry ingestion plus compatibility with Datadog, New Relic, Prometheus, and Elastic agents
- Custom dashboards, alerting, SLOs, RBAC, multi-environment support
- Scalable cluster mode for high availability
- Security and governance with audit logs, SSO, and MFA
Standout Features
- Smart Sampling
- Zero egress costs with predictable $0.15/GB ingestion pricing
- 800+ integrations with cloud services, databases, frameworks, and infrastructure
- Rapid migration with compatibility for existing agents and instrumentation
- Ultra-fast support through Slack/WhatsApp directly with engineers
Pros
- Transparent and predictable cost model
- Full-stack coverage in one platform
- Faster setup and migration compared to incumbents
- Excellent integration ecosystem
- Unlimited data retention included
Cons
- Not suited for teams looking for off-prem solutions
- Strictly an observability platform and does not support cloud security management
Best For
Organizations that need cloud-native, cost-efficient observability at scale—ideal for SaaS companies, fintechs, and enterprises struggling with PRTG’s licensing limits.
Pricing & Customer Reviews
- Pricing: Flat Pricing of $0.15/GB ingestion
- Customer rating: 4.8/5 (Based on end-user feedback from Slack)
CubeAPM vs Paessler PRTG
PRTG is a mature monitoring tool known for its broad protocol support and deep configurability, making it suitable for traditional network-centric environments. CubeAPM, in contrast, focuses on unified full-stack observability with metrics, events, logs, and traces in one platform, simpler setup, and predictable $0.15 per GB pricing. Overall, CubeAPM is best for teams that want easier onboarding, clearer costs, and modern observability without operational complexity.
2. AppSignal
Known For
AppSignal is known as a lightweight APM and error tracking tool built for developers. It is especially popular with teams working in Ruby, Elixir, and Node.js, where it provides quick setup, clean dashboards, and actionable performance insights. Unlike heavy enterprise APMs, AppSignal focuses on being developer-friendly and affordable.
Key Features
- Application Performance Monitoring with transaction-level breakdowns
- Error and exception tracking with detailed stack traces
- Real-time performance dashboards
- Custom metrics collection via built-in libraries
- Alerts delivered through Slack, email, or webhook integrations
Standout Features
- Simple installation and setup with framework-specific SDKs
- Strong focus on Ruby on Rails and Elixir ecosystems
- Developer-first experience, designed to be intuitive and low overhead
Pros
- Easy to deploy and start using quickly
- Affordable pricing compared to enterprise APMs
- Clean, developer-focused interface
- Good error tracking and app health visibility
Cons
- Overwhelming UX/UI that hinders usability for beginners
- High costs, especially for high traffic
Best For
Small and mid-sized developer teams looking for fast, affordable APM and error tracking without the complexity of enterprise monitoring tools.
Pricing & Customer Reviews
- Logging is free for the first 1GB/month
- APM: $25 for 250K requests/month
- Enterprise SAML SSO ($ 449 per month)
- Long-term log storage ($ 89 per month)
- HIPAA Compliance ($ 89 per month)
- G2 Rating: 4.8/5
AppSignal vs Paessler PRTG
AppSignal focuses on application performance monitoring with tracing, error tracking, and developer-friendly insights, while PRTG is designed for broader infrastructure and network monitoring. Teams typically choose AppSignal for application-level visibility.
3. Microsoft Azure Monitor
Known For
Microsoft Azure Monitor is known as a cloud-native observability service tightly integrated with the Azure ecosystem. It enables enterprises to collect, analyze, and act on telemetry data from applications, infrastructure, and services running in Azure. Organizations use it to gain end-to-end visibility into Azure-hosted workloads without needing third-party tools.
Key Features
- Application Insights for APM, distributed tracing, and dependency maps
- Log Analytics for centralized query and analysis of telemetry data
- Metrics Explorer for real-time resource monitoring
- Alerts and automation rules that connect to Azure Functions, Logic Apps, or DevOps workflows
- Integration with Azure DevOps for CI/CD pipeline monitoring
Standout Features
- Native integration with all Azure services
- Auto-scaling telemetry pipeline aligned with Azure workloads
- Advanced security and compliance controls built into the Microsoft ecosystem
Pros
- Seamlessly integrated into the Azure platform
- Strong alignment with Azure DevOps and enterprise workflows
- Scales automatically with cloud resources
- Comprehensive monitoring of Azure-native services
Cons
- Debugging workflows can be complex and hard to follow
- Metrics and alert configuration are often confusing and overwhelming
- Alerting can become noisy due to complex setups
Best for
Enterprises with a cloud-first strategy on Microsoft Azure, looking for monitoring tightly embedded into their infrastructure and DevOps stack.
Pricing & Customer Reviews
- Auxiliary Logs: $0.05/GB of data ingested
- Basic logs: $0.50/GB of data ingested
- Analytic Logs: $2.30/GB of data ingested
- Query: $0.005/GB of data scanned
- Metrics beyond the free tier are billed at $0.25/GB
- Customer rating: 4.3/5 on G2
Azure Monitor vs Paessler PRTG
Azure Monitor is a cloud-native observability service for metrics, logs, and alerts across Azure resources, while PRTG is a sensor-based network and infrastructure monitoring tool for on-premises environments. Teams pick Azure Monitor for seamless Azure integration and cloud-centric insights.
4. New Relic
Known For
New Relic is known as a full-stack observability platform that consolidates application, infrastructure, and user experience monitoring into a single platform. It is widely used by enterprises that need deep insights into distributed systems, cloud workloads, and business-critical applications.
Key Features
- Application Performance Monitoring (APM) with code-level transaction insights
- Distributed Tracing to track dependencies across microservices
- Log Management with ingestion, search, and filtering
- Infrastructure Monitoring for servers, VMs, and cloud platforms
- Real User Monitoring (RUM) and Synthetic Monitoring for performance testing
- AI-powered anomaly detection with Applied Intelligence
Standout Features
- Unified data platform for logs, metrics, traces, and events
- Applied Intelligence for anomaly detection and incident correlation
- Large ecosystem of prebuilt integrations and dashboards
Pros
- Comprehensive observability across the entire stack
- Rich visualizations and intuitive dashboards
- Strong adoption and reputation in enterprise IT
- AI-driven features reduce time to resolution
Cons
- Pricing is unpredictable with data ingestion and user licensing
- Steeper learning curve for new users
Best for
Enterprises needing a mature, all-in-one observability solution with advanced APM and AI-powered monitoring at global scale.
Pricing & Customer Reviews
- Free Tier: 100GB/month of data ingested
- Telemetry(logs): $0.40/GB beyond free 100 GB limit
- Full Platform User:$418/user/month for full platform access
- Customer rating: 4.5/5 on G2
New Relic vs Paessler PRTG
New Relic is a full-stack observability platform focused on application performance, distributed tracing, logs, and metrics across cloud-native environments, while PRTG is primarily used for infrastructure and network monitoring. Teams pick New Relic when they need deeper application-level visibility and modern observability across services.
5. Zenoss

Known For
Zenoss is known as an enterprise-grade IT monitoring and service assurance platform, designed for hybrid and complex environments. It focuses on monitoring infrastructure, applications, and services, with strong event correlation and root-cause analysis.
Key Features
- Infrastructure Monitoring across servers, storage, and network devices
- Event Correlation and Root-Cause Analysis to reduce alert noise
- Service Impact Monitoring to understand how issues affect business services
- Multi-cloud and Virtualization Support for hybrid IT environments
- Integration with ITSM tools for incident and change management
Standout Features
- Real-time service dependency mapping and visualization
- Strong event correlation engine to minimize false alerts
- Focused on service assurance and availability rather than just metrics
Pros
- Excellent for large-scale IT environments with complex dependencies
- Reduces noise with correlation and dependency mapping
- Integrates well with ITSM workflows (e.g., ServiceNow)
- Provides strong visibility into hybrid and multi-cloud setups
Cons
- Complex to deploy and configure
- Cost can be high for enterprise deployments
Best For
Large enterprises with data centers and hybrid IT environments, especially those prioritizing service assurance and integration with ITSM.
Pricing & Customer Reviews
- Pricing: Not disclosed, custom-based pricing
- Customer rating: 3.9/5 on G2
Zenoss vs Paessler PRTG
Zenoss is a hybrid IT monitoring platform that uses AI-driven insights and service modeling to monitor infrastructure, cloud, and services, while PRTG is a sensor-based network and systems monitoring tool. Teams pick Zenoss when they want unified, model-based observability with advanced analytics.
6. Dynatrace
Known For
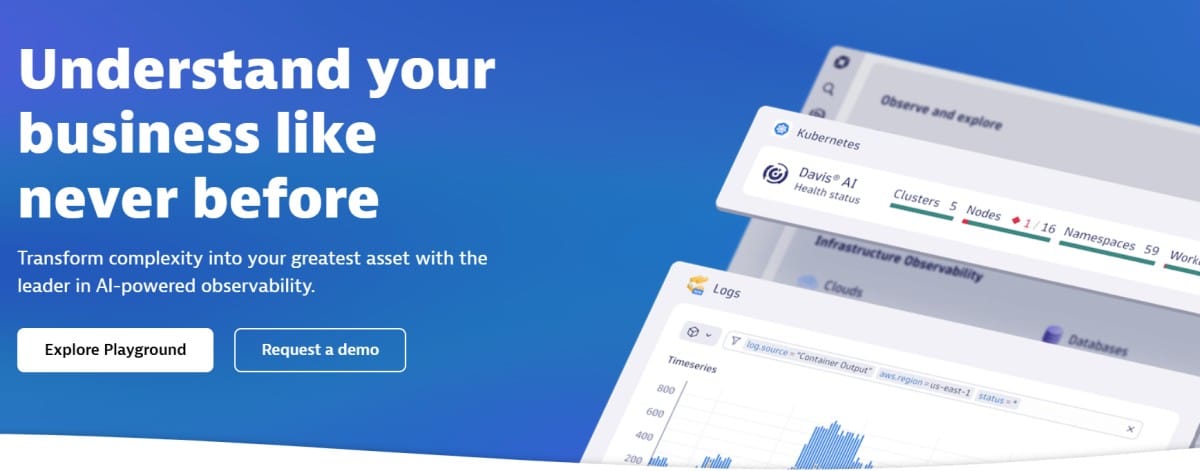
Dynatrace is known as a leading enterprise observability and automation platform powered by AI. It offers full-stack monitoring across applications, infrastructure, and user experience, with automated root-cause analysis and service dependency mapping.
Key Features
- Application Performance Monitoring (APM) with deep code-level insights
- Distributed Tracing with automatic instrumentation across microservices
- Infrastructure and Cloud Monitoring for VMs, containers, and Kubernetes
- Log Monitoring and Event Analytics for centralized troubleshooting
- Real User Monitoring (RUM) and Synthetic Monitoring for customer experience
- Davis AI Engine for anomaly detection and causal analysis
Standout Features
- AI-powered anomaly detection and root-cause analysis
- Automatic service discovery and dependency mapping
- Unified data model across logs, metrics, traces, and user experience
- Deep Kubernetes and cloud-native observability out of the box
Pros
- Extremely powerful for large-scale, complex environments
- Automation reduces manual setup and tuning
- AI insights significantly cut down mean time to resolution (MTTR)
- Rich dashboards and service dependency visualization
Cons
- High costs as usage increases
- Implementation complexity—can overwhelm smaller teams
- Some users report a steep learning curve for the full feature set
Best for
Enterprises that need scalable, AI-driven observability across hybrid and cloud-native environments, with automation to reduce manual overhead.
Pricing & Customer Reviews
- Infrastructure Monitoring: $29 / mo per host
- Full-Stack Monitoring: $58 / mo per 8 GiB host
- Rating: 4.5/5 on G2, praised for AI capabilities and end-to-end visibility, and criticized for high cost and complexity.
Dynatrace vs Paessler PRTG
Dynatrace is an AI-driven full-stack observability platform with automated dependency mapping, real-time analytics, and deep application performance and cloud-native monitoring, while PRTG is a sensor-based tool focused on traditional network and infrastructure monitoring. Teams pick Dynatrace for comprehensive, automated observability across dynamic environments.
7. Stackify Retrace
Known For
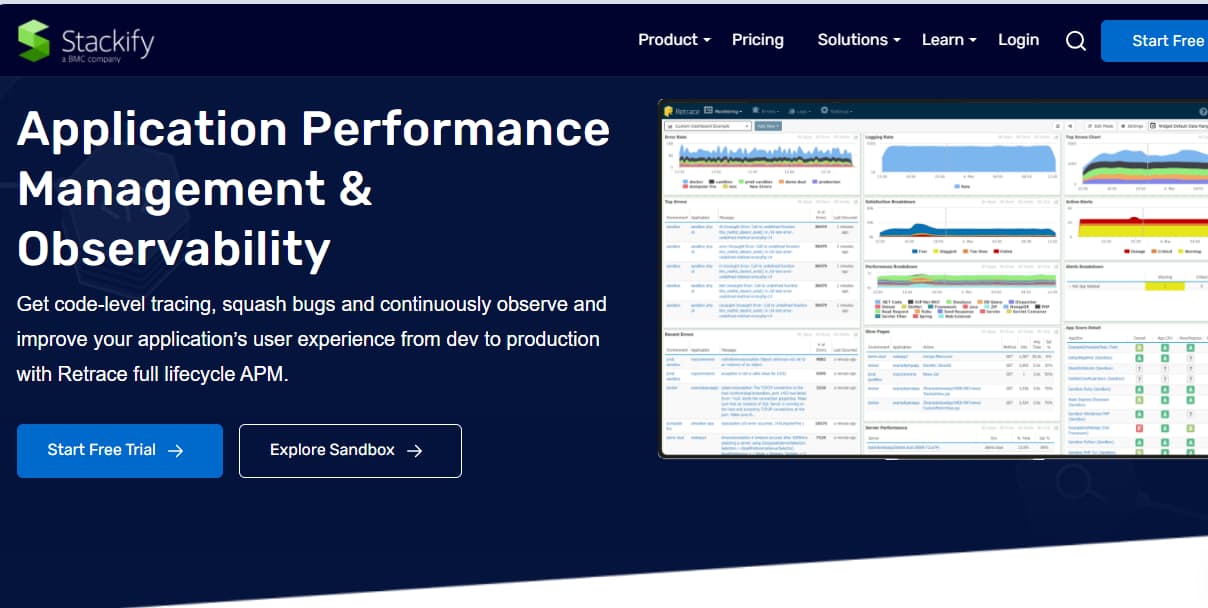
Stackify Retrace is known as a developer-focused APM and error tracking platform built for application performance management rather than infrastructure. It is widely used by .NET, Java, and PHP teams looking for a simple, cost-effective way to monitor applications, logs, and errors in one place.
Key Features
- Application Performance Monitoring with transaction tracing
- Centralized Log Management with search and analytics
- Error and Exception Tracking with detailed stack traces
- Application Metrics including CPU, memory, and SQL query performance
- Cloud-based SaaS deployment with quick setup
Standout Features
- Tailored for developers, not IT operations
- Integrates tightly with IDEs and developer workflows
- Combines APM, logs, and error tracking in one lightweight tool
- Affordable pricing compared to enterprise APM vendors
Pros
- Easy to deploy and adopt for small-to-mid teams
- Affordable and transparent pricing model
- Strong .NET and Java support
- Useful error tracking and log correlation features
Cons
- Complex and unintuitive interface.
- Steep learning curve.
- Challenging configuration of integrations.
Best For
Small and mid-sized businesses or dev teams needing affordable, developer-first APM with integrated logs and error tracking.
Pricing & Customer Reviews
- Tier 1: $80/month billed annually
- Tier 2: $249/month billed annually
- Enterprise: Custom
- G2 Rating: Retrace scores 4.2/5.
Stackify Retrace vs Paessler PRTG
Stackify Retrace is an application performance monitoring (APM) tool focused on code-level insights, error tracking, and performance metrics for developers, while PRTG is a sensor-based network and infrastructure monitoring solution. Teams pick Stackify Retrace for deep application visibility and developer-centric diagnostics.
8. Datadog
Known For
Datadog is known as a cloud-native observability leader offering unified monitoring for infrastructure, applications, logs, and security. It is widely adopted by organizations across industries for its breadth of integrations and strong support for multi-cloud environments.
Key Features
- Application Performance Monitoring (APM) with distributed tracing
- Infrastructure Monitoring with 900+ out-of-the-box integrations
- Log Management and Analytics with centralized ingestion
- Real User Monitoring (RUM) and Synthetic Monitoring
- Security Monitoring for detecting anomalies and threats
- Dashboards and Alerts with real-time metrics and custom visualizations
Standout Features
- Extensive integration ecosystem covering cloud providers, databases, containers, and CI/CD tools
- Rich real-time dashboards with high granularity
- Strong adoption in multi-cloud and containerized environments
- Advanced usage-based modules (APM, logs, synthetics, security)
Pros
- Full-stack observability in one platform
- Huge integration library with frequent new additions
- Strong community and global adoption
- Mature ecosystem with partner and marketplace support
Cons
- Expensive at scale due to per-host and per-GB costs
- Complex pricing model with hidden retention fees
- Overwhelming for smaller teams
Best For
Organizations with large, distributed, multi-cloud architectures looking for a proven observability platform with extensive ecosystem support.
Pricing & Customer Reviews
- APM (Pro Plan): $35/host/month
- Infra (Pro Plan): $15/host/month
- Ingested Logs: $0.10 per ingested or scanned GB per month
- Rating: 4.5/5 on G2.
- Praised for: Easy setup, comprehensive coverage, wide integrations, and advanced AI-driven insights.
- Criticized for: High costs at scale, complex pricing, and limited flexibility for smaller teams.
Datadog vs Paessler PRTG
Datadog is a cloud-native observability platform offering unified metrics, logs, traces, and infrastructure monitoring with strong integrations and dashboards, while PRTG is primarily a sensor-based tool for traditional network and system monitoring. Teams pick Datadog for full-stack, cloud-first observability across modern environments.
Conclusion
Paessler PRTG remains a solid choice for traditional IT and network monitoring, but its sensor-based licensing, Windows-heavy design, and lack of modern observability features make it less effective in today’s cloud-native world. Teams now need deeper visibility into distributed systems, real user experiences, and Kubernetes workloads.
For organizations ready to modernize, CubeAPM offers the clearest path forward—balancing full-stack observability with transparent, predictable costs. It’s built to scale with modern workloads while staying accessible to teams that want to move beyond legacy monitoring.
Disclaimer: The information in this article reflects the latest details available at the time of publication and may change as technologies and products evolve.
FAQs
1. Why are companies searching for Paessler PRTG alternatives?
Companies often move away from PRTG because its sensor-based licensing model becomes expensive as environments grow. It also lacks native support for distributed tracing, Kubernetes monitoring, and real user insights. Many teams now consider tools like CubeAPM that are built cloud-native and cost-predictable.
2. What are the main limitations of Paessler PRTG?
PRTG is reliable for network and infrastructure monitoring, but it does not provide end-to-end observability. Missing features like log correlation, error tracking, and RUM make it harder to troubleshoot modern applications efficiently. Platforms such as CubeAPM extend visibility into these areas.
3. Which alternative is the most cost-efficient?
Some modern observability platforms, including CubeAPM, now offer flat pricing per GB of telemetry and eliminate extra egress charges. This makes them more predictable and scalable than PRTG’s sensor-based model, especially for high-volume data environments.
4. How do PRTG alternatives improve cloud-native monitoring?
Alternatives often provide native Kubernetes, microservices, and serverless monitoring. They integrate with OpenTelemetry pipelines, making it easier for teams to track distributed workloads in real time—something PRTG cannot deliver out of the box.
5. What should teams prioritize when selecting a PRTG replacement?
The key factors are transparent pricing, OpenTelemetry support, MELT coverage (Metrics, Events, Logs, Traces), and easy integrations. Prioritizing these ensures cost savings and operational efficiency as systems scale.


