Azure function monitoring is becoming mission-critical as serverless adoption surges. By September 2025, enterprise use of serverless grew over 30% year-over-year, with Azure Functions driving much of this momentum.
Yet rapid scale brings challenges for teams. Cold starts add unpredictable latency, triggers sometimes fail to fire, and downstream errors are buried in fragmented logs. With short execution timeouts and complex dependencies, debugging often consumes hours and drives hidden costs.
CubeAPM is the best solution for monitoring Azure Functions. It unifies metrics, logs, and traces into a single view, highlights cold-start patterns, and pinpoints dependency issues. With smart sampling, real-time error tracking, and anomaly detection, CubeAPM delivers deep visibility.
In this article, we’ll explain what Azure Functions are, why monitoring them is critical, the key metrics to track, and how CubeAPM simplifies observability with purpose-built monitoring tools.
What are Azure Functions?

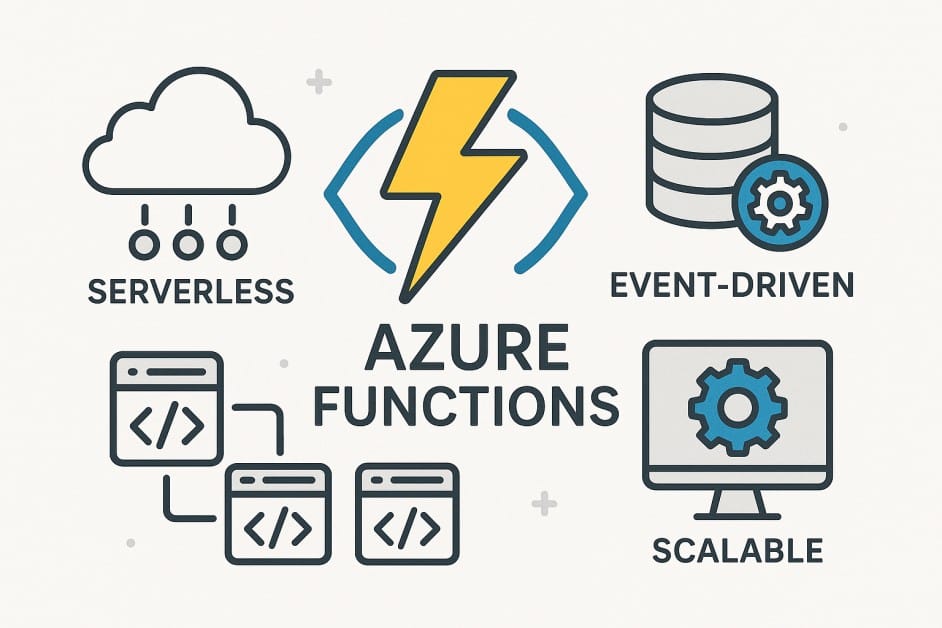
Azure Functions is Microsoft’s serverless compute service that lets developers run event-driven code without provisioning or managing servers. Instead of maintaining infrastructure, you focus on writing small units of code (functions) that trigger on events such as HTTP requests, database updates, or messages from a queue. Azure automatically handles scaling, execution, and billing based on usage.
This serverless model is a major advantage for businesses today. It reduces operational overhead, lowers costs with pay-per-execution pricing, and enables rapid development of microservices, APIs, and data pipelines. Teams can move faster, experiment without infrastructure bottlenecks, and scale applications instantly during unpredictable traffic spikes—all while staying tightly integrated with the wider Azure ecosystem.
Example: Using Azure Functions for Order Processing
When a customer places an order, an HTTP trigger fires a function to validate payment, update inventory in Cosmos DB, and send confirmation emails. During flash sales, thousands of requests can arrive per second, and Azure Functions automatically scales to handle the load without the retailer needing to provision additional servers. This agility is why enterprises increasingly rely on Functions for mission-critical workloads.
Why Monitoring Azure Functions is Critical
Monitoring Azure Functions is about ensuring event-driven applications stay reliable, cost-efficient, and performant under real-world conditions. Here’s why it matters:
Cold Starts and Plan-Specific Behavior
Cold start latency remains one of the top performance issues in serverless platforms. With 50% of global businesses using serverless computing and the market is set to hit $22 billion by 2025, imagine how much is at stake.
Azure Functions scale to zero when idle, which means the first invocation after inactivity spins up a new instance. This “cold start” can add hundreds of milliseconds—or even seconds—to response time, especially on the Consumption plan. Premium and Flex plans reduce this risk with pre-warmed instances, but they come at a higher cost.
Trigger Reliability and Event Delivery
Functions rely on triggers (HTTP, Timer, Blob Storage, Service Bus, Event Grid) to run. If triggers aren’t synced, or if permissions/host startup fail, executions may never occur. Missed triggers can lead to lost business events—like orders not processed or emails not sent. Monitoring ensures triggers fire as expected, tracks queue depths, and detects when retries push messages into dead-letter queues (DLQs).
Managing Telemetry Costs in Azure Monitor
By default, Azure Functions monitoring integrates with Application Insights, which bills per gigabyte of telemetry ingested. Spikes in log verbosity, high-cardinality traces, or noisy dependencies can inflate monitoring costs overnight. Monitoring ingestion volume by category (traces, logs, metrics) helps teams apply smart sampling and detect cost regressions before finance teams are surprised.
Dependency Tracing and Downstream Failures
Most Azure Function “errors” don’t originate in the function code—they come from dependencies like Cosmos DB, partner APIs, or queue backlogs. Without distributed tracing, these failures appear as generic timeouts or exceptions. Monitoring with correlated traces links function invocations to the exact database query, HTTP request, or message that failed.
Durable Functions and Orchestration Visibility
Durable Functions extend Azure Functions to build stateful workflows with fan-out/fan-in patterns, retries, and compensation logic. Monitoring these orchestrations is far more complex than single executions. Tracking orchestration instance state, latency, and history provides visibility into long-running workflows, ensuring critical business processes don’t silently stall.
Timeouts, Concurrency, and Execution Limits
Azure Functions have different execution and concurrency limits depending on the hosting plan. The Consumption plan has a maximum execution timeout of 10 minutes, which may not be enough for heavy workloads. Premium/Dedicated plans allow longer executions and higher concurrency.
Networking and VNet Integration Effects
Integrating Functions with VNets and private endpoints can improve security but often impacts latency and startup times. Monitoring startup duration, dependency latency, and connection times after enabling VNet integration ensures that security gains don’t unintentionally degrade performance.
Configuration Drift in Observability
Monitoring pipelines can drift due to misconfigured host.json files, changes between the in-process and isolated .NET worker models, or CI/CD packaging differences. This often leads to telemetry that appears in Live Metrics but not in Application Insights queries. Regularly validating that logs, metrics, and traces are arriving with the correct schema ensures observability remains reliable.
Key Metrics for Azure Functions Monitoring
When monitoring Azure Functions, it’s important to track specific metrics that directly reflect performance, reliability, resource usage, and costs. Here are the key categories and their most important metrics:
Performance
- Function execution count: This measures how many times a function is triggered. It shows workload volume, helps identify scaling patterns, and confirms that triggers are firing as expected. Sudden spikes or drops can point to load changes, misconfigured triggers, or failed upstream services.
- Execution duration (p95, max latency): Tracking average execution time isn’t enough — the 95th percentile (p95) and maximum latency highlight slow-running outliers. These metrics help identify bottlenecks in code or dependencies and ensure the majority of requests meet SLA targets.
- Cold start count: Cold starts occur when new instances of a function spin up after inactivity. Monitoring cold start frequency is crucial for performance-sensitive apps since high counts translate directly to poor user experience, especially on HTTP-triggered APIs.
Reliability
- Failed function executions: This metric tracks how many function invocations end in failure. Monitoring it helps you identify stability issues and uncover whether failures are systemic or isolated to specific functions.
- Timeout errors: Functions on the Consumption plan have execution time limits (default 5 minutes, max 10). Timeout metrics show how often functions hit these limits, signaling inefficient code or the need to move long-running jobs to Premium/Dedicated plans.
- Dependency errors (e.g., failed DB calls): Most function failures come from external services like Cosmos DB, SQL, or REST APIs. Tracking dependency error counts reveals whether downstream systems are unreliable, overloaded, or throttling requests.
Resource Usage
- Memory consumption: Azure Functions billing is tied to memory allocation and execution time. Monitoring memory usage ensures functions stay within allocation, avoids out-of-memory crashes, and highlights opportunities to optimize or reconfigure plans.
- CPU usage: CPU metrics show whether compute resources are sufficient. High CPU utilization may indicate heavy workloads (like JSON parsing or encryption tasks) that need optimization or larger allocations.
- Concurrency limits reached: Each plan has concurrency caps — for example, how many executions a function app instance can handle. Monitoring when you hit these limits ensures scaling rules are working and that load isn’t being throttled.
Costs & Scaling
- Instance count (scaling behavior): This metric shows how many function instances Azure spins up during load. Tracking scaling behavior ensures functions respond to demand and helps detect misconfigurations when instance count doesn’t match queue growth or request volume.
- Average execution cost: Calculated from execution time, memory allocation, and invocation volume, this metric ties performance back to actual spend. Monitoring cost per function makes it easier to optimize workloads and control cloud bills.
- Queue length for trigger-based Functions: Functions triggered by Service Bus, Event Hub, or Storage queues depend on backlog processing. A growing queue length signals that function scaling isn’t keeping up, risking delayed or lost messages.
Telemetry Collection, Error Tracking & Alerting with CubeAPM
Azure Functions generate massive amounts of telemetry, but without the right tooling, it’s hard to make sense of it. CubeAPM simplifies this by unifying telemetry, surfacing errors in real time, and providing intelligent alerts that cut through the noise.
Unified Telemetry with Logs, Metrics & Traces

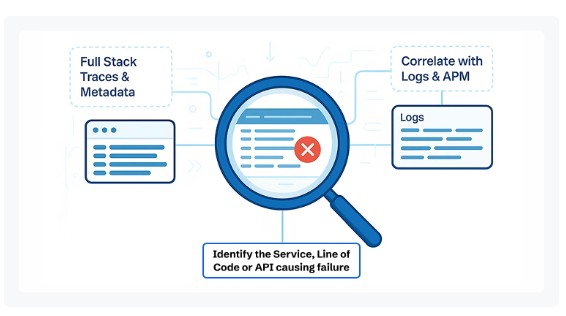
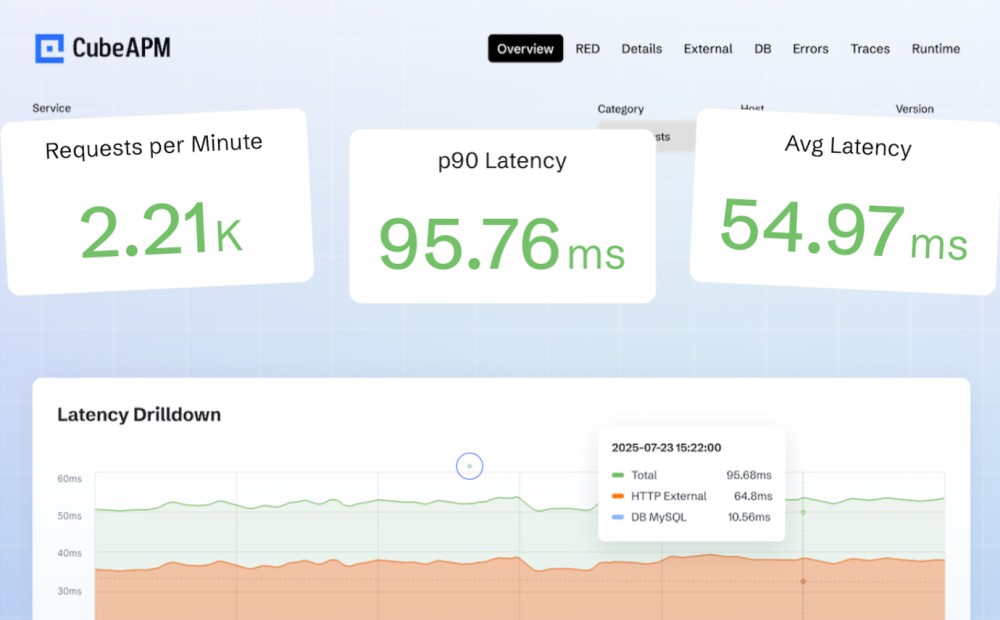
CubeAPM brings logs, metrics, and traces together into one view instead of scattering them across multiple tools. It’s fully OpenTelemetry-compatible, so you can instrument Azure Functions with standard SDKs and stream telemetry without lock-in. Unlike traditional platforms that charge separately for logs and traces, CubeAPM’s smart sampling keeps costs low while still retaining critical data. This unified approach makes it easier to connect a slow function to the exact downstream query, or link a surge in execution time to noisy dependencies.
Real-Time Error Tracking

Errors in Azure Functions can be hard to trace because they’re often ephemeral — a function spins up, fails, and disappears. CubeAPM captures these transient errors in real time, tagging them with context like request payloads, trace IDs, and dependency calls.
That means you don’t just see “Function failed,” but why it failed — whether due to an invalid event, a timeout on Cosmos DB, or a Service Bus poison message. With an “Errors Inbox” built in, teams can triage issues quickly instead of digging through endless log streams.
Intelligent Alerting & Anomaly Detection

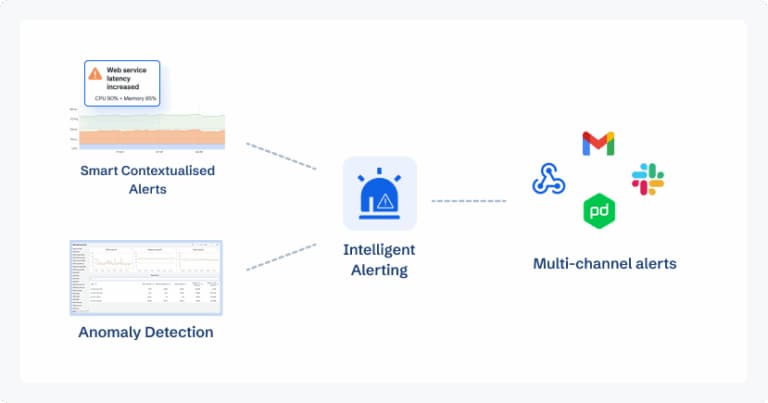
Not every spike deserves a 3 a.m. page. CubeAPM uses intelligent alerting that relies on baselines and anomaly detection, flagging only when behavior deviates significantly. For example, a sudden 3x increase in cold starts or a rising DLQ backlog will trigger alerts, but single transient errors won’t flood your inbox. Alerts can be sent via Slack, WhatsApp, or email, with direct access to the traces that triggered them. Combined with CubeAPM’s smart sampling, this keeps noise low and focus high — so teams respond faster and only to what matters.
How to Monitor Azure Functions with CubeAPM
Getting started with Azure Function monitoring doesn’t have to be complicated. With CubeAPM’s OpenTelemetry-native design, you can set up full observability in just a few steps.
Instrument Your Azure Functions
Begin by instrumenting your Azure Functions with OpenTelemetry SDKs (for .NET, Node.js, etc.), so you emit traces, logs, and metrics. CubeAPM’s docs under Instrumentation explain how to integrate agents and set environment variables to export metrics. (Use the Instrumentation section on CubeAPM docs.)
Deploy the CubeAPM Collector
Deploy the CubeAPM Collector to receive telemetry via OTLP or Prometheus before sending it to CubeAPM. CubeAPM’s Prometheus Metrics page shows how to configure the collector to scrape and collect metrics via a Prometheus receiver.
Configure Dashboards for Key Metrics

With metrics flowing in, build dashboards around execution count, latency (p95, max), errors, cold starts, dependency issues, and cost signals. Use the metrics collected via Prometheus or OTLP and visualize them in CubeAPM dashboards. The same Prometheus Metrics page gives you examples of metrics ingestion to drive dashboards.
Set Alerts and Thresholds
Then set up alerts that trigger under important conditions—like high error rates, cold-start surges, or degrading dependency performance. For how to send alert notifications, CubeAPM has a live page “Webhook for Alerting” that shows how you can configure alerts to send HTTP POSTs (or integrate with Slack, etc.).
Real-World Example: Reducing MTTR by 60% with CubeAPM
The Challenge
A large e-commerce retailer built its checkout workflow on Azure Functions, chaining together multiple services: HTTP-triggered payment validation, Cosmos DB for inventory updates, and Service Bus for order confirmations. Under normal traffic, this setup worked fine, but during high-volume flash sales the cracks started to show. Customers frequently saw failed checkouts, payments timed out, and emails never arrived.
The team noticed symptoms like 5xx errors in checkout functions, retries piling into the dead-letter queue (DLQ), and cold-start latency stretching response times. Debugging was slow because telemetry was scattered across Azure Monitor, Application Insights, and scattered logs. On average, it took engineers 3–4 hours to identify the root cause, costing revenue and frustrating both users and developers.
The CubeAPM Solution
The retailer adopted CubeAPM to unify observability and get clear insights across all functions and dependencies. By adding OpenTelemetry instrumentation, they captured every invocation end-to-end. With CubeAPM:
- Real-time error tracking revealed that nearly 70% of failed checkouts were linked to Cosmos DB timeouts, not the functions themselves.
- The Errors Inbox made it obvious that malformed Service Bus messages were repeatedly retried, creating hidden load.
- Cold start dashboards highlighted the limitations of the Consumption plan under sudden traffic spikes, showing where latency came from.
Instead of piecing together disjointed logs, engineers had a single pane of glass correlating metrics, logs, and traces.
The Fixes Implemented
Armed with these insights, the team made targeted, high-impact changes:
- Optimized Cosmos DB queries with proper indexing, cutting response times and reducing timeouts.
- Migrated critical payment functions to the Premium plan with pre-warmed instances, eliminating cold-start delays during flash sales.
- Configured CubeAPM intelligent alerts to notify when DLQ size grew abnormally or when Cosmos DB latency crossed 200 ms. These alerts flowed directly into Slack, allowing on-call engineers to act immediately.
By tackling the root causes instead of chasing symptoms, they fixed systemic issues instead of firefighting every outage.
The Results
The transformation was dramatic and measurable:
- MTTR dropped by 60%, shrinking from hours to minutes. Engineers could identify the root cause of checkout issues almost instantly.
- Customer experience improved significantly, with fewer abandoned carts and smoother flash sales.
- Monitoring costs went down compared to Datadog and New Relic, thanks to CubeAPM’s smart sampling and predictable flat-rate pricing of $0.15/GB.
For this retailer, CubeAPM turned Azure Function monitoring from a reactive process into a proactive advantage, ensuring their most critical revenue-driving workflows stayed reliable even at peak scale.
Before vs After Monitoring Azure Functions with CubeAPM
| Aspect | Before CubeAPM (Legacy Monitoring) | After CubeAPM (Unified Observability) |
| Mean Time to Resolution | 3–4 hours to trace root cause | < 1 hour, reduced by 60% |
| Error Visibility | Fragmented logs in Azure Monitor & App Insights | Real-time error tracking with context + Errors Inbox |
| Cold Start Impact | Unpredictable latency under traffic spikes | Pre-warmed Premium plan tracked & optimized |
| DLQ Handling | Failures discovered late after retries | Intelligent alerts for DLQ backlog in Slack |
| Customer Experience | Frequent checkout failures and timeouts | Smoother checkouts, fewer abandoned carts |
| Monitoring Costs | Rising telemetry ingestion bills on Datadog | Predictable $0.15/GB pricing |
Verification Checklist & Example Alert Rules for Azure Monitoring with CubeAPM
Before you roll Azure Functions monitoring into production, it’s important to verify that the right telemetry is flowing, dashboards are accurate, and alerts are firing on meaningful signals. Here’s a practical checklist to guide you, plus sample alert rules you can adapt for your environment.
Verification Checklist
- Instrumentation with OpenTelemetry SDKs: Ensure all Azure Functions — whether HTTP, Event Grid, Service Bus, or Timer triggered — are instrumented with OpenTelemetry libraries. This guarantees you capture requests, traces, and exceptions with minimal overhead.
- CubeAPM Collector Deployment: Verify that the CubeAPM Collector is running in your Azure environment or BYOC setup. The collector should be securely forwarding telemetry while adhering to compliance requirements (GDPR, HIPAA, India DPDP).
- Dashboards for Core Metrics: Set up dashboards for invocation count, execution duration, error rate, cold start frequency, and DLQ backlog. These provide at-a-glance visibility into function health and scaling efficiency.
- Dependency Visibility: Confirm that traces include downstream calls (Cosmos DB, SQL, Blob Storage, or external APIs). This ensures you can pinpoint whether performance issues originate inside the function or in dependencies.
- Alert Rules in Place: Review that intelligent alerts are configured to notify on critical anomalies without overwhelming the team. Alerts should flow into collaboration channels like Slack or WhatsApp for immediate action.
Example Alert Rules
High Error Rate in Functions
This alert fires when more than 5% of function invocations fail over a 5-minute window. It helps you quickly identify widespread reliability issues.
- alert: AzureFunctionHighErrorRate
  expr: rate(function_invocation_errors_total[5m]) / rate(function_invocations_total[5m]) > 0.05
  for: 2m
  labels:
    severity: critical
  annotations:
description: "High error rate detected in Azure Functions (>5% failures)."Cold Start Surge
This alert tracks sudden increases in cold starts, which can degrade user-facing APIs. It’s useful for validating whether pre-warmed Premium instances are reducing latency.
- alert: AzureFunctionColdStarts
  expr: increase(function_cold_start_total[10m]) > 10
  for: 1m
  labels:
    severity: warning
  annotations:
description: "Unusual spike in cold starts for Azure Functions."Dead-Letter Queue Backlog
This rule detects when messages are accumulating in DLQs, a common sign of trigger failures or malformed events.
- alert: AzureFunctionDLQBacklog
  expr: azure_servicebus_deadletter_messages > 50
  for: 5m
  labels:
    severity: critical
  annotations:
description: "Dead-letter queue backlog detected — investigate function triggers or message schema."Cosmos DB Latency
Functions often rely on Cosmos DB; this alert fires when average query latency rises beyond 200 ms, which could cascade into timeouts.
- alert: CosmosDBLatencyHigh
  expr: avg_over_time(cosmosdb_query_latency_ms[5m]) > 200
  for: 2m
  labels:
    severity: warning
  annotations:
description: "Cosmos DB queries are slower than expected (>200ms)."Takeaway: A well-defined verification checklist ensures monitoring isn’t just set up — it’s reliable. Pairing that with clear alert rules gives engineering teams confidence that Azure Functions will remain performant, resilient, and cost-efficient under real-world conditions.
Conclusion
Azure Functions have become a critical part of modern cloud applications, enabling teams to scale quickly and build event-driven services without worrying about infrastructure. But their ephemeral nature, dependency on triggers, and sensitivity to latency make monitoring a necessity, not an option. Without the right observability in place, businesses risk downtime, hidden costs, and poor customer experiences.
CubeAPM delivers everything enterprises need for effective Azure Functions monitoring — unified telemetry that combines logs, metrics, and traces; real-time error tracking with full context; and intelligent alerting that cuts through noise. With smart sampling and BYOC compliance support, it ensures visibility at scale without ballooning costs. Teams using CubeAPM report faster issue resolution, lower monitoring spend, and more reliable serverless workloads.
If your organization runs on Azure Functions, now is the time to take monitoring seriously. Try CubeAPM today and see how it simplifies observability while giving you the confidence to scale serverless applications without limits.
Disclaimer: The information in this article reflects the latest details available at the time of publication and may change as technologies and products evolve.
FAQs
1. How do I enable monitoring for Azure Functions by default?
Azure Functions integrate natively with Azure Application Insights, which can be enabled directly from the Azure Portal. Once enabled, basic metrics (invocations, errors, execution time) are collected automatically, and you can extend this with OpenTelemetry for advanced monitoring.
2. Can I monitor Azure Functions across multiple regions?
Yes. Azure Monitor supports multi-region function monitoring, and with tools like CubeAPM, you can centralize telemetry from different regions into a single pane of glass. This helps detect performance differences caused by geography or regional service availability.
3. What’s the best way to monitor long-running Durable Functions?
Durable Functions add orchestration state and history tracking. For effective monitoring, you should track orchestration instance IDs, execution timelines, and custom events. CubeAPM integrates this telemetry so you can visualize workflow progress and identify stuck or compensating orchestrations quickly.
4. How do I secure telemetry data when monitoring Azure Functions?
Telemetry often includes sensitive request or payload data. Best practice is to use data masking and store telemetry in compliance with regulations like GDPR or HIPAA. CubeAPM helps by offering BYOC (Bring Your Own Cloud) hosting, ensuring telemetry data stays within your own environment.
5. Can I set custom business KPIs in Azure Function monitoring?
Absolutely. Beyond technical metrics, you can instrument custom KPIs such as “orders processed,” “failed payments,” or “messages consumed per minute.” These business-level metrics can be sent via OpenTelemetry and visualized in CubeAPM dashboards alongside technical telemetry for end-to-end observability.


