Zenoss excels at monitoring large, infrastructure-heavy environments with strong discovery and event correlation, but like many enterprise platforms, it comes with a steeper learning curve and costs that can rise as environments scale, making it less ideal for fast-moving DevOps teams.
CubeAPM is the best alternative to Zenoss, offering full-stack MELT observability with an OpenTelemetry-native design, setup in under an hour, predictable $0.15/GB pricing, and flexible self-host or BYOC deployments built for modern DevOps teams.
In this article, we’ll explore the top 8 Zenoss alternatives for 2025, comparing each across key criteria like OpenTelemetry support, MELT stack coverage, and deployment flexibility.
Top 8 Zenoss Alternatives
- CubeAPM
- SigNoz
- New Relic
- Honeycomb
- Datadog
- Dynatrace
- Sumo Logic
- Better Stack
Why Look for Zenoss Alternatives?
1. Steep Learning Curve
Zenoss is often described as complex and difficult to learn, especially for new users or those without prior experience. The system’s architecture, including its use of Zope and other components, can be opaque, making setup and maintenance challenging.
“Learning Curve, although it’s powerful, it can take time and experience to set up and take advantage of all its features. Cloud Dependence, cloud focus may not be ideal for organizations that prefer on-premises solutions.” (Capterra Review)
2. Complex setup and configuration
Some users report difficulties during ZenPack installation and initial configuration, noting that certain options are not easy to find. This can make setup and customization more time-consuming, especially for teams without deep platform experience.
“Some difficulties when installing Zenpack, some options are not so easy to find, I think it would help a lot if you exposed extensive documentation of the API” (Capterra Review)
Criteria for Suggesting Zenoss Alternatives
When evaluating replacements for Zenoss, we considered modern observability requirements that go beyond just infrastructure monitoring. The tools featured in this list were selected based on the following criteria:
1. Native OpenTelemetry (OTEL) Support
OpenTelemetry is now the industry standard for collecting traces, metrics, and logs in a vendor-neutral way. A strong Zenoss alternative must support OTEL natively — not via plugins or workarounds — to ensure seamless instrumentation, future compatibility, and flexibility in cloud-native environments.
2. Full MELT Stack Coverage
Modern teams need end-to-end visibility across Metrics, Events, Logs, and Traces (MELT). We prioritized tools that offer full-stack observability, including APM, infrastructure metrics, real user monitoring (RUM), synthetics, and log analysis — areas where Zenoss falls short.
3. Flexible Deployment Options
We focused on tools that offer modern deployment flexibility — from lightweight self-hosted options to scalable SaaS — with simpler setup and lower maintenance overhead.
4. Reliable Support & Documentation
Post-sales support matters. We evaluated how quickly vendors respond, whether they offer Slack or ticket-based support, and how comprehensive and current their documentation is. Zenoss, especially for non-enterprise users, has been flagged for limited support responsiveness and a reliance on outdated community forums.
Zenoss Overview

Known For
Zenoss is widely recognized for its infrastructure-centric monitoring, especially in on-premise and hybrid IT environments. It excels at SNMP-based device discovery, real-time event correlation, and topology-aware service modeling — making it a popular choice in industries like telecom, healthcare, and finance where legacy systems are common. However, its lack of modern observability features like tracing, RUM, and OTEL support makes it a poor fit for today’s cloud-native architectures.
Standout Features
- Dynamic Service Modeling: Maps service dependencies to enable root-cause diagnosis across complex infrastructure.
- Real-Time Event Correlation: Suppresses alert noise using context-aware filters and impact-based prioritization.
- Hybrid Monitoring Coverage: Tracks servers, VMs, cloud instances, and network gear from a unified dashboard.
Key Features
- SNMP and WMI-Based Monitoring: Monitors network devices, servers, and storage using SNMP/WMI — ideal for legacy-heavy IT environments.
- Topology Mapping & Dependency Visualization: Builds interactive maps of services and their infrastructure dependencies for quick impact analysis.
- Custom Event & Alert Rules: Supports flexible alerting logic based on event severity, custom thresholds, and correlation rules.
- ZenPacks Plugin Architecture: Extends core capabilities via modular ZenPacks — covering devices, protocols, and integration use cases.
- Service Impact Monitoring: Identifies business service disruptions by linking underlying infra issues to affected services in real-time.
Pros
- Excellent support for SNMP and WMI-based infrastructure monitoring
- Visual topology mapping with service impact modeling
- Modular plugin ecosystem (ZenPacks) for customization
- Supports on-prem deployments for compliance-sensitive industries
Cons
- Steep learning curve
- Complex configuration and setup
- Limited or unclear API documentation
Best For
Large enterprises managing complex on-prem or hybrid infrastructure, where deep SNMP-based monitoring and service impact modeling matter more than cloud-native telemetry or MELT observability.
Pricing & Customer Reviews
- Zenoss does not offer public pricing. Commercial offerings like Zenoss Cloud and Service Dynamics are available only through enterprise contracts.
- G2 Rating: Not listed on G2
- Positive feedback: Strong infra visibility, customizable topology views
- Negative feedback: Complex setup, steep learning curve, gaps in documentation
Top 8 Zenoss Alternatives
1. CubeAPM

Known For
CubeAPM is a next-generation observability solution designed for teams that require complete visibility, cost-efficient operations, and strict data compliance—all delivered through a native OpenTelemetry pipeline. Unlike traditional SaaS-only observability providers, CubeAPM supports both on-premise and cloud deployment, offering high throughput performance with transparent, usage-based pricing and no per-user fees.
Key Features
- Adaptive Smart Sampling: Uses contextual signals to prioritize meaningful traces—like latency spikes and errors—while intelligently filtering noise to control data volume and cost.
- Unified MELT Stack: Delivers seamless coverage across metrics, events, logs, and traces—with native support for real user monitoring (RUM) and synthetic testing built in.
- Instant Infrastructure Observability: Auto-collects host, container, and Kubernetes metrics out of the box—no third-party agents or add-ons needed.
- Flexible Hosting Models: Deploy on your infrastructure, cloud account, or air-gapped environments to meet HIPAA, GDPR, or local compliance requirements.
- Wide Integration Support: Over 800+ integrations. Works natively with OpenTelemetry, Prometheus, Elastic exporters, and Datadog agents—making it easy to plug into existing pipelines.
Standout Features
- Smart sampling engine filters noise while retaining high-priority spans
- Self-hosting model eliminates egress fees and ensures total control over data residency
- Predictable pricing with unlimited users and no surprise costs
- Migration utilities for Datadog, New Relic, and Uptrace make onboarding painless
- Slack-based support channel with a median response time under 5 minutes
Pros
- Up to 80% cost savings versus Datadog or New Relic
- Complete observability coverage, including APM, infra, logs, RUM, and synthetics
- No per-seat licensing—ideal for growing engineering teams
- Fast, expert support directly from the engineering team
- 800+ integrations
- No egress costs
Cons
- Not suited for teams looking for off-prem solutions
- Strictly an observability platform and does not support cloud security management
Best For
- Platform engineering and DevOps teams aiming to lower observability spend
- Organizations that need OpenTelemetry-first observability with localized data control
Pricing & Customer Reviews
- Pricing: Starts at $0.15 per GB of telemetry ingestion, with no charge per user
- G2 Rating: 4.8/5
CubeAPM vs Zenoss
Zenoss offers strong discovery and event correlation, but some users report challenges with setup and configuration, noting that ZenPack installation can be complex, certain options are hard to find, and API documentation could be more extensive. CubeAPM, in contrast, delivers full MELT observability built natively on OpenTelemetry, with fast setup (often under an hour), smart sampling, predictable $0.15/GB pricing, and flexible self-host or BYOC deployments, making it a simpler and more scalable alternative for modern DevOps teams.
2. SigNoz
Known For
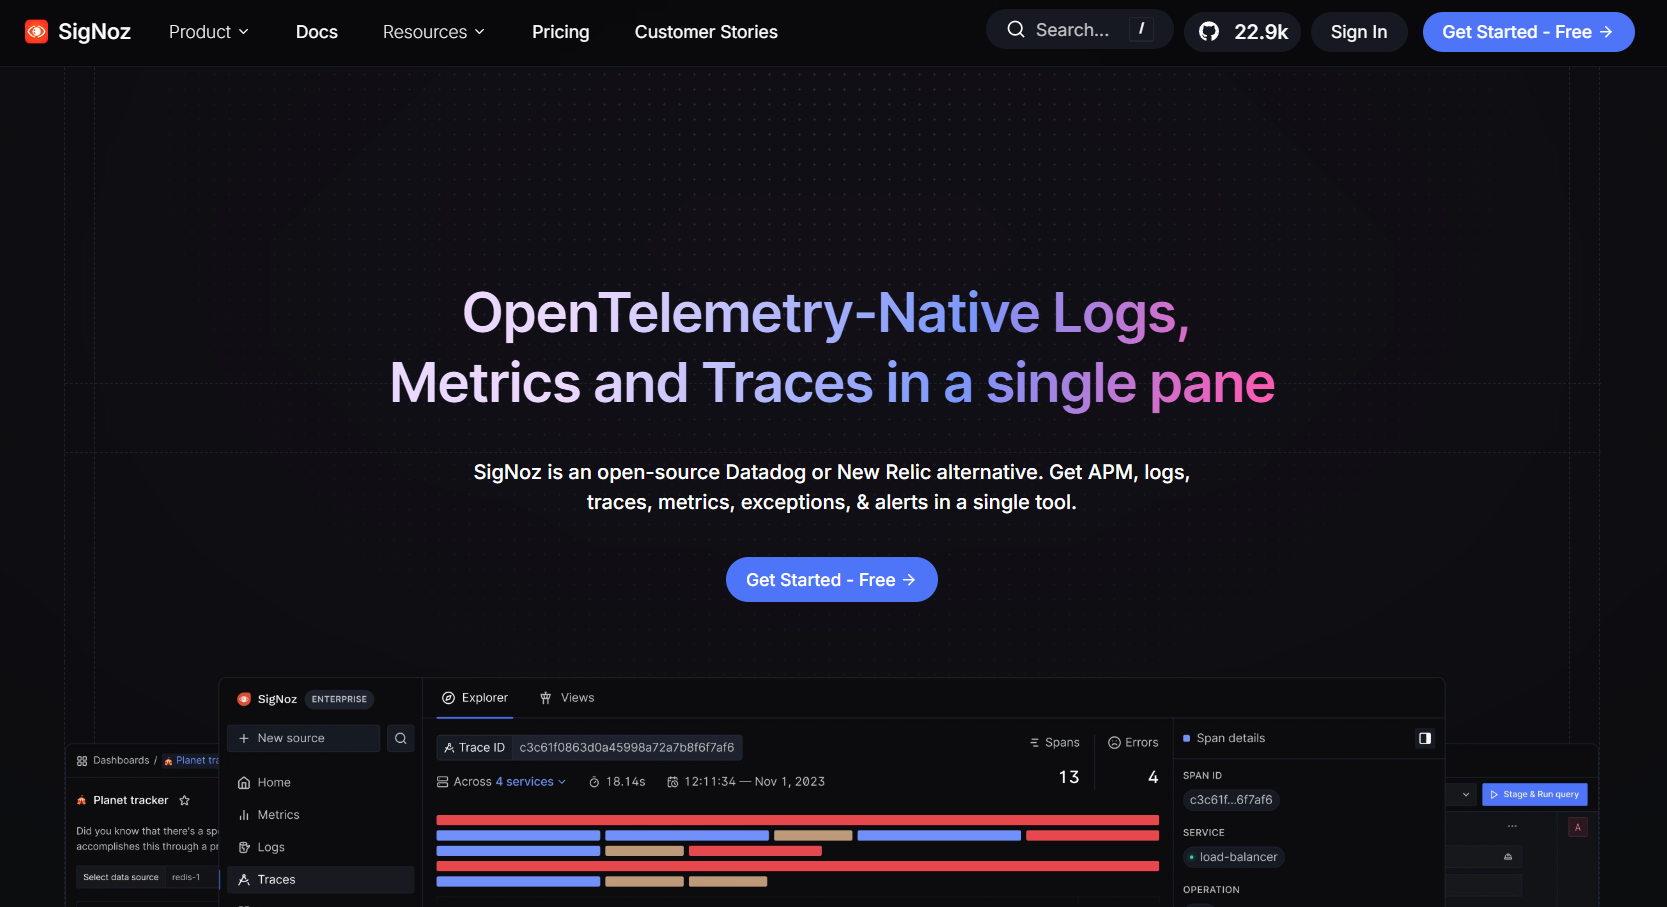
SigNoz is a developer-first observability platform that’s fully OpenTelemetry-native and built to deliver end-to-end MELT visibility—Metrics, Events, Logs, and Traces—without vendor lock-in. It’s particularly favored in the open-source community for its ClickHouse-powered analytics engine, Docker/Kubernetes-based self-hosting, and modern, intuitive UI. With support for both self-managed and hosted deployments, SigNoz enables teams to take control of their observability stack on their terms.
Key Features
- Built-In OpenTelemetry Support: SigNoz was developed from the ground up to support OpenTelemetry SDKs and exporters, making it easy to ingest standardized telemetry across distributed systems.
- Complete MELT Observability: Offers full coverage with distributed tracing, real-time infrastructure metrics, structured log ingestion, and event-driven alerting—all in one UI.
- Flexible Deployment Options: Teams can run SigNoz on Docker or Kubernetes using Helm charts. For ease of use, it also offers a managed cloud version with faster onboarding.
- Custom Dashboards & Querying: Built-in dashboards are extensible via ClickHouse’s SQL-like query interface, allowing fast data slicing and drill-down across telemetry.
Standout Features
- Transparent GitHub roadmap and open development
- ClickHouse backend for high-speed data analytics
- Centralized MELT view across logs, traces, and metrics
- Community support via Slack and open docs
- Tail-based sampling support through OTEL pipelines
Pros
- Native OTEL ingestion with zero vendor lock-in
- Backed by an active open-source community (20k+ GitHub stars)
- Smooth self-hosting setup via Docker or Helm
- All telemetry types visualized in a unified interface
- Cloud option available for quicker time-to-value
Cons
- Complex initial setup and configuration
- Self-hosting adds operational overhead when managing the ClickHouse backend
Best For
- SRE and DevOps teams building on open-source observability stacks
- Startups and SMBs seeking control over deployment and cost
- Engineering teams already using ClickHouse or Prometheus
Pricing & Customer Reviews
- Self-Hosted: Free to use (open-source)
- Cloud Plans: Begin at $49/month
- Logs: $0.30/GB ingested
- Traces: $0.30/GB ingested
- Rating: Not listed on G2
Users appreciate SigNoz’s modern design, self-hosting ease, and open-source model, though some report a steep learning curve and a complex setup.
SigNoz vs Zenoss
SigNoz is an open-source observability platform built natively on OpenTelemetry that unifies application metrics, logs, and traces in a single solution, with both free and paid deployment options available. Zenoss provides full-stack monitoring across hybrid IT environments, combining infrastructure metrics, automated discovery, and event management to support visibility across large and complex operational estates.
3. New Relic
Known For
New Relic is a SaaS-based observability platform offering unified visibility across applications, infrastructure, frontend performance, and more—all consolidated under a single dashboard. It’s widely recognized for its usage-based pricing model and the Telemetry Data Platform (TDP), which serves as a centralized hub for ingesting and analyzing telemetry data from OpenTelemetry, Prometheus, and New Relic’s own agents.
Key Features
- Full MELT Stack Monitoring: Covers everything from metrics and logs to distributed traces, RUM, synthetics, and error tracking—delivered in a cohesive, user-friendly interface.
- Telemetry Data Platform (TDP): Acts as the centralized engine for collecting, processing, and analyzing telemetry data—compatible with both first-party agents and open standards like OTEL.
- Custom Dashboards & NRQL: Advanced dashboarding powered by New Relic Query Language (NRQL), which allows real-time data slicing, custom alerts, and KPI visualizations.
- Frontend & Mobile Analytics: Tracks user behavior via real user monitoring (RUM) and provides SDKs for mobile telemetry across iOS and Android environments.
- Auto-Instrumentation & Integrations: Automatically detects services and infrastructure components, with built-in support for AWS, Kubernetes, Azure, and other popular platforms.
Standout Features
- Unified view of telemetry data across all layers of the stack
- Supports third-party ingestion via OpenTelemetry and Prometheus
- Built-in alerting, SLO tracking, and error insights
- Auto-instrumentation across multiple languages and frameworks
Pros
- Delivers full lifecycle visibility—from frontend UX to backend metrics and logs
- Supports both native and OpenTelemetry data sources
- RUM and synthetic testing included without requiring separate tools
- Customizable analytics through NRQL for tailored observability
Cons
- Usage-based pricing can scale up quickly with large data volumes
- Premium licenses are costly—full access starts at $349 per user/month
- UI can be overwhelming, especially for beginners
Best For
- Mid-sized and large organizations that want plug-and-play observability
- Teams comfortable with cloud-only platforms and variable pricing models
- Engineering orgs seeking a broad feature set with minimal setup time
Pricing & Customer Reviews
- Free Tier: 100GB/month ingested
- Pro plan: $0.40/GB ingested beyond the free 100GB limit
- Pro Plan: $349/user for full platform user
- G2 Rating: 4.4/5
- Customers value New Relic’s clean UI, broad telemetry coverage, and real-time dashboarding, but often express frustration with billing complexity, complex setup, and high cost when data volumes grow.
New Relic vs Zenoss
New Relic is a comprehensive, cloud-native observability platform that delivers deep application performance monitoring with traces, metrics, logs, real user monitoring, and synthetics, all in a unified view. Zenoss focuses on full-stack infrastructure and event monitoring across hybrid environments, offering automated discovery and correlated event management to support traditional IT operations.
4. Honeycomb
Known For
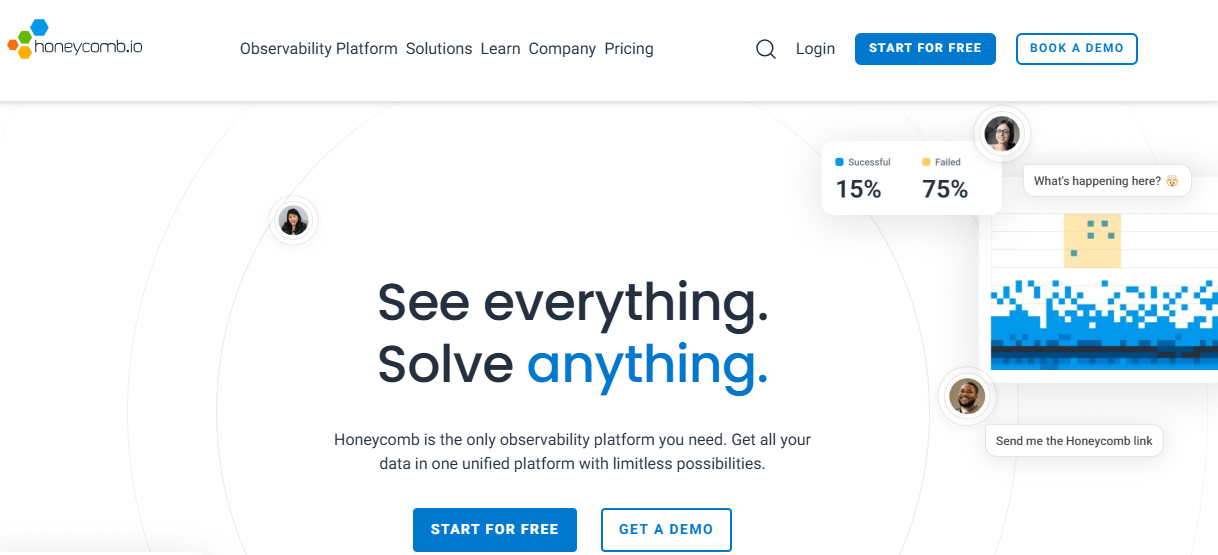
Honeycomb is a tracing-first observability platform purpose-built for debugging high-cardinality, distributed systems. It’s favored by engineering teams working with microservices, async patterns, or complex event flows. Honeycomb allows users to uncover subtle issues and behavioral patterns in production using rich visualizations and fast querying over millions of spans—making it ideal for root cause analysis at scale.
Standout Features
- Native OpenTelemetry Support: Offers direct integration with OTEL SDKs and collectors, enabling vendor-agnostic data ingestion and seamless deployment in modern telemetry pipelines.
- BubbleUp Debugging Interface: Automatically identifies outliers in high-cardinality fields—like user ID or region—highlighting anomalous values without requiring complex queries.
- Custom Columnar Query Engine: Built specifically for querying structured event telemetry at massive scale, Honeycomb delivers fast, interactive exploration—even across billions of spans.
- Tail-Based Sampling: Preserves valuable traces after completion, ensuring that rare events like latency spikes or edge-case failures are retained for analysis.
Key Features
- High-Cardinality Event Handling: Designed to process unique combinations of attributes—such as session IDs, request types, or deployment regions—without performance degradation.
- SQL-Like Query Builder: Lets users slice and filter span data with precision to investigate latency, errors, and behavioral trends in distributed applications.
- Service Maps & Span Explorer: Visual tools to navigate service call flows and deep-dive into individual spans and their associated metadata.
- Frontend SDK (RUM): Includes JavaScript-based real user monitoring SDKs, though manual instrumentation is required, and frontend UX metrics are not fully mature.
- Basic Alerts & SLO Features: Provides threshold-based alerting and basic SLO tracking, but not designed for operational alerting across full-stack metrics.
Pros
- Excellent performance when querying large-scale, high-cardinality telemetry
- Tail-based sampling ensures important trace data is preserved
- Ideal for microservices, asynchronous systems, and event-driven architectures
- Strong integration with OpenTelemetry pipelines and tools
Cons
- Users note that it is expensive as data volumes grow
- Limited quota management compels users to utilize additional tools for reporting
- Steep learning curve
Best For
- DevOps and SRE teams working in microservices environments with complex service interactions
- Organizations that already manage metrics/logs with separate tools but need best-in-class trace debugging
- Use cases involving event-based systems, queues, or high-cardinality telemetry fields
Pricing & Customer Reviews
- Free Tier: 20 million events/month
- Pro Tier: $130/month per 100 million events
- G2 Rating: 4.7/5
- Highly rated for speed, trace debugging power, and visual tools. However, many users flag the learning curve, limited features, such as quota management, as downsides.
Honeycomb vs Zenoss
Zenoss is rooted in infrastructure monitoring with SNMP and WMI, offering limited insight beyond host-level health and lacking support for traces or OTEL. Honeycomb is OTEL-native, lightning fast, and purpose-built for modern, cloud-native systems, whereas Zenoss is best suited for traditional infrastructure and legacy protocols. For teams focused on tracing-first observability with pinpoint precision, Honeycomb is a modern and technically superior alternative to Zenoss.
5. Datadog
Known For
Datadog is a widely adopted, SaaS-based observability platform built for cloud-native, enterprise, and DevOps teams. It’s recognized for its extensive ecosystem of integrations (900+) and unified visibility across logs, traces, metrics, infrastructure health, RUM, and security. Datadog provides centralized monitoring through a polished UI and excels in environments that demand breadth and scale over customization or control.
Key Features
- Infrastructure Monitoring at Scale: Provides real-time visibility into hosts, containers, and cloud services using lightweight agents and prebuilt dashboards—ideal for large-scale, multi-cloud deployments.
- Distributed Application Tracing (APM): Captures detailed service interactions and latency across internal APIs, databases, and external systems, enabling backend debugging and performance monitoring.
- Centralized Log Management: Enables structured log collection, full-text search, live tailing, and scanning of archived logs across distributed environments.
- Cloud Security Monitoring: Monitors workloads for vulnerabilities, access misconfigurations, and threats—integrated into the same observability control plane.
- Synthetic Monitoring & RUM: Includes browser-based user session tracking and synthetic test flows to simulate user behavior and measure performance.
Standout Features
- 900+ integrations, including AWS, Kubernetes, Azure, GitHub, Jenkins, and more
- “Watchdog” AI system detects latency shifts, anomalies, and regressions automatically
- Unified platform for monitoring infrastructure, apps, security, and frontend
- Proven scalability for large, globally distributed organizations
Pros
- Comprehensive coverage across logs, metrics, traces, RUM, and security
- Quick to deploy with prebuilt dashboards and intelligent alerts
- Highly integrated with cloud services and DevOps pipelines
- Reliable performance and scalability for large infrastructures
Cons
- Pricing becomes unpredictable and expensive as data volume increases
- Many users report complex billing, overages, and an opaque pricing structure
- Steep learning curve for begineers impacting onboarding
Best For
- Large enterprises seeking a centralized, all-in-one observability solution
- Teams operating in multi-cloud or microservice-heavy architectures
- Organizations needing rich integrations and advanced dashboards out of the box
Pricing & Customer Reviews
- Infrastructure Monitoring (Pro Plan): $15/host/month
- APM (Pro Plan): $35/host/month
- Logs: $0.10/per ingested GB/month
- G2 Rating: 4.4/5
- Datadog is consistently praised for its interface, breadth of features, and scalability. However, user reviews frequently cite billing complexity, unexpected cost spikes, and lack of transparent pricing as key concerns.
Datadog vs Zenoss
Datadog is a cloud-native observability platform that provides unified metrics, logs, traces, real user monitoring, synthetics, and APM with rich dashboards and alerting designed for dynamic, distributed systems. Zenoss focuses on full-stack infrastructure and event monitoring across hybrid environments, with automated discovery and correlated event management to support IT operations at scale.
6. Dynatrace
Known For
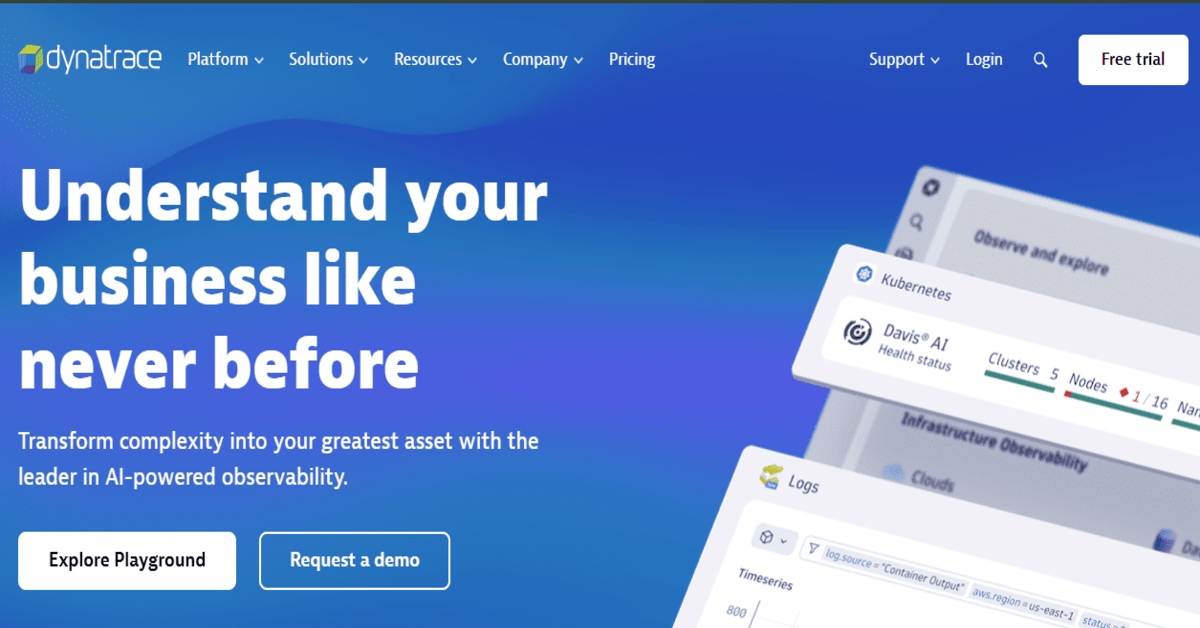
Dynatrace is an enterprise-grade observability and automation platform built to monitor highly dynamic, large-scale environments. It stands out for its AI-driven root cause analysis, automatic topology mapping, and real-time anomaly detection. Enterprises running expansive hybrid or multicloud infrastructures often choose Dynatrace for its autonomous operations and breadth of coverage across the application stack.
Key Features
- Davis® AI Engine: Dynatrace’s built-in AI assistant proactively surfaces anomalies, correlates events across layers, and pinpoints root causes—without relying on user-defined rules or thresholds.
- End-to-End Visibility: Covers every layer of the stack—from infrastructure and backend services to frontend performance and third-party APIs—complete with RUM and synthetic capabilities.
- Automated Service & Dependency Discovery: Automatically maps applications, containers, services, and communication flows in real time—reducing manual setup and configuration.
- Integrated Log Analytics: Brings log data into the same view as traces and metrics, enabling context-rich troubleshooting and time-saving analysis.
- Code-Level Observability: Delivers detailed diagnostics into application runtime, covering JVM, .NET, Node.js, and other environments—ideal for performance tuning.
Standout Features
- Full MELT stack observability with automated correlation
- No manual instrumentation—autodiscovery handles topology, dependencies, and services
- Business KPIs can be linked directly to technical telemetry for impact analysis
- Built-in application security analysis detects vulnerabilities alongside performance issues
Pros
- Proactive issue detection with real-time anomaly alerts
- Rich diagnostics and deep tracing ideal for large enterprises
- Works well across hybrid, multicloud, and containerized environments
- Ties technical metrics to business outcomes for cross-functional visibility
Cons
- High pricing, especially when security features and advanced analytics are included
- Steep learning curve
- Complex initial setup
Best For
- Large organizations managing thousands of services and seeking full-stack automation
- Teams that need not only observability but also root cause insights without manual tuning
Pricing & Customer Reviews
- Infrastructure Monitoring: $29/month per host
- Full-Stack Monitoring: $58/month per 8 GiB host
- G2 Rating: 4.4/5
- Users consistently commend Dynatrace for its autonomous capabilities, diagnostic accuracy, and breadth of coverage, though concerns about pricing rigidity and learning curve are often noted.
Dynatrace vs Zenoss
Dynatrace provides broad observability across applications, services, and infrastructure, with deep application performance monitoring, distributed tracing, real user monitoring, and automated dependency mapping designed for complex, cloud-native environments. Zenoss focuses on full-stack monitoring across hybrid IT environments, combining infrastructure metrics, automated discovery, and event management to support operational visibility at scale.
7. Sumo Logic

Known For
Sumo Logic is a cloud-native observability and log analytics platform best known for its real-time data ingestion, searchable dashboards, and security integrations. It’s widely used for centralized log analysis, infrastructure monitoring, and SIEM capabilities, with out-of-the-box support for a broad range of data sources and cloud-native workloads. Designed for speed and scalability, Sumo Logic offers ingestion pipelines tailored to logs, metrics, and events, though its APM and tracing capabilities are still catching up to full MELT standards.
Key Features
- Live Log Streaming & Search: Ingests massive volumes of structured and unstructured log data with support for live tailing, index-based querying, and pattern recognition.
- Out-of-the-Box Integrations: Offers native connectors for AWS, Kubernetes, GCP, Azure, and common app stacks—enabling fast onboarding of telemetry pipelines.
- Custom Alerting & Dashboards: Includes powerful visualizations, scheduled searches, and real-time alert generation based on threshold or anomaly-based logic.
- Security & Compliance Monitoring: Combines observability with SIEM capabilities, helping teams meet auditing, vulnerability, and regulatory reporting needs.
Standout Features
- Real-time log ingestion and flexible querying engine
- Integrated threat detection and compliance frameworks
- Multi-cloud visibility with automated alert workflows
- Security analytics and observability data in a shared UI
- Generous free tier for early-stage teams
Pros
- Fast time-to-value with plug-and-play integrations
- Strong log processing and security analytics combo
- Well-suited for teams that prioritize compliance and SIEM alongside observability
- Scales well for log-dominant workloads
- Hosted, maintenance-free SaaS model
Cons
- Pricing is based on daily ingest + scan frequency, making costs unpredictable at scale
- It can become expensive at high data volumes
- Steeper learning curve for advanced functions
Best For
- Teams with log-heavy observability needs and basic infrastructure monitoring
- Organizations that need SIEM + observability in one platform
- Compliance-driven environments that benefit from prebuilt security frameworks
Pricing & Customer Reviews
- Starts around $3.14 per TB scanned
- G2 Rating: 4.3/5
- Customers frequently commend Sumo Logic’s log ingestion speed, and search flexibility but criticize its pricing complexity, limited APM coverage, and lack of OTEL-native support.
Sumo Logic vs Zenoss
Sumo Logic is a cloud-native analytics and observability platform that centralizes logs, metrics, and events with built-in security and compliance analytics for modern environments. Zenoss focuses on full-stack monitoring across hybrid IT environments, with infrastructure metrics, automated discovery, and event management to support operational visibility.
8. Better Stack

Known For
Better Stack (formerly Better Uptime) combines incident management, log ingestion, and uptime monitoring into a sleek, developer-friendly platform. It’s a go-to solution for engineering teams looking for quick setup, clean dashboards, and integrated alerting—without the overhead of traditional APM or observability suites. Designed for simplicity and clarity, Better Stack targets teams focused on website monitoring, API uptime, and basic log analysis rather than deep tracing or infrastructure introspection.
Key Features
- Website & API Monitoring: Continuously monitors endpoints via HTTP, ping, SSL, and port checks—complete with custom alerting policies and global checks.
- Built-In Log Management: Offers real-time structured log ingestion with filtering and querying using a fast, SQL-like syntax—ideal for debugging app-level logs.
- Incident Response & Escalation: Features status pages, on-call scheduling, multi-channel alerting (Slack, email, Teams), and automated escalation rules.
- Visual Dashboards: Provides elegant, markdown-supported dashboards for internal teams or public status updates—customizable with branding and uptime metrics.
- Dev-Centric Workflow Support: YAML-based config, Git integration, and Terraform support make it easy to version and manage alert rules as code.
Standout Features
- Exceptionally fast and user-friendly onboarding
- Combines uptime checks, incident management, and logging into one product
- Public and private status pages for transparency and stakeholder updates
- Built-in alert routing and escalation without external tooling
- Free plan with generous usage limits
Pros
- Extremely simple setup—minimal effort required
- Well-suited for frontend teams, websites, and API reliability
- Combines several lightweight tools (logs, uptime, alerts) into a single UI
- Affordable plans for startups and solo developers
- Excellent design and UX
Cons
- Expensive for startups and smaller teams
- Users have noted missing features such as outgoing webhooks
- Users have find the initial setup to be complex
Best For
- Solo devs, early-stage startups, and frontend teams that want simple uptime and log tools
- Teams replacing multiple single-purpose tools (e.g., Pingdom + basic logging)
- Organizations focused on status transparency and fast incident response
Pricing & Customer Reviews
- Free tier: Includes 10 monitors, 1 static page, 3 GB logs (3-day), 2B metrics points (30-day), 1 or more responders using Slack/phone/SMS.
- Paid plans: Start at $29/user/month, including one responder license and unlimited users, with bundles for telemetry and incident capabilities.
- Enterprise: Custom pricing for higher scale and SAML/SCIM support
- G2 Rating: 4.6/5
- Users love Better Stack’s interface, setup speed, and pricing clarity, but often mention its limited telemetry depth and lack of backend observability as trade-offs.
Better Stack vs Zenoss
BetterStack is a cloud-first monitoring and incident response suite focused on uptime checks, alerting, and lightweight observability for modern development teams. Zenoss provides full-stack monitoring across hybrid IT environments, with infrastructure metrics, automated discovery, and event management to support operational visibility in larger and more complex estates.
Conclusion: Choosing the Right Zenoss Alternative
CubeAPM is the best alternative to Zenoss. It offers end-to-end observability across traces, logs, metrics, RUM, and synthetics, all within an OpenTelemetry-native architecture. With flexible self-hosted deployment, smart sampling, and flat-rate pricing starting at $0.15/GB, CubeAPM enables teams to reduce observability costs by up to 80%—while keeping full control over their data. Its fast, developer-friendly UI and responsive Slack-based support make it a standout for teams of all sizes.
Whether you’re moving on from Zenoss due to missing APM capabilities, compliance limitations, or the need for modern, unified visibility, CubeAPM provides a powerful, future-ready alternative that’s built for scale, control, and efficiency.
Disclaimer: The information in this article reflects the latest details available at the time of publication and may change as technologies and products evolve
FAQs
1. Why are teams moving away from Zenoss?
Many teams are shifting from Zenoss due to its lack of native OpenTelemetry support, limited APM and RUM capabilities, and high resource requirements. Additionally, with the discontinuation of Zenoss Core (its open-source edition) and no support for full MELT observability, Zenoss is no longer a fit for modern DevOps and cloud-native environments.
2. What features should I look for in a Zenoss alternative?
A strong Zenoss replacement should offer native OpenTelemetry support, full MELT stack coverage (metrics, events, logs, traces), smart sampling, transparent pricing, and flexible deployment (cloud or self-hosted). Tools like CubeAPM, SigNoz, and Dynatrace stand out in these areas.
3. Which Zenoss alternatives offer better cost control?
Platforms like CubeAPM provide flat, usage-based pricing with no per-user fees—helping teams achieve 60–80% cost savings over traditional vendors. In contrast, Zenoss has opaque enterprise contracts and can become costly to scale, especially in large environments.
4. Can I find a self-hosted alternative to Zenoss?
Yes. Tools like CubeAPM, SigNoz, and Coralogix (BYOC model) offer self-hosting or bring-your-own-cloud options. These solutions give you greater control over data residency and compliance, which Zenoss supported historically but lacks in modern telemetry capabilities.
5. Which Zenoss alternative is best for OpenTelemetry-based observability?
CubeAPM is purpose-built for OpenTelemetry-native observability. It supports full MELT coverage, smart sampling, and flexible hosting, making it ideal for teams transitioning from legacy systems like Zenoss to modern, vendor-neutral observability pipelines.


