Dynatrace is a popular observability platform offers application performance monitoring (APM), infrastructure monitoring, real user monitoring, and more. Thanks to its Davis AI Engine, it offers excellent root cause analysis and its end-to-end digital experience monitoring, topology mapping, and enterprise readiness are worth investing in.
However, Dynatrace’s great power comes at a hefty price tag, complex setups for advanced needs, and a learning curve (particularly for beginners). CubeAPM, one of the best alternatives to Dynatrace, solves these problems with a simpler ingestion-based pricing of $0.15/GB and ease of setup and use for beginners and experienced alike.
This article talks about 7 Dynatrace alternatives and compares them based on pricing, key features, pros and cons, and online reviews.
Top 7 Dynatrace Alternatives
- CubeAPM
- New Relic
- Datadog
- Splunk Appdynamics
- Grafana
- Coralogix
- Sentry
Comparison Table
| Tool | * Pricing (Small, Mid, Large) | OTel Native | Support TAT | Self-Hosting |
| CubeAPM | Small: $2,080; Mid: $7,200; Large: $15,200 | Yes | Within minutes | Yes |
| Dynatrace | Small: $7,740; Mid: $21,850; Large: $46,000 | Yes | 4 hrs. to days | Yes |
| New Relic | Small: $9,366; Mid: $32,115; Large: $70,220 | Yes | 1 hr. to 2 days | No |
| Datadog | Small: $8,185; Mid: $27,475; Large: $59,050 | Yes | <2-48 hrs | No |
| Splunk Appdynamics | Small: $2,290; Mid: $8,625; Large: $17,750 | Yes | in hours | Yes |
| Grafana Cloud | Small: $3,870; Mid: $11,875; Large: $26,750 | Yes | in hours | Yes |
| Coralogix | Small: $4,090; Mid: $13,200; Large: $29,000 | Yes | min to hrs | No |
| Sentry | Small: $3,560; Mid: $12,100; Large: $32,400 | Yes | hrs. to days | Yes |
*All pricing comparisons are calculated using standardized Small/Medium/Large team profiles defined in our internal benchmarking sheet, based on fixed log, metrics, trace, and retention assumptions. Actual pricing may vary by usage, region, and plan structure. Please confirm current pricing with each vendor.
Why Look for Dynatrace Alternatives?
Dynatrace is undeniably powerful for large enterprises looking for monitoring at scale. But once you peek under the hood (and your monthly bill), many teams start questioning their choices.
Here’s what a user has to say about Dynatrace on Reddit:
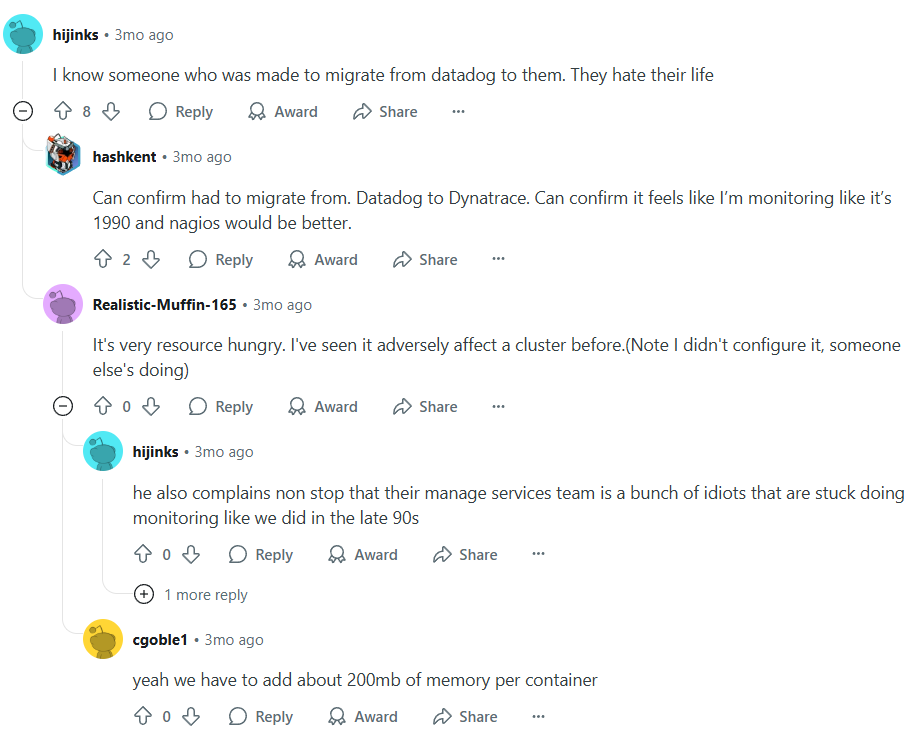
Let’s talk about some real pain points teams face, the reasons why they are looking for Dynatrace alternatives:
Cost Complexity
Dynatrace uses the Davis Data Units (DDUs) to price its services. Predicting the cost becomes difficult, especially if you’ve extensive monitoring requirements. Their pricing also doesn’t go hand-in-hand with usage patterns as your infrastructure and data volume scale. Smaller organizations with fewer monitoring needs may end up paying more for unused service.
Learning Curve
Dynatrace offers plenty of features and options, which are useful for larger teams. But too many options may overwhelm smaller teams with limited technical expertise. Plus, Dynatrace’s advanced customizations and configurations have a steep learning curve. Your team may need training and more time to understand and use certain functionalities. This adds to the complexity and cost. Users on G2 have expressed their concerns over the steep learning curve associated with Dynatrace.
Criteria for Suggesting Dynatrace Alternatives
When evaluating Dynatrace alternatives, we’ve considered the following criteria, mapped to common decision triggers among engineering and platform teams:
- MELT coverage: Unified support for Metrics, Events, Logs, and Traces (MELT) to ensure full visibility across stack layers.
- Open standards compatibility: Native support for OpenTelemetry, Prometheus, and standard agents to reduce lock-in and enable ecosystem flexibility.
- Smart sampling & retention control: Ability to retain high-signal traces and discard noise, minimizing ingestion/storage costs.
- Ease of migration: Agent compatibility with New Relic, Datadog, or Dynatrace for fast, low-friction transitions.
- Self-hosting / data residency: Ability to run observability on-prem or in-region to comply with data localization regulations.
- Cost predictability: Flat or usage-transparent pricing that avoids per-GB surprises or credit-based complexity (like DDUs).
- Performance & support: Low-latency UI, fast query response, and reliable support via channels like Slack, not just email tickets.
Dynatrace Overview
Known For
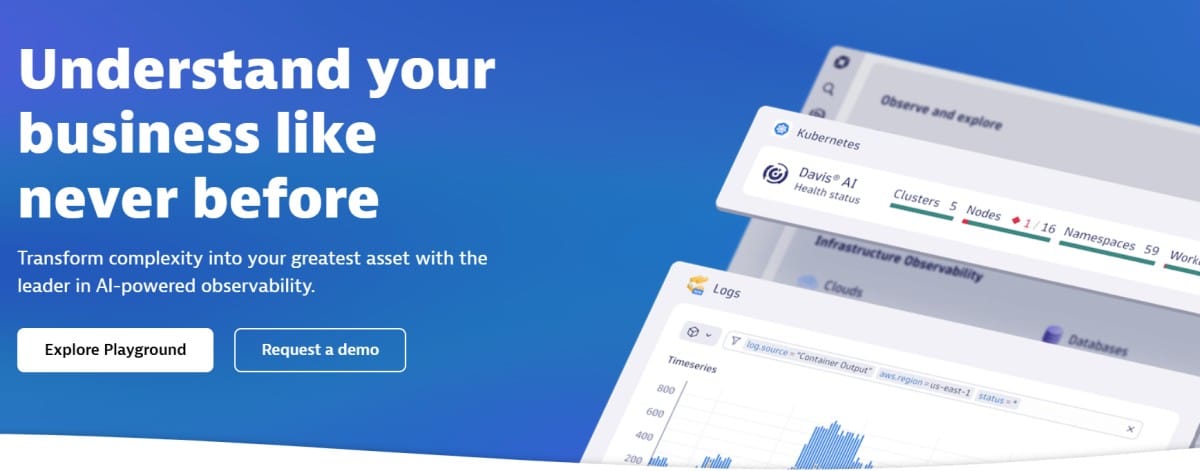
Enterprise-grade full-stack observability platform powered by Davis AI, Dynatrace is designed to automate root cause detection, infrastructure monitoring, digital experience analytics, and APM. It excels in large-scale environments where performance intelligence, automation, and application security must converge.
Standout Features
- Davis AI engine: Dynatrace’s most defining capability, Davis AI, continuously analyzes billions of dependencies in real time to automatically surface root causes of performance issues, reducing alert fatigue and manual triage.
- Smartscape topology mapping: Automatically builds real-time, dependency-aware topology maps across services, hosts, containers, and applications—critical for understanding complex distributed environments.
- Full-stack + runtime application security: Unlike traditional APMs, Dynatrace combines observability with real-time runtime application protection (RASP), enabling full DevSecOps workflows from a single pane.
- End-to-end DEM (Digital Experience Monitoring): Combines Real User Monitoring (RUM) and synthetic tests to provide visibility into frontend user experience, web performance, and user behavior analytics.
Key Features
- Unified APM, infrastructure, logs, and user experience monitoring
- Auto-instrumentation across K8s, serverless, VMs, and containers
- Runtime code-level tracing with JVM, .NET, PHP, and Node.js support
- Real-time security alerts for vulnerabilities in production apps
- AI-driven alert correlation and problem detection
- Support for cloud-native environments: AWS, GCP, Azure
- Real User Monitoring (RUM) and built-in synthetic browser checks
Pros
- Comprehensive end-to-end coverage, from infrastructure to frontend, Dynatrace unifies metrics, traces, and logs.
- Highly automated with AI root cause analysis and Smartscape topology reduce manual debugging.
- Strong enterprise readiness with built-in support for governance, RBAC, SAML, and multi-team observability.
- Integrated app security and runtime vulnerability scanning.
Cons
- Pricing is complex and often unpredictable
- Learning curve for new users, with feature depth and Smartscape’s automation
Best For
Large-scale enterprises and mature platform teams that prioritize automated diagnostics, integrated application security, and full-stack performance insights across dynamic cloud environments.
Pricing & Customer Reviews
- Pricing: Dynatrace charges based on Davis Data Units (DDUs), which represent data ingestion, retention, monitoring activity, and API usage. Full-stack monitoring: $0.08 per hour per 8 GB host. A single host may consume 10K–50K DDUs/month, depending on trace/log usage.
- G2 Rating: 4.5/5 (based on 1,333+ reviews)
- Praised for: automation, AI insights, enterprise readiness
- Criticized for: Limited pricing transparency, steep learning curve
Top 7 Dynatrace Alternatives
1. CubeAPM
Known For
CubeAPM is an OpenTelemetry-native, cost-efficient observability platform purpose-built for modern engineering teams that need full-stack visibility without the operational burden or pricing complexity of legacy APM tools.
Designed for cloud-native, privacy-conscious, and compliance-driven organizations, CubeAPM delivers high-fidelity observability across applications, infrastructure, and user experience, while reducing telemetry costs by up to 80%. It is the ideal alternative for teams looking to escape vendor lock-in, gain data residency control, and simplify observability at scale.
Standout Features
Smart Sampling Engine
CubeAPM’s context-aware sampling intelligently prioritizes the retention of slow, error-prone, or anomalous traces while discarding low-signal noise. This ensures developers get the critical insights they need without drowning in data volume.
Unlike platforms that rely on static head-based sampling (e.g., Sentry, Datadog), CubeAPM’s smart sampling is tuned for latency, error rates, and contextual relevance, helping teams achieve 60–80% cost savings on ingestion and storage.
Self-Hosted & Privacy-First Deployment
CubeAPM supports cloud, on-premise, or private VPC deployments, giving teams full control over their observability data. This is especially valuable for organizations bound by GDPR, India’s DPDP Act, HIPAA, SOC 2, or internal compliance requirements.
Unlike Dynatrace or New Relic—which offer limited self-hosting in high tiers—CubeAPM enables you to run your entire observability stack wherever your infrastructure lives.
Agent Compatibility & One-Hour Migration
CubeAPM is plug-and-play compatible with agents from New Relic, Datadog, Prometheus, and Elastic. This drastically reduces migration friction, allowing most teams to deploy and begin ingesting data in under one hour without re-instrumenting every service. For fast-moving teams, this translates to minimal downtime and instant time-to-value.
Real-Time Developer Support
Where traditional vendors rely on slow, ticket-based support models, CubeAPM provides direct access to its engineering team via Slack and WhatsApp. This ensures incident triage, troubleshooting, and performance issues are addressed in minutes, not days, making it uniquely appealing to dev-first organizations operating with lean SRE resources.
Key Features
- Full MELT stack coverage: Supports Metrics, Events, Logs, Traces, Synthetics, Real User Monitoring (RUM), and Error Tracking—out-of-the-box and unified.
- Cost transparency: Ingest cost is $0.15/GB, which is highly cost-efficient without any ingress charges.
- OpenTelemetry & Prometheus native: Built on OpenTelemetry from day one. Supports direct ingestion of OTEL and Prometheus formats.
- Kubernetes & cloud monitoring: Full visibility into Kubernetes clusters, workloads, and infrastructure. Works with AWS and GCP natively.
- Lightweight setup & UX: Minimal onboarding with prebuilt dashboards and no NRQL/DSL requirement. UX optimized for speed and clarity.
- Privacy & data compliance: Ideal for teams needing data stored inside their infrastructure, compliant with localization laws.
- Flexible alerting: Supports error inbox, Slack/webhook notifications, and latency/error-based alerting. No-code setup for alert routing.
Pros
- 60–80% cheaper than incumbents like Dynatrace or Datadog
- Smart sampling reduces data overload without losing insight
- Fast setup; compatible with existing agents
- Self-hosting and on-prem support for compliance-heavy industries
- Real-time developer support (Slack, WhatsApp)
- Clean UI with zero-setup dashboards
Cons
- An observability-focused tool with no built-in cloud security management capabilities
- may not suit teams looking for off-prem solutions
Best for
Startups, mid-sized engineering teams, or regulated industries seeking scalable observability with predictable pricing and high compliance.
Pricing & Customer Reviews
- Pricing: $0.15.GB of ingested data
- G2 Score: 4.7/5
- Praised for: Cost efficiency, fast onboarding, smart sampling
CubeAPM vs Dynatrace
While Dynatrace offers deep AI-powered observability and enterprise-scale Smartscape topology, it comes with complex pricing (based on Davis Data Units) and a steep learning curve.
For teams seeking cost control, compliance, and open standards, CubeAPM provides a compelling alternative. With smart sampling, predictable pricing, and OpenTelemetry-native architecture, CubeAPM delivers full MELT observability and modern alerting at 60–80% lower cost, without sacrificing performance or signal quality. It’s also deployable on-prem, making it ideal for privacy-first and regulated environments.
2. Datadog
Known For
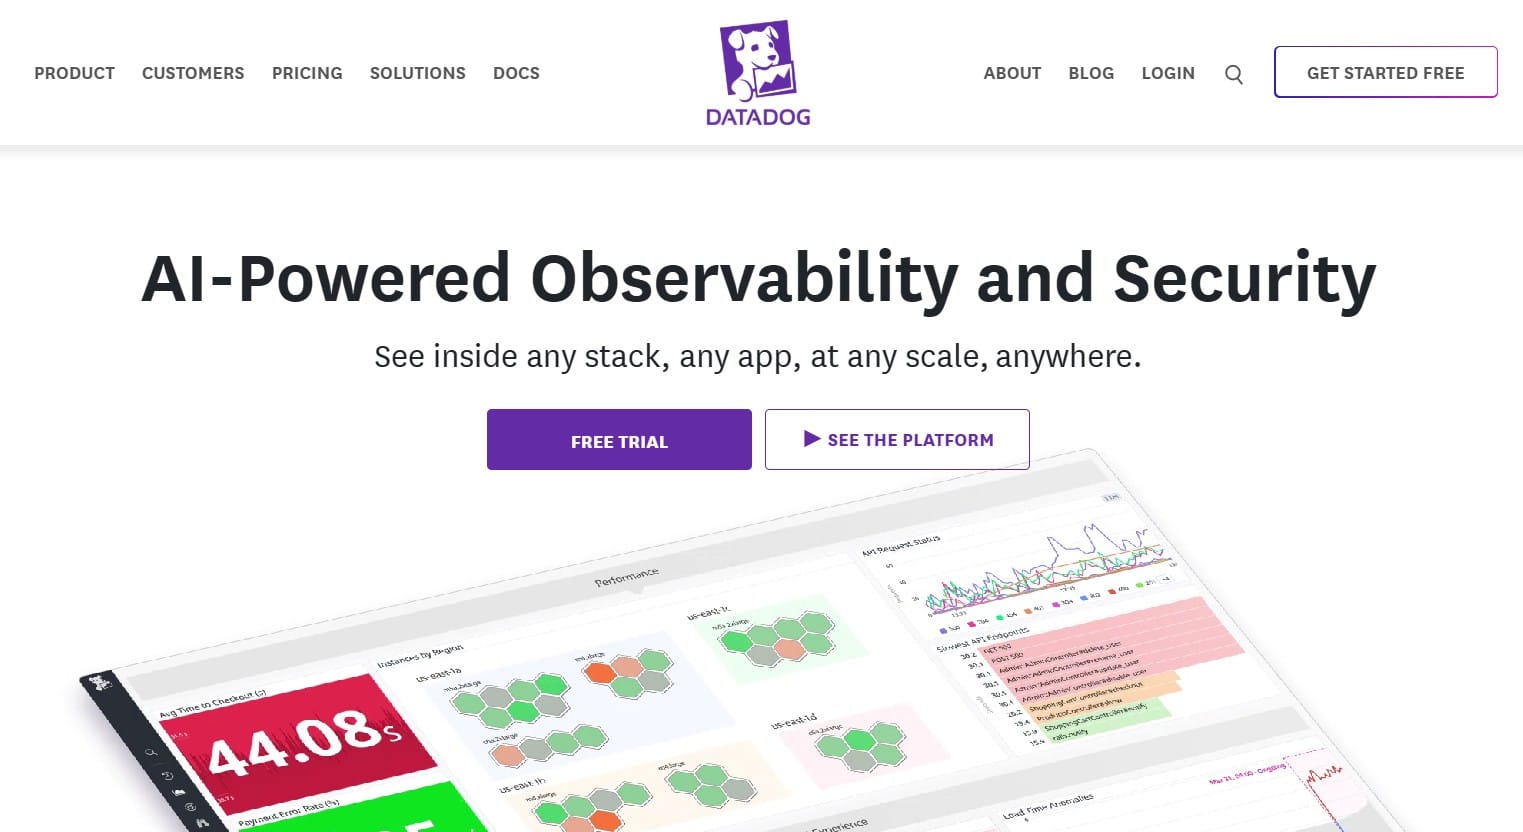
Comprehensive cloud-native observability suite with powerful integrations, real-time dashboards, and extensive support for infrastructure, logs, security, and APM—all in one SaaS platform.
Standout Features
- Massive integration ecosystem: Datadog integrates with over 900+ tools across cloud platforms, databases, web frameworks, containers, CI/CD pipelines, and more, making it a go-to for heterogeneous environments.
- Live dashboards & notebooks: Real-time visualizations with drag-and-drop dashboards, anomaly detection, and collaborative Notebooks for root cause analysis.
- Unified platform for observability + security: Combines infrastructure metrics, logs, traces, RUM, and synthetics.
- CI visibility & deployment tracking: Full DevOps lifecycle support with deployment markers, test coverage, and GitOps analytics.
Key Features
- Full-stack MELT monitoring: Offers Metrics, Events, Logs, and Traces across infrastructure, containers, services, and end-user experiences
- Security & compliance modules: Built-in Cloud Workload Security, CSPM, and Threat Detection for DevSecOps teams
- Real User Monitoring & synthetics: Monitors frontend performance with session replays and API/browser tests.
- Auto instrumentation & language support: Supports Go, Java, Node.js, Python, .NET, PHP, and more with deep auto-instrumentation
- Collaboration & incident management: Integration with Slack, PagerDuty, and Jira; supports monitors, alerts, dashboards, and runbooks.
- Cloud-native integration: Strong AWS, GCP, and Azure coverage, including Lambda, EKS, ECS, and serverless performance insights.
- Notebooks & analytics: Collaboration-friendly Notebooks combine logs, traces, and dashboards into a single analysis workflow.
Pros
- Extensive integration ecosystem (900+ integrations)
- Deep coverage of modern infrastructure and DevOps workflows
- Combined observability and security in one product
- Fast, real-time dashboards with anomaly detection
- Scalable for large, multi-cloud environments
Cons
- High cost based on per-host, per-GB ingest, custom metrics, and retention
- No self-hosted option; only SaaS
Best For
Enterprises and engineering orgs that prioritize a tightly integrated, all-in-one SaaS observability platform with security add-ons, and are comfortable with usage-based pricing.
Pricing & Customer Reviews
- Pricing: Infrastructure: $15/host/month; APM: $31/host/month (when billed annually); Logs: $0.10/GB
- G2 Rating: 4.4/5 (631 reviews)
- Praised for: integration depth, UI responsiveness, built-in security
- Criticized for: pricing complexity, no self-hosting
Datadog vs Dynatrace
Datadog and Dynatrace both offer enterprise-grade observability, but their strengths diverge. Datadog is integration-first, supporting 600+ tools across the DevOps stack, while Dynatrace emphasizes AI-powered automation with its Davis engine.
However, Datadog’s pricing complexity—with charges across hosts, metrics, and dashboards—often leads to cost unpredictability, as highlighted by Signoz’s pricing breakdown. Dynatrace, though equally premium, offers more native topology mapping and root cause insights, but is locked into a proprietary agent model.
3. New Relic
Known For
New Relic is known for flexible full-stack observability with deep dashboards, NRQL query language, and strong support for custom metrics and developer analytics.
Standout Features
- NRQL (New Relic Query Language): A powerful SQL-like query language that enables custom telemetry exploration, alerting, and dashboard creation across metrics, logs, and traces.
- Explorer view & entity-based monitoring: Visualizes dependencies across services, infrastructure, and Kubernetes in real-time—useful for microservice-heavy environments.
- Lookout AI: A machine-learning-powered feature that auto-detects anomalies across your MELT stack without manual configuration.
- Programmable Dashboards: Highly customizable visualizations for SLOs, MTTR, system health, and anomaly trends using prebuilt widgets or code.
Key Features
- Full MELT observability: Unified Metrics, Events, Logs, and Traces within a single UI, with prebuilt views for application, infra, and end-user layers.
- Language & framework instrumentation: Agents for Java, Node.js, Python, Ruby, Go, .NET, and PHP. Supports distributed tracing, profiling, and error tracking.
- OpenTelemetry & Prometheus support: Supports OTEL and Prometheus, though not as natively as OTEL-first platforms like CubeAPM.
- Real user & synthetic monitoring: Track frontend performance and simulate user journeys across global regions.
- Alerting & incident management: Supports anomaly detection, multi-condition alerts, and integrations with Slack, PagerDuty, Jira, and ServiceNow.
- Dashboards & NRQL analytics: Offers real-time and historical visualizations using advanced queries, ideal for data-heavy SRE and DevOps teams.
- Cloud integration: Connects with AWS, Azure, and GCP for host, service, and Kubernetes-level observability.
Pros
- Rich and flexible dashboards with real-time views
- Robust alerting and anomaly detection
- Deep instrumentation support for common languages and infra
- Prebuilt views and guided onboarding for fast ramp-up
- NRQL enables fine-grained telemetry control
Cons
- Complex pricing model based on ingest volume, custom events, and user seats
- High costs at scale, especially with logs and custom metrics
- SaaS-only; no self-hosting
Best For
Mid-sized to large organizations that want robust customization, deep dashboards, and are comfortable managing their own query-based observability pipelines.
Pricing & Customer Reviews
- Pricing: Based on data ingest: $0.40/GB beyond free 100 GB; Core user licenses: $49/user/month; Full platform user licenses: $349/user/month
- G2 Rating: 4.4/5 (512+ reviews)
- Praised for: dashboarding, flexibility, broad integrations
- Criticized for: complex billing, SaaS-only hosting
New Relic vs Dynatrace
New Relic provides powerful telemetry querying via NRQL, customizable dashboards, and good OpenTelemetry compatibility. Dynatrace, by contrast, wins on autonomous monitoring, automatic dependency mapping, and AI-based anomaly detection.
While New Relic’s usage and seat-based pricing can scale up quickly, Dynatrace’s DDU model is even harder to predict. Both are SaaS-only, with limited data control, making them less ideal for privacy-first teams.
4. Grafana

Known For
Grafana is an Open-source observability platform best known for real-time dashboards and metrics visualization—commonly paired with Prometheus and Loki.
Standout Features
- Grafana dashboards: Highly customizable, extensible dashboards for visualizing time-series data from Prometheus, InfluxDB, Elasticsearch, and other sources.
- Loki for logs + Tempo for traces: Grafana Labs’ own tools for logs and traces—integrated into a unified stack alongside Prometheus for metrics.
- Grafana Cloud & OSS flexibility: Users can run Grafana Cloud (SaaS) or self-host open-source versions of Grafana, Prometheus, Tempo, and Loki for full data control.
- Alerting & notification routing: Multi-channel alerting across Slack, email, PagerDuty, Opsgenie, and more, with flexible routing rules and contact points.
Key Features
- Real-time dashboards: Intuitive UI for time-series visualization with full templating, filtering, and annotation support.
- Prometheus + Loki + Tempo integration: Grafana’s default observability stack offers metrics, logs, and traces through open standards and lightweight collectors.
- Self-hosting & open source licensing: Full control over deployment, infrastructure, and data residency with OSS and Enterprise variants.
- Alerting & OnCall: Supports Grafana Alerting (successor to Alertmanager) with built-in escalation policies, silences, and contact points.
- Community & plugin ecosystem: Hundreds of prebuilt dashboards and plugins for MySQL, Kafka, Redis, AWS, GCP, Kubernetes, and more.
- Grafana Cloud: An optional managed observability platform with hosted Prometheus, Loki, Tempo, and integrations.
- Role-Based Access Control (RBAC): Team-based permissions, folders, and dashboards for scalable collaboration.
Pros
- Free open-source option for full-stack observability
- Strong ecosystem around Prometheus, Loki, Tempo, and plugins
- Highly customizable dashboards and alerts
- Offers both SaaS and self-hosted options
- Ideal for infrastructure-focused teams and platform engineers
Cons
- Grafana setup can be complex
- Support is tiered behind paid plans in Grafana Cloud or Enterprise
Best For
Teams with strong observability expertise who want to self-host or customize their stack using open standards and need flexible dashboards over full automation.
Pricing & Customer Reviews
- Pricing: OSS: Free (self-managed); Grafana Cloud: Free up to 10K series + paid tiers starting with the Pro plan of $19/month; Enterprise support and usage-based pricing apply to large deployments
- G2 Rating: 4.5/5 (132+ reviews)
- Praised for: visualization, cost efficiency, plugin ecosystem
- Criticized for: Difficult configuration, clumsy UI
Grafana vs Dynatrace
Grafana excels in dashboard customization and open-source flexibility, supporting Prometheus, Loki, and Tempo. It’s ideal for teams who prefer self-hosting and open telemetry standards. Dynatrace offers more out-of-the-box APM features, but Grafana is more suitable for infrastructure observability.
5. Sentry Overview
Known For
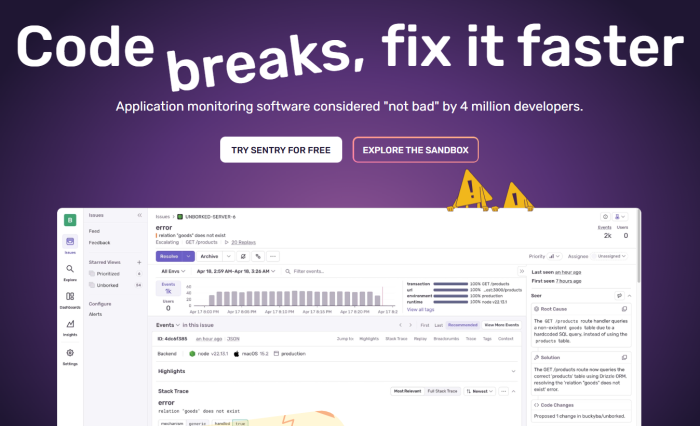
Error monitoring and application performance tracking for developers—best suited for catching bugs and frontend/backend performance issues in real-time.
Standout Features
- Issue grouping & traceability: Automatically groups errors by root cause and tags traces with context like commit SHA, environment, release, and more.
- Frontend + backend visibility: Tracks both frontend (JavaScript, React, Vue) and backend (Python, Node, Java, Go) performance and errors together—ideal for full-stack teams.
- Code owners & Git integration: Connects issues directly to the developers who introduced the code, integrating with GitHub, GitLab, Bitbucket, etc.
- Transaction sampling & alerting: Supports custom performance thresholds, alerts on P95/P99 latency, and trace-based performance bottleneck detection.
Key Features
- Error monitoring & grouping: Captures exceptions, stack traces, and contextual metadata for fast debugging across frontend, backend, and mobile apps.
- Performance monitoring: Traces span across services and routes, letting developers view slow transactions, throughput, and duration patterns.
- Session replay: Captures user sessions and UI context, leading to bugs, especially valuable for frontend debugging.
- Release tracking: Connects releases to errors, crash rates, and regressions with commit tagging and deployment markers.
- Alerting & workflow integration: Supports custom alerts for errors, thresholds, and performance degradation. Integrated with Slack, PagerDuty, and Jira.
- SDKs for most stacks: Supports a wide range of environments, including JavaScript, Python, Java, Go, PHP, Ruby, Flutter, and mobile.
- DevOps and workflow alignment: Maps errors to owners via Git, tracks releases, and closes issues via workflow tools.
Pros
- Excellent for debugging production errors
- Combines performance and error monitoring in one platform
- Deep GitOps integration and ownership attribution
- Lightweight agent SDKs and easy setup
- Great UI for developers and engineering managers
Cons
- Costly for smaller teams
- Possible delays in error reporting
Best For
Frontend/backend engineering teams that want to track bugs, monitor app performance, and connect errors to code ownership, with minimal operational overhead.
Pricing & Customer Reviews
- Pricing: Free up to 5K events/month; Teams: from $26/month; Business: usage-based, with tiers for performance monitoring and session replay, starting from $80/month
- G2 Rating: 4.5/5 (116+ reviews)
- Praised for: developer usability, trace linking, debugging speed
- Criticized for: error reporting issues
Sentry vs Dynatrace
Sentry focuses on frontend/backend error tracking, offering Git-based ownership and session replay, features tailored for developers. Dynatrace, on the other hand, targets platform teams and large-scale SRE use cases with deep infrastructure observability.
6. Coralogix
Known For
A full-stack observability platform designed for DevSecOps teams managing high-volume telemetry. Coralogix focuses on real-time stream processing, modular indexing, and pipeline-level control to reduce ingestion and storage costs.
Standout Features
- Streama™ architecture: Processes telemetry in-stream, enabling alerts and routing before data reaches long-term storage, reducing TCO and improving responsiveness.
- Indexless querying & pipeline routing: Gives teams granular control to stream, archive, or index data based on value, optimizing log workflows and spend.
- Customer-controlled archival: Archived logs are stored in the customer’s own cloud, saving on Coralogix storage costs.
Key Features
- Log-centric: Unified dashboards for logs, metrics, traces, and lightweight security signals.
- Smart indexing & archive routing: High-value logs are indexed; others are routed to cold storage or dashboards.
- ML-based anomaly detection: Surfaces pattern shifts, outliers, and spikes automatically.
- In-stream alerts: Alerts fire during log ingest—not post-storage—minimizing latency.
- GitOps & CI/CD support: Configurable pipelines and dashboards using version-controlled Git workflows.
- Cloud agnostic + VPC option: Offers hosted and VPC deployments available.
- Compliance & export: Supports audit trails, role-based access, and export to SIEM/Snowflake/S3.
Pros
- Real-time log routing and alerting with minimal lag
- Indexless storage = cost-effective long-term retention
- Logs archived in the customer cloud with zero Coralogix fee
- Deep GitOps integration and pipeline flexibility
- Strong for compliance/SIEM-lite observability
Cons
- Learning curve
- UI can be complex for beginners
Best For
Log-heavy teams who need custom pipeline control, real-time alerting, and cost-conscious archival—provided data residency is not a regulatory blocker.
Pricing & Reviews
- Pricing: Usage-based ($0.05/GB for metrics; $0.42/GB for logs, $0.16/GB for traces)
- G2 Rating: 4.6/5 (299+ reviews)
- Praised for: Pipeline flexibility, GitOps support, and ingest savings
- Criticized for: Learning curve
Coralogix vs Dynatrace
Coralogix is a log-centric full-stack observability platform built for cost efficiency and real-time log routing via its Streama™ architecture. Unlike Dynatrace’s APM-heavy model, Coralogix allows teams to store archived data in their own cloud, reducing storage fees. But this model still incurs egress charges, since data flows through Coralogix before archival.
7. Splunk AppDynamics
Known For
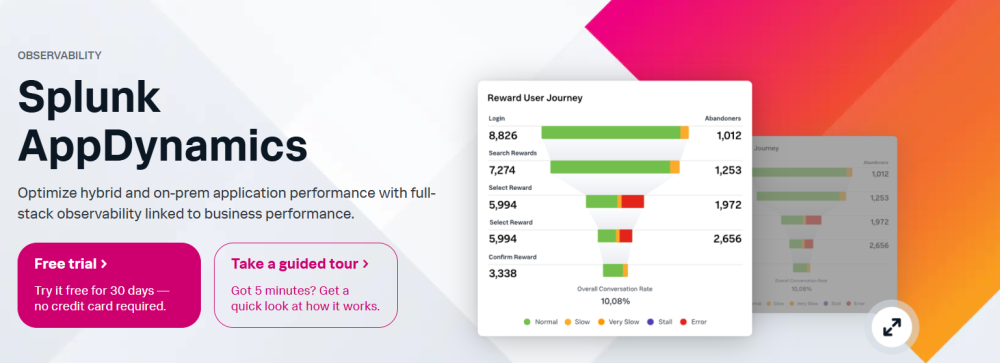
An enterprise-grade APM solution, Splunk AppDynamics, focuses on application-centric performance monitoring, business transaction mapping, and deep diagnostics across distributed systems.
Standout Features
- Business transaction monitoring: Maps and monitors transactions across services and tiers, highlighting how backend performance impacts customer experience and business KPIs.
- Cisco Secure Application integration: Built-in application security (RASP) from Cisco integrates directly with APM to flag runtime vulnerabilities and service-level threats.
- Splunk AppDynamics Cloud (formerly APMaaS): Modernized SaaS-based observability with OpenTelemetry support, cloud-native instrumentation, and support for containers and serverless.
- Application dependency flow maps: Auto-discovers service topologies and provides visual maps of application call flows and latency between services.
Key Features
- APM with business context: Correlates backend metrics with business KPIs, such as conversion rates, SLAs, or order failures, ideal for ecommerce or transactional apps.
- Deep code diagnostics: Code-level insights, exception analysis, and JVM/CLR profiling help engineering teams optimize slow or failing services.
- Hybrid environment support: Supports both on-premises and cloud workloads, making it flexible for traditional enterprises moving to hybrid/multi-cloud.
- Real User Monitoring (RUM): Provides browser-based RUM and mobile app monitoring to help connect frontend performance with backend responsiveness.
- Alerting & baseline anomalies: Learns baselines for each service and automatically triggers alerts when performance deviates, reducing false positives.
- Custom dashboards & analytics: Drag-and-drop dashboards combined with flow visualizations to support NOC and executive reporting.
- Cisco ecosystem integration: Benefits from being part of the Cisco stack—offering integration with network, infrastructure, and security tooling.
Pros
- Strong correlation between app metrics and business KPIs
- Deep diagnostics for Java, .NET, PHP, Node.js, and other backends
- Built-in security integration (RASP) via Cisco Secure Application
- Supports hybrid deployments and on-prem workloads
- Good enterprise feature set for large teams and compliance-heavy industries
Cons
- Slower updates or innovation cycle due to enterprise roadmap alignment with Cisco
- Inefficient alerts
Best For
Large enterprises with complex, transactional applications that want to align performance with business outcomes and need on-premises or hybrid observability with security features.
Pricing & Customer Reviews
- Pricing: Starts around $6–$50 per host/month (based on custom quotes); Higher-tier features and dashboards cost extra per module
- G2 Score: 4.3/5 (375+ reviews)
- Praised for: business transaction mapping, code diagnostics
- Criticized for: price, less fequent updates
Splunk AppDynamics vs Dynatrace
Splunk AppDynamics specializes in business transaction monitoring and code-level diagnostics, ideal for enterprises needing visibility into revenue-impacting performance. Dynatrace adds AI-driven automation and dependency mapping to that mix, making it stronger for real-time, large-scale environments.
Both tools support hybrid cloud and security observability, but Dynatrace has a more modern architecture. Splunk AppDynamics is often viewed as legacy-heavy and slower to deploy, while Dynatrace brings speed at the cost of simplicity.
Conclusion
The rules have changed in modern APM. Today, it’s not limited to “Can this tool monitor my applications?”. Teams are asking harder questions now.
Can I migrate hassle-free?
Is the pricing predictable?
Can I control my data?
Dynatrace, New Relic, and Datadog are great platforms with enterprise capabilities. But they also come with complexity, steep pricing, and a learning curve, among others. This trade-off doesn’t work out for every team, especially smaller ones. This is why CubeAPM hits differently. It actually offers what modern teams need:
- Smart trace sampling: that keeps the signals while cutting the noise (and cost)
- Full MELT coverage: tracks metrics, events, logs, and traces (MELT) with OpenTelemetry baked in from day one
- On-prem + BYOD deployment: host on-premises or in the cloud, the choice is yours, and meet compliance needs
- Transparent, predictable pricing: with no billing surprises
- Real-time developer support: real humans answer your questions in real time
Ready to escape APM bloat? Move toward a cost-efficient observability solution, CubeAPM, that scales with your team.
Disclaimer: The information in this article reflects the latest details available at the time of publication and may change as technologies and products evolve.
FAQs
1. What are the best Dynatrace alternatives for 2025?
Top Dynatrace alternatives include CubeAPM, Datadog, New Relic, Grafana, and Coralogix, each with strengths across pricing, open standards, and self-hosting options.
2. Why do teams switch from Dynatrace to alternatives like CubeAPM?
Teams often switch due to high cost (DDU pricing), lack of data localization support, and desire for OpenTelemetry-native, flat-priced solutions like CubeAPM.
3. Does Dynatrace support OpenTelemetry?
Yes, but only partially. While it accepts OTEL data, its native observability relies on proprietary agents and the Davis AI layer, unlike fully OTEL-native tools like CubeAPM.
4. Which APM tool offers the best value for money?
CubeAPM stands out with smart trace sampling, full MELT observability, and transparent pricing as low as $0.15/GB, making it 60–80% cheaper than legacy APMs.
5. Can I migrate from Dynatrace to CubeAPM easily?
Yes. CubeAPM supports one-hour migration from Dynatrace, Datadog, or New Relic by reusing OTEL, Prometheus, or existing agents without re-instrumentation.


