Vue.js monitoring tools are essential for ensuring seamless performance in modern web apps built with reactive components and single-page architectures. Vue.js ranks among the top 5 JavaScript frameworks, powering over 2 million active projects worldwide.
With that scale, even small rendering delays or unhandled API errors can significantly impact user retention and conversion rates. Yet, many teams struggle to choose the right Vue.js monitoring tools that fit their needs and budgets. Legacy vendors come with complex pricing, limited sampling efficiency, and fragmented frontend-backend visibility.
CubeAPM is the best Vue.js monitoring tool provider built for the OpenTelemetry era. It offers full-stack MELT coverage, Vue-optimized RUM, smart sampling, unlimited retention, and transparent pricing, making it both powerful and predictable. In this article, we’ll explore the top Vue.js monitoring tools based on performance insights, scalability, and value.
8 Best Vue.js Monitoring Tools
- CubeAPM
- Datadog
- New Relic
- Dynatrace
- AppSignal
- Raygun
- Sentry
- SmartBear Insight Hub (formerly Bugsnag)
What is a Vue.js Monitoring Tool?
A Vue.js monitoring tool is a performance observability solution designed to track how Vue-based frontends behave in real time across browsers, devices, and user sessions. It captures everything from page load time, Core Web Vitals, API latency, and JavaScript errors to deeper session replays and distributed traces that connect frontend events with backend transactions. Essentially, it tells you why a page is slow, where an error originated, and how it affects real users.
Vue.js monitoring is critical for modern businesses where web performance directly impacts customer experience and revenue. Vue.js monitoring tools, for instance, CubeAPM is built natively on OpenTelemetry, collects structured metrics, logs, and traces (MELT) in a unified view. This allows teams to detect and resolve performance regressions faster than legacy tools. Here’s how Vue.js monitoring empowers engineering and product teams:
- Detect Frontend Bottlenecks: Identify slow-rendering components, oversized bundles, and inefficient state updates impacting Time to Interactive (TTI).
- Correlate Frontend & Backend Issues: Link Vue component errors with specific API or database latency using distributed tracing.
- Enhance User Experience: Use Real User Monitoring (RUM) to capture real-time interaction data, including rage clicks, layout shifts, and device performance.
- Reduce MTTR (Mean Time to Resolution): Get unified insights across logs, metrics, and errors instead of switching between siloed dashboards.
- Maintain Compliance & Cost Control: Store data on your own cloud (BYOC) and use smart sampling to reduce ingestion costs without losing context.
Example: Diagnosing Slow Page Loads in a Vue.js SPA with CubeAPM
Imagine a Vue.js Single Page Application (SPA) where customers report intermittent slowness during checkout. With CubeAPM’s Real User Monitoring (RUM), you can visualize LCP (Largest Contentful Paint) spikes, correlate them with API latency from the /payment/confirm endpoint, and trace the delay back to a specific microservice using distributed tracing.
CubeAPM automatically links frontend events with backend traces, showing how a 2.5-second API delay in the orders-service directly caused a render block in the Vue component. Engineers can then drill into correlated logs and infrastructure metrics (from Kubernetes or AWS) on the same screen—no context switching, no data silos. Within minutes, teams identify the root cause, deploy a fix, and validate it using synthetic monitoring to simulate user flows post-release.
This seamless cross-layer visibility is why CubeAPM’s Vue.js monitoring is trusted by high-traffic platforms needing accurate, affordable, and OpenTelemetry-ready observability.
Why teams choose different Vue.js monitoring tools?
Cost-predictable RUM and Error Analytics
Vue.js applications generate high volumes of Real User Monitoring (RUM) data and JavaScript error events, causing legacy tools to inflate bills unpredictably. Developers on Reddit and G2 report that usage-based tiers for RUM, session replay, and retention often double costs as traffic grows. Teams now prefer platforms like CubeAPM that offer flat, ingestion-based pricing for predictable scalability.
OpenTelemetry-first and Vendor-neutral Instrumentation
Modern Vue.js teams adopt OpenTelemetry (OTEL) to maintain unified traces from the browser to backend services. With frameworks like Nuxt and Vite using distributed APIs, OTel’s web SDK (@opentelemetry/sdk-trace-web) ensures seamless span continuity. Tools built around OTEL-native pipelines prevent vendor lock-in and simplify instrumentation across frontend and backend stacks.
Cross-signal Correlation from Vue Components to Backend Traces
Front-end performance issues often start in Vue components but originate in APIs or databases. Monitoring tools that correlate Core Web Vitals, Vue component timings, and distributed traces help developers pinpoint bottlenecks faster. This deep correlation shortens MTTR and transforms fragmented telemetry into actionable insights for full-stack teams.
Data Control, Privacy, and Multi-cloud Readiness
Vue.js monitoring increasingly involves session replay and PII exposure, creating compliance challenges under GDPR and HIPAA. Businesses seek solutions offering data localization and Bring-Your-Own-Cloud (BYOC) options to store telemetry securely in their own regions. Multi-cloud-ready platforms like CubeAPM enable control, compliance, and flexibility without added egress costs.
Developer Experience and Setup Speed
Frontend engineers value tools that integrate within minutes—using lightweight SDKs, automatic source-map uploads, and smart sampling defaults. Modern Vue monitoring platforms provide contextual dashboards that connect errors, metrics, and traces in one interface. This streamlined DX reduces cognitive load and allows developers to focus on fixing issues, not configuring tools.
Tying Web Vitals to Real Business Outcomes
Fast, stable Vue apps directly influence user satisfaction and conversion rates. Tools that map Web Vitals (LCP, FID, CLS) to customer behavior and revenue metrics help quantify performance ROI. As shown in Google’s Core Web Vitals studies, improving frontend responsiveness can boost engagement by up to 24%—making performance monitoring a business-critical function.
8 Best Vue.js Monitoring Tools
1. CubeAPM
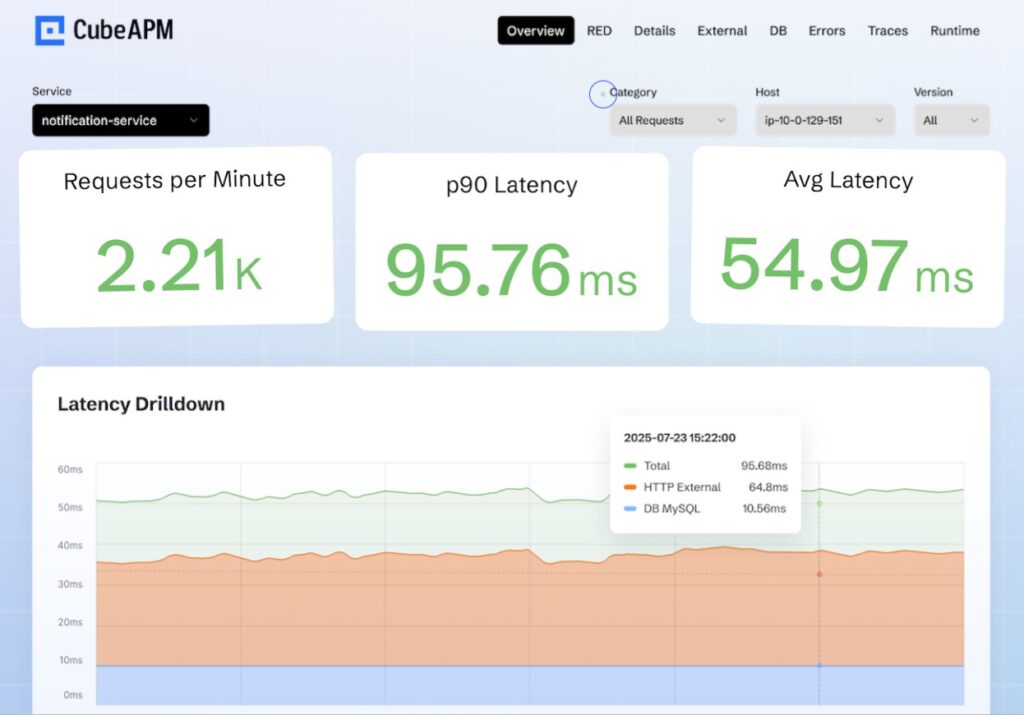
Overview
CubeAPM has quickly emerged as one of the most developer-friendly and cost-efficient Vue.js monitoring platforms in 2025. Known for its OpenTelemetry-native architecture and full MELT (Metrics, Events, Logs, Traces) coverage, it helps teams monitor every layer of their Vue.js applications—from RUM and error tracking to backend API latency—without vendor lock-in or pricing complexity. Its transparent $0.15/GB ingestion model and 800+ integrations make it a trusted choice for teams.
Key Advantage
Full-stack correlation for Vue.js apps — CubeAPM uniquely links frontend Vue component metrics, JavaScript errors, and API traces in one unified dashboard, giving engineers real-time insight into how UI performance affects backend health.
Key Features
- Real User Monitoring (RUM): Captures Core Web Vitals, network timing, and user session data from Vue components.
- Error Tracking: Detects and correlates Vue runtime errors and unhandled promise rejections with backend trace context.
- Distributed Tracing: Connects Vue user interactions to API, database, and infrastructure traces via OpenTelemetry.
- Synthetic Monitoring: Simulates key Vue workflows to verify uptime and responsiveness before users are impacted.
- Log & Metric Unification: Merges browser logs, frontend metrics, and server traces into one visual timeline.
Pros
- Highly affordable for high-volume frontend telemetry
- OpenTelemetry and Prometheus compatible
- Supports BYOC and on-prem hosting for compliance
- Excellent customer support with rapid turnaround
Cons
- Not ideal for teams preferring fully managed off-prem services
- Focused on observability only and doesn’t include cloud security modules
CubeAPM Pricing at Scale
CubeAPM uses a transparent pricing model of $0.15 per GB ingested. For a mid-sized business generating 45 TB (~45,000 GB) of data per month, the monthly cost would be ~$7,200/month*.
*All pricing comparisons are calculated using standardized Small/Medium/Large team profiles defined in our internal benchmarking sheet, based on fixed log, metrics, trace, and retention assumptions. Actual pricing may vary by usage, region, and plan structure. Please confirm current pricing with each vendor.
Tech Fit
CubeAPM integrates seamlessly across Vue.js, React, Angular, Node.js, Python, Java, Go, and .NET environments. It’s especially strong for Vue 3 + Vite applications using OpenTelemetry SDKs, and suits teams deploying on Kubernetes, AWS, Azure, or GCP with BYOC or on-prem configurations.
2. Datadog
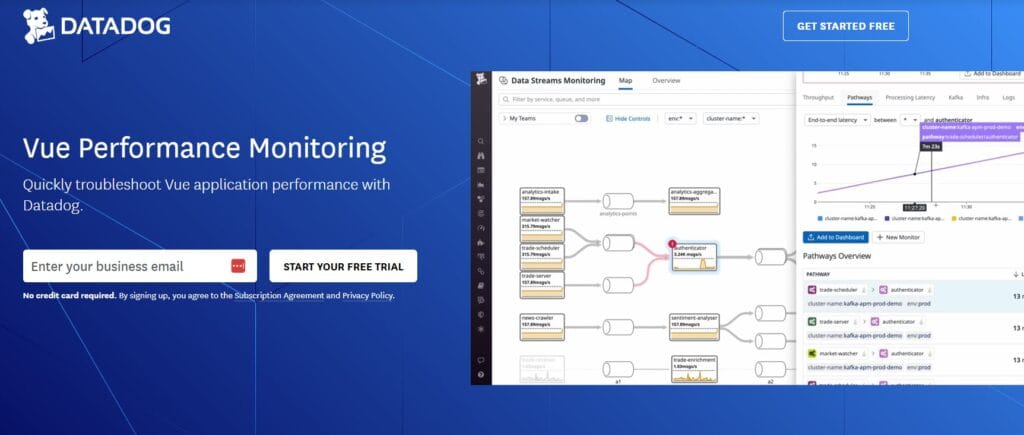
Overview
Datadog is a heavyweight in digital experience monitoring that gives Vue teams end-to-end visibility—from Core Web Vitals in the browser to backend traces and logs—inside one platform. Its Vue page and RUM Browser SDK focus on tying user sessions, component-level errors, resources, and network calls to APM traces for fast triage and full-stack context.
Key Advantage
Deep RUM↔APM correlation for Vue — connects real Vue sessions to backend spans and logs so teams can jump from a slow component render to the exact API, DB query, or container causing it.
Key Features
- Core Web Vitals on Vue: Tracks LCP, CLS, INP and page timings on real user traffic, tied to sessions.
- Browser Error Tracking: Auto-groups JS/TS errors from Vue, with stack traces and impact by session.
- RUM↔Trace Linking: Links user sessions to service spans for frontend-to-backend causality.
- Browser Logs SDK: Captures console/network logs from Vue apps for contextual debugging.
- Synthetic Journeys: Simulates key Vue workflows and correlates with RUM and APM data.
Pros
- Mature end-to-end platform with strong Vue RUM and session replay
- Excellent correlation between sessions, traces, logs, and synthetics
- Rich documentation and ecosystem with quick browser SDK setup
Cons
- Pricing spans multiple SKUs (sessions, hosts, spans, logs), and can be complex to plan budgets
- SaaS-only; no self-hosting
Datadog Pricing at Scale
Datadog’s pricing for Vue.js monitoring varies by feature category rather than simple data ingestion:
- RUM (Browser): $0.15 per 1,000 sessions for RUM Measure; $3 per 1,000 sessions for RUM Investigate; $2.50 per 1,000 sessions for Session Replay.
- Logs: $0.10 per GB ingested, with extra charges for indexed logs and retention tiers.
- APM: $31 per APM host (annual billing)
For a mid-sized business ingesting around 45 TB (~45,000 GB) of data per month, the cost would come around $27,475/month*.
Tech Fit
Datadog integrates seamlessly with Vue 2/3, Nuxt, and Vite setups using its Browser RUM SDK, while offering backend support for Node.js, Java, .NET, Python, Go, PHP, and Ruby. It’s ideal for large teams needing a unified platform that spans frontend, backend, and infrastructure monitoring.
3. New Relic
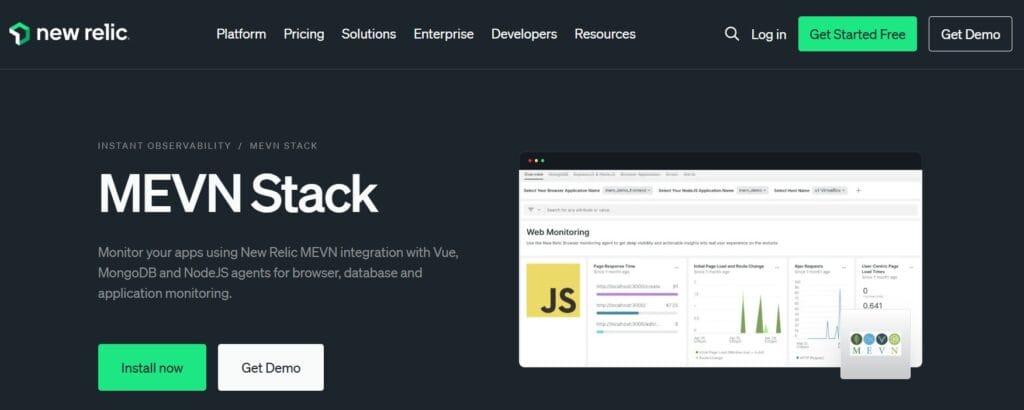
Overview
New Relic brings Vue teams a mature browser monitoring stack with first-class SPA support, Nuxt quickstarts, and tight links to backend telemetry. Its Browser agent captures real-user performance (including Web Vitals), JS errors, route changes, and network waterfalls, then correlates them with APM traces and logs so you can troubleshoot Vue issues in one place.
Key Advantage
SPA-aware RUM for Vue + Nuxt — out-of-the-box instrumentation for route changes, component interactions, and page lifecycle, with direct hops into backend traces for root-cause analysis.
Key Features
- SPA & Route Change Instrumentation: Tracks client-side navigations in Vue/Nuxt and ties them to user sessions.
- Core Web Vitals & Page Timings: Surfaces LCP, CLS, INP and detailed resource timing for real users.
- Error Tracking for Vue: Groups JS/TS errors with stack traces, releases, and deploy markers for quick regressions.
- RUM ↔ APM Correlation: Links Vue sessions to service spans and database calls to expose frontend→backend causality.
- Nuxt Quickstarts & Browser Agent: Copy-paste or NPM agent install, plus opinionated dashboards for faster time-to-value.
Pros
- Strong SPA monitoring with clean Vue and Nuxt integration
- Solid correlation between browser telemetry, APM traces, logs, and synthetics
- Quickstarts and guided install reduce setup friction
Cons
- Pricing combines data ingestion with paid user seats, which adds overhead
- SaaS-only; no self-hosting
New Relic Pricing at Scale
New Relic bills data ingest beyond the 100 GB monthly free tier at $0.40/GB (Original Data) or $0.60/GB (Data Plus), plus paid user seats.
For a business ingesting 45 TB of logs per month, the cost would come around $25,990/month*.
Tech Fit
Best for teams on Vue 2/3, Nuxt, and Vite that want real-user browser analytics tied to Node.js, Java, .NET, Python, Go, PHP, Ruby backends. Great fit when you need SPA monitoring plus rich backend correlation and prefer a single vendor for browser, APM, logs, and synthetics.
4. Dynatrace
Overview
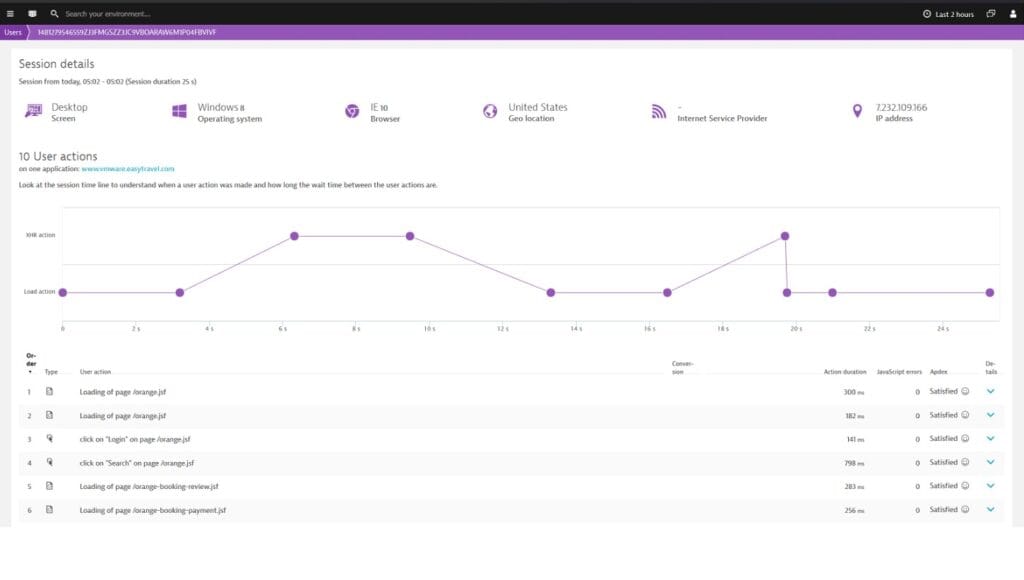
Dynatrace brings SPA-aware Real User Monitoring to Vue apps with automatic JS injection via OneAgent or an agentless snippet, plus opinionated page grouping and user-action modeling. Teams get session-level performance, JS errors, XHR/fetch timing, and “visually complete” UX metrics with fast pivots into backend traces and infrastructure for end-to-end triage.
Key Advantage
SPA intelligence for complex Vue front-ends — automatic route/action detection, page grouping, and UX metrics that reflect what users actually see, not just raw W3C timings.
Key Features
- Automatic RUM Injection: OneAgent can inject the RUM script server-side; an agentless snippet is available when you can’t run an agent.
- SPA Route & Action Modeling: Configure pages and page groups to analyze user flows across client-side navigation.
- XHR/Fetch Correlation: Capture timed actions for network requests from Vue components and link them to user sessions.
- CDN Code Source Control: Choose RUM code source (e.g., CDN) and manage injection behavior per app.
- “Visually Complete” UX Metric: Assess perceived render completeness for SPAs beyond basic W3C events.
Pros
- SPA-aware RUM with strong page grouping and user-action analytics
- Smooth jumps from Vue sessions to backend traces and infra
- Flexible deployment: OneAgent auto-injection or agentless snippet
Cons
- Pricing spans sessions, Grail ingest (logs/traces), retention, and queries
- Learning curve for tuning page groups, action naming, and data controls
Dynatrace Pricing at Scale
Dynatrace uses multiple meters relevant to Vue monitoring:
- Full stack: $0.01/8 GiB hour/month or $58/month/8GiB host
- Log Ingest & process: $0.20 per GiB
For a similar 45 TB (~45,000 GB/month) volume, the cost would be $21,850/month.
Tech Fit
Strong fit for Vue 2/3, Nuxt, Vite front-ends needing SPA-aware UX metrics and route modeling, with backends on any OneAgent-supported stack. Works well in enterprises standardizing on Dynatrace for full-stack + DEM + Grail while still supporting agentless RUM when needed.
5. AppSignal
Overview
AppSignal gives Vue teams a straightforward way to capture front-end errors and performance signals with an official Vue integration (Vue 2.6+ and Vue 3). It’s known for a developer-friendly setup, clear dashboards, and “all features on all plans,” making it popular with product teams that want reliable Vue error monitoring and performance insights without a heavy APM footprint.
Key Advantage
Developer-centric Vue integration — a lightweight SDK that surfaces real JS errors, performance timelines, and context quickly so front-end teams can fix issues fast.
Key Features
- Vue error tracking: Automatic capture of runtime errors and unhandled promise rejections with stack traces and context.
- Frontend performance timelines: View slow interactions and asset timing to spot regressions affecting Vue components.
- Source maps & breadcrumbs: Upload source maps and record user actions/console messages for faster reproduction.
- Uptime & check-ins: Offers uptime checks and cron/heartbeat monitoring to guard critical Vue routes.
- Notifications & workflow: Integrations with Slack/PagerDuty/Jira and opinionated dashboards for rapid triage.
Pros
- Quick npm setup and minimal config for Vue 2/3
- Clear UI with actionable error grouping and context
- All features available on every plan
- Good notifier and issue-tracker integrations
Cons
- Request-based pricing may not align with GB-heavy telemetry strategies
- Fewer integrations
AppSignal Pricing at Scale
AppSignal lists APM in USD at approximately $23.25/month (monthly) for 250K requests/month. Logging is a paid add-on with 1 GB included and larger storage buckets available on higher-priced tiers; enterprise add-ons (e.g., HIPAA, SAML SSO, long-term log storage) are billed separately.
For a mid-sized company emitting 45 TB/month of telemetry, the total cost depends on how that 45 TB splits across requests vs. logs and which logging buckets you choose, but at this volume, you’ll move beyond base allowances into larger buckets or enterprise discussions.
Tech Fit
Strong fit for Vue 2/3 apps that need dependable error tracking and frontend performance signals with minimal overhead. Works well alongside Node.js, Rails, Elixir, Python backends, and suits teams that prefer simple setup, clear alerting, and steady day-to-day monitoring over heavyweight enterprise APM feature sets.
6. Raygun
Overview
Raygun gives Vue teams a clean, developer-friendly path to Real User Monitoring (RUM) and Crash Reporting using the Raygun4JS SDK with an official Vue setup. It’s popular for fast installs, actionable error grouping, and performance insights that help reproduce and fix Vue issues without a heavy APM footprint.
Key Advantage
Frontend-first visibility for Vue — quick Vue integration that surfaces real-user performance and JavaScript errors with enough context to reproduce issues fast.
Key Features
- Vue RUM SDK: Tracks real user sessions, SPA navigations, and page performance so you can spot regressions as they happen.
- Crash Reporting for Vue: Captures runtime errors and unhandled rejections with stack traces and environment context.
- User-centric diagnostics: See affected users, sessions, and device/browser details to prioritize fixes.
- Source maps & breadcrumbs: Map minified stacks and follow user/console breadcrumbs to the exact failure point.
- Lightweight install: NPM or script-tag setup with simple configuration for Vue 2/3 and SPA routing.
Pros
- Very fast to implement in Vue 2/3 and Nuxt
- Clear error grouping and user impact views
- Solid balance of crash reporting and RUM for frontend teams
- Helpful workflow integrations and notifications
Cons
- Search and filtering issues
- Error handling issues
Raygun Pricing at Scale
Raygun prices APM by sessions. For a mid-sized Vue app, a practical range is 200k–1M sessions/month, which comes to $160–$800/month on annual billing.
Tech Fit
Best for Vue 2/3 and Nuxt teams that want fast, frontend-centric monitoring—RUM plus crash reporting—without adopting a heavyweight enterprise APM. Works well alongside Node.js or other backends when you primarily need client-side performance and error visibility for Vue applications.
7. Sentry
Overview
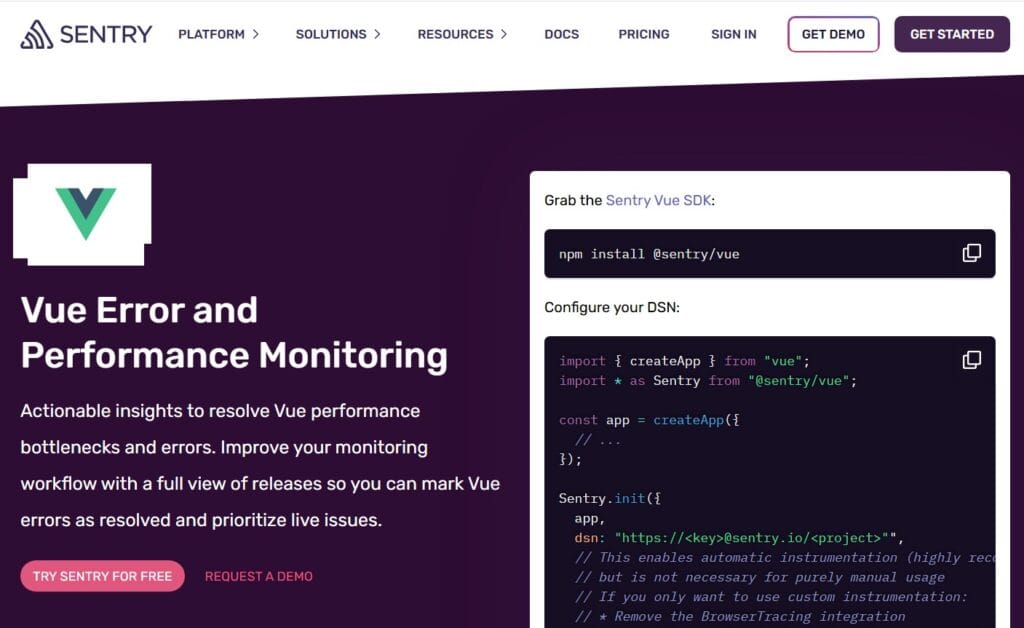
Sentry gives Vue teams production-grade error and performance monitoring with an official @sentry/vue SDK, Nuxt options, and built-in Web Vitals. It captures JS errors, component lifecycle spans, SPA navigations, and browser transactions, then links them to releases and deploys so you can see when a change introduced a regression and who’s impacted.
Key Advantage
Vue-native error + performance in minutes — drop in the Vue SDK, enable tracing, and get actionable errors, transactions, and Web Vitals tied to releases and environments.
Key Features
- Vue Component Tracking: Creates spans for mount/update/unmount to expose slow components.
- Web Vitals in Production: Records LCP, CLS, INP/FID and attaches them to browser transactions.
- Tracing & Releases: Correlates Vue transactions with releases, commits, and deploy markers for faster rollback decisions.
- Source Maps & Breadcrumbs: Maps minified stacks and captures user/console/network breadcrumbs for repro.
- Nuxt & Router Integrations: Simple config to instrument SPA navigations and route changes automatically.
Pros
- Mature Vue SDK with quick setup and clear docs
- Strong error grouping, release health, and performance timelines
- Good alerting and workflow integrations developers already use
Cons
- Event/transaction and replay quotas can make pricing unpredictable at scale
- Error reporting delays
Sentry Pricing at Scale
Free up to 5K events/month; Teams: from $26/month; Business: usage-based, with tiers for performance monitoring and session replay, starting from $80/month. For mid-sized teams ingesting 45 TB of data, the cost could be $12,100/month*.
Tech Fit
Best for Vue 2/3 and Nuxt teams that want fast, developer-centric error and performance visibility with Web Vitals and release tracking. Works well across mixed stacks (Node.js, Python, Java, .NET, Go, PHP, Ruby) when you primarily need front-end monitoring and plan to add backend tracing selectively.
8. Bugsnag (by SmartBear)
Overview
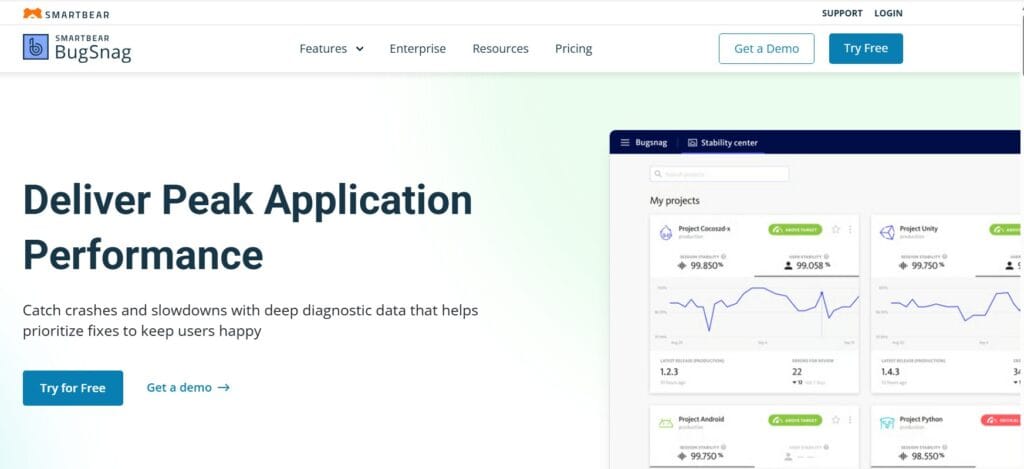
Bugsnag gives Vue teams mature error monitoring and growing performance capabilities with an official Vue integration. It’s known for developer-friendly crash analytics, stability scores, and release health that help product teams understand which Vue regressions hurt users most—while increasingly tying browser data to backend traces across SmartBear’s platform.
Key Advantage
Release-focused error intelligence for Vue, stability scores and release health make it easy to see which deploy introduced a spike in Vue errors and which users are most affected.
Key Features
- Vue error monitoring: Automatic capture of runtime errors, unhandled rejections, and rich diagnostics for Vue 2/3.
- Component & release health: Stability scores, versions, and deploy markers highlight regressions quickly.
- Performance monitoring: Frontend performance timelines and slow interaction insights to surface UX hotspots.
- Distributed tracing: Correlates client-side issues with backend services to speed up root-cause analysis.
- Workflow integrations: Alerts and issue syncing with tools your team already uses for faster triage.
Pros
- Excellent error grouping and actionable diagnostics for Vue
- Release health and stability scoring resonate with product teams
- Path to broader full-stack visibility through SmartBear ecosystem
- Enterprise options for governance and scale
Cons
- UI and dashboard issues
- Complexity
Bugsnag Pricing at Scale
Bugsnag uses an event-based subscription model with a 14-day free trial on its Enterprise plan available to all new users. Publicly referenced tiers (Select/Preferred) start at around $20–$33 per month for smaller and mid-sized businesses, with larger teams and usage requiring higher plans or Enterprise pricing by quote. Plans are based on the number of error events you send and the features/retention levels included, and there is no single flat per-GB cost published for telemetry.
Tech Fit
Great for Vue 2/3 teams that prioritize crash analytics, release health, and product-facing stability KPIs, and for organizations that want error-first Vue monitoring with a practical path to broader observability. Works well alongside Node.js, Java, .NET, Python, and other backends.
How to Choose the Right Vue.js Monitoring Tool
Architectural Fit & Frontend Compatibility
Pick a monitoring tool that natively supports Vue 2, Vue 3, and Nuxt 3, with automatic tracking of component lifecycle events and API calls. Tools requiring manual patching or extra wrappers slow teams down and miss key metrics from reactive components.
Trace Continuity with OpenTelemetry Support
Modern Vue stacks need end-to-end tracing that spans from browser to backend. Choose a solution that integrates OpenTelemetry’s web SDK so Vue events, fetches, and API spans are automatically linked to server traces for complete visibility.
Predictable Pricing for Frontend Telemetry
Vue apps produce large RUM and error volumes, so unpredictable per-host pricing quickly spirals out of control. Look for tools with flat ingestion-based or smart-sampling pricing that scales with signal quality, not user count or data spikes.
Data Ownership, Privacy & Compliance
Monitoring tools that capture session replays or DOM data must offer field-level masking, regional storage, and Bring-Your-Own-Cloud (BYOC) options. This ensures compliance with GDPR or HIPAA while keeping sensitive Vue telemetry under your control.
Correlation & Unified Observability
A good Vue.js monitoring tool should link Core Web Vitals, Vue component timings, and backend latency in one dashboard. Unified correlation minimizes context switching and accelerates debugging during slow page loads or user-journey drops.
Ease of Onboarding & Developer Experience
Vue teams need quick setup, simple SDK install, automatic source-map upload, and ready-made dashboards. Strong documentation and responsive support ensure developers can instrument apps and act on insights within minutes.
Conclusion
Choosing a Vue.js monitoring tool is hard because the pain is real: pricing that balloons with sessions and replays, vendor lock-in that blocks OpenTelemetry, weak correlation between Vue components and backend traces, and compliance headaches when you can’t keep data where it belongs.
CubeAPM solves this with an OpenTelemetry-native pipeline, unified RUM + traces + logs + metrics, smart sampling, BYOC/self-host options, and simple $0.15/GB pricing, so you get complete visibility without surprise bills. It’s purpose-built for modern Vue 2/3 and Nuxt stacks.
Ready to see it in action? Schedule a FREE demo with CubeAPM now.
Disclaimer: The information in this article reflects the latest details available at the time of publication and may change as technologies and products evolve.
FAQs
1. What’s the difference between Real User Monitoring (RUM) and synthetic monitoring for Vue apps?
RUM captures real users’ sessions (devices, networks, geos) and surfaces issues you don’t see in staging, while synthetic monitoring runs scripted journeys (e.g., checkout) on a schedule to catch regressions before users do. The best stacks use both: synthetics for proactive guardrails, RUM for real-world truth.
2. How do I correlate a slow Vue component with the exact backend call causing it?
Use a tool that links browser spans (route change, component mount/update) with distributed traces. When the Vue router navigates or a component fetches data, those spans should stitch to the API/service trace so you can jump straight to the slow endpoint. CubeAPM does this automatically through its OTel-native pipeline.
3. Do I need session replay for Vue.js monitoring, or is it optional?
Replay is optional but helpful for high-impact UX issues (layout shifts, odd click paths). If you store replay, ensure masking of sensitive fields and regional storage controls. CubeAPM supports privacy-first workflows so you can keep replay while meeting compliance requirements.
4. How should I estimate cost as traffic grows?
Map your usage meters. Some vendors meter by sessions/events (RUM/replay), some by hosts, others by GB of data. If you expect large front-end volumes (spiking sessions, heavy logs/traces), a GB-based model like CubeAPM’s $/GB is often more predictable than multi-SKU mixes of sessions + hosts + indexing.
5. What’s the quickest way to instrument a Vue 3 + Vite project without drowning in config?
Start with a browser SDK that offers Vue presets (Vue plugin, router auto-instrumentation, source maps upload). Turn on Web Vitals and tracing in one go, then add log capture and key business transactions. Tools like CubeAPM and Sentry provide drop-in Vue integrations; prioritize those that correlate to backend out of the box.


