










ScyllaDB’s performance advantage over Cassandra comes from a shard-per-core architecture that maximizes CPU utilization and eliminates JVM garbage collection pauses. But monitoring ScyllaDB clusters requires different instrumentation than traditional NoSQL databases. Most generic observability platforms miss ScyllaDB-specific signals: per-shard latency distribution, compaction backlog by table, replica sync lag, and stall detector events that indicate scheduler saturation.
This guide compares 9 ScyllaDB monitoring tools across open source stacks, enterprise SaaS platforms, and self-hosted options. Each is assessed on ScyllaDB-specific signal depth, total cost of ownership, deployment model, and migration complexity. According to the CNCF Annual Survey 2024, 73% of organizations report using managed database services, making efficient database monitoring critical as scale increases.
Quick Comparison: 9 ScyllaDB Monitoring Tools at a Glance
| Tool | Best For | Pricing Model | ScyllaDB Native? | On-Prem? |
|---|---|---|---|---|
| ScyllaDB Monitoring Stack | ScyllaDB-specific visibility, official support | Free open source | ✓ Built for ScyllaDB | ✓ Yes |
| CubeAPM | Unified ScyllaDB + app + infra monitoring | $0.20/GB, unlimited retention | ✓ Via Prometheus/OTel | ✓ First class |
| Prometheus + Grafana | DIY ScyllaDB monitoring with full control | Free open source | ✓ Via scylla_exporter | ✓ Yes |
| Datadog | Managed multi-cloud ScyllaDB monitoring | $15/host/month + metrics | Partial via integration | ✗ SaaS only |
| New Relic | ScyllaDB inside broader observability platform | $0.40/GB beyond free tier | Partial via Prometheus remote write | ✗ SaaS only |
| Grafana Cloud | Managed Prometheus/Grafana for ScyllaDB | Free tier, $8/month Pro plan + usage | ✓ Via scylla_exporter | ✗ SaaS only |
| Netdata | Real-time ScyllaDB node metrics | Free open source, Cloud $20/node/month | ✓ Native collector | ✓ Yes |
| Dynatrace | Enterprise AI-assisted ScyllaDB monitoring | Host-based, starts at $74/host/month | Partial | ✓ On-prem option |
| Elastic Observability | ScyllaDB logs + metrics inside ELK stack | Free OSS, Cloud starts $99/month | Partial via Metricbeat | ✓ Self-hosted |
Pricing figures sourced from vendor pricing pages as of January 2026. Verify current rates before making purchasing decisions.
1. ScyllaDB Monitoring Stack
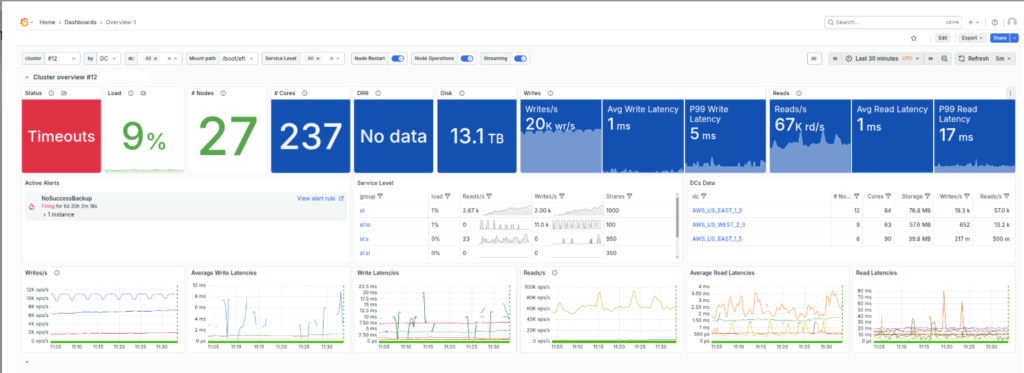
ScyllaDB Monitoring Stack is the official open-source monitoring bundle from ScyllaDB. It packages Prometheus for metric collection, Grafana for dashboards, Alertmanager for notifications, and Grafana Loki for log aggregation into a single deployment. The stack includes pre-built dashboards specifically designed for ScyllaDB’s architecture: per-shard metrics, compaction progress, cache hit rates, and query performance broken down by consistency level.
Key Features:
- Pre-configured Grafana dashboards for ScyllaDB clusters with per-shard visibility
- Native ScyllaDB Prometheus exporter surfaces 500+ metrics specific to ScyllaDB internals
- Alert templates for common ScyllaDB issues: high compaction backlog, coordinator overload, large partition warnings
- CQL dashboard identifies slow queries, ALLOW FILTERING usage, and unprepared statement warnings
- Annotation support for maintenance events: repairs, backups, rolling upgrades
Pricing: Free and open source. Infrastructure costs depend on cluster size and retention needs.
Pros:
- Built by the ScyllaDB team with deep knowledge of ScyllaDB internals
- Most complete ScyllaDB-specific signal coverage available
- No vendor lock-in, runs entirely within your infrastructure
- Active community and official ScyllaDB support
Cons:
- Requires self-hosting and Day 2 operations: upgrades, backups, scaling
- No built-in application trace correlation unless you add separate APM tooling
- Prometheus storage can become expensive at scale without careful retention tuning
- Alert noise without customization: default thresholds may not fit your workload profile
Best for: Teams running ScyllaDB in production who want the most complete ScyllaDB-specific visibility and are comfortable operating their own monitoring infrastructure.
2. CubeAPM

CubeAPM is a full-stack observability platform that runs inside your VPC or data center. It monitors ScyllaDB clusters via Prometheus integration or OpenTelemetry, surfacing database metrics alongside application traces, logs, and infrastructure health in a single unified view. CubeAPM correlates slow ScyllaDB queries directly with the application traces that triggered them, making root cause analysis faster.
Key Features:
- Native Prometheus compatibility ingests ScyllaDB metrics via scylla_exporter without custom configuration
- Correlates ScyllaDB query latency with distributed traces to show exactly which service triggered slow queries
- Unlimited retention at $0.20/GB pricing means historical ScyllaDB performance data stays searchable indefinitely
- Self-hosted deployment keeps all ScyllaDB telemetry inside your infrastructure with zero egress costs
- Pre-built dashboards for ScyllaDB health: node status, compaction, cache efficiency, query patterns
Pricing: $0.20/GB ingestion-based pricing. No per-host fees, no user seat charges. Infrastructure costs included in flat rate.
Pros:
- Unified view of ScyllaDB metrics, application traces, and logs in one platform eliminates tool switching
- On-prem deployment satisfies data residency and compliance requirements
- Predictable pricing model scales linearly with data volume
- Trace-to-database correlation reveals which application endpoints stress ScyllaDB
Cons:
- Requires BYOC deployment: you manage the infrastructure
- ScyllaDB-specific dashboards are less comprehensive than the ScyllaDB Monitoring Stack
- Not ScyllaDB native: relies on Prometheus exporter integration
Best for: Teams monitoring ScyllaDB alongside microservices who need unified observability with full data control and predictable costs.
3. Prometheus + Grafana
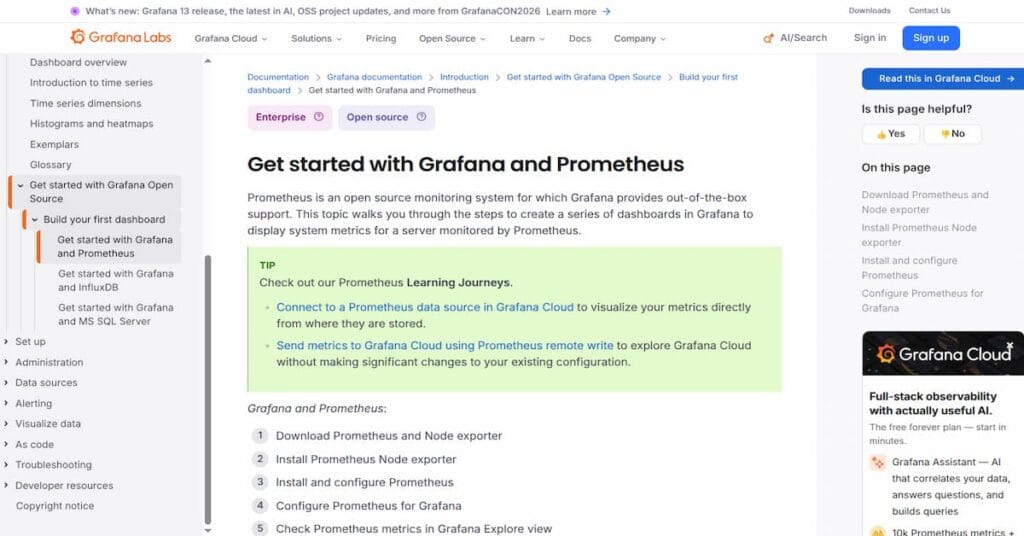
Prometheus and Grafana form the most widely deployed open-source monitoring stack. For ScyllaDB, teams deploy the scylla_exporter to scrape metrics from ScyllaDB nodes and expose them in Prometheus format. Grafana visualizes these metrics through custom dashboards. This combination gives complete control over data retention, query performance, and alerting logic.
Key Features:
- Full control over metric retention, scrape intervals, and query federation
- ScyllaDB exporter surfaces per-shard latency, compaction progress, cache statistics, and table-level metrics
- Grafana supports custom dashboards tailored exactly to your ScyllaDB deployment topology
- Alert rules via Prometheus Alertmanager with routing to Slack, PagerDuty, or custom webhooks
- No vendor dependency: entirely self-hosted with no external data transfer
Pricing: Free and open source. Infrastructure costs scale with metric cardinality and retention period.
Pros:
- Zero licensing cost and no vendor lock-in
- Complete flexibility to customize dashboards, alerts, and data retention policies
- Large community with extensive documentation and pre-built ScyllaDB dashboard templates
- Runs entirely within your infrastructure for full data sovereignty
Cons:
- Requires significant operational expertise to deploy, tune, and maintain at scale
- No built-in trace correlation or log aggregation without adding Tempo and Loki
- High cardinality metrics from large ScyllaDB clusters can cause Prometheus storage and query performance issues
- Alert fatigue is common without careful threshold tuning and noise reduction strategies
Best for: Engineering teams with strong DevOps capability who want maximum flexibility and control over ScyllaDB monitoring without SaaS costs.
4. Datadog
Datadog provides managed cloud monitoring with a ScyllaDB integration that collects metrics via the Datadog Agent. The platform correlates ScyllaDB performance with application traces, logs, and infrastructure monitoring signals across your entire stack. Datadog’s 700+ integrations make it easy to add ScyllaDB visibility to existing multi-cloud environments.
Key Features:
- Pre-built ScyllaDB dashboard tracks node health, query latency, compaction status, and error rates
- Automatic anomaly detection flags unusual patterns in ScyllaDB metrics without manual threshold setting
- Correlates ScyllaDB slow queries with APM traces to show which application endpoints caused database load
- Log aggregation captures ScyllaDB logs alongside application and infrastructure logs in unified search
- Alerting routes ScyllaDB issues to Slack, PagerDuty, or OpsGenie with customizable escalation policies
Pricing: Infrastructure monitoring starts at $15/host/month. Custom metrics billed separately at $0.05 per 100 custom metrics. APM adds $31/host/month for trace ingestion.
Pros:
- Fully managed SaaS eliminates monitoring infrastructure overhead
- Deep integration ecosystem covers ScyllaDB plus 700+ other technologies in one platform
- Strong APM correlation links ScyllaDB performance directly to application behavior
- Built-in anomaly detection reduces manual alert threshold tuning
Cons:
- Cost scales rapidly with cluster size: 50 ScyllaDB nodes at $15/host = $750/month for infrastructure monitoring alone before metrics or traces
- Per-host pricing punishes horizontal scaling: doubling nodes doubles base monitoring cost
- SaaS-only deployment incompatible with strict data residency requirements
- Custom metrics from ScyllaDB can trigger unexpected cost increases if cardinality is high
Best for: Multi-cloud enterprises already using Datadog who want to add ScyllaDB monitoring without deploying separate tooling.
Pricing is based on publicly available information as of January 2026. Enterprise discounts, custom contracts, and negotiated rates are not reflected here.
5. New Relic

New Relic offers full-stack observability with ScyllaDB monitoring via Prometheus remote write integration. Teams send ScyllaDB metrics from scylla_exporter to New Relic’s managed platform, where they are correlated with application traces, logs, and infrastructure data. New Relic’s NRQL query language enables custom dashboards and alerts across all telemetry types.
Key Features:
- Prometheus remote write integration ingests ScyllaDB metrics without custom agent installation
- Correlates ScyllaDB query performance with distributed traces and error tracking
- NRQL query language creates custom dashboards combining ScyllaDB metrics with application data
- Alert conditions trigger on ScyllaDB metrics, trace error rates, or composite conditions across both
- Unlimited users at flat data ingestion pricing eliminates per-seat access restrictions
Pricing: 100 GB/month data ingest free, then $0.40/GB beyond free tier. No per-host or per-user charges.
Pros:
- Managed platform removes monitoring infrastructure burden
- Unlimited user access model scales team collaboration without seat costs
- Strong distributed tracing correlates ScyllaDB performance with application behavior
- Flexible NRQL query language supports complex custom analytics
Cons:
- $0.40/GB pricing higher than competitors: 10 TB monthly ScyllaDB telemetry = $4,000/month
- Prometheus remote write adds operational complexity vs. native integrations
- NRQL query language creates lock-in: dashboards and alerts not portable to other tools
- SaaS-only architecture incompatible with on-prem or air-gapped deployments
Best for: Teams already using New Relic for APM who want to add ScyllaDB visibility without deploying separate monitoring infrastructure.
Pricing based on publicly available information as of January 2026. Enterprise discounts, custom contracts, and negotiated rates are not reflected here.
6. Grafana Cloud
Grafana Cloud provides managed Prometheus, Grafana, and Loki as a service. Teams deploy scylla_exporter to send ScyllaDB metrics to Grafana Cloud’s Prometheus endpoint, then visualize them using Grafana’s dashboard builder. The platform eliminates self-hosting overhead while preserving the flexibility of the open-source Grafana ecosystem.
Key Features:
- Managed Prometheus storage removes the operational burden of scaling and retention management
- Native scylla_exporter compatibility ingests ScyllaDB metrics without custom agents
- Grafana dashboard builder supports full customization using ScyllaDB metrics
- Alerting via Grafana Alerting sends notifications to Slack, PagerDuty, or custom webhooks
- OpenTelemetry integration adds trace and log correlation alongside ScyllaDB metrics
Pricing: Free tier includes 10,000 metric series, 50 GB logs, 50 GB traces. Pro plan starts at $8/month plus usage-based billing for metrics, logs, and traces.
Pros:
- Managed service removes Prometheus and Grafana operational overhead
- Lower cost than enterprise SaaS for small to mid-size ScyllaDB deployments
- Full Grafana dashboard flexibility preserved in managed environment
- OpenTelemetry support enables unified metrics, traces, and logs
Cons:
- Metrics series limits in the free tier can be exceeded quickly by large ScyllaDB clusters
- Usage-based billing becomes unpredictable as metric cardinality scales
- SaaS-only model incompatible with strict data residency requirements
- No built-in ScyllaDB-specific dashboards: requires manual setup
Best for: Teams comfortable with Grafana who want managed infrastructure without enterprise SaaS pricing.
Pricing based on publicly available information as of January 2026. Enterprise discounts, custom contracts, and negotiated rates are not reflected here.
7. Netdata
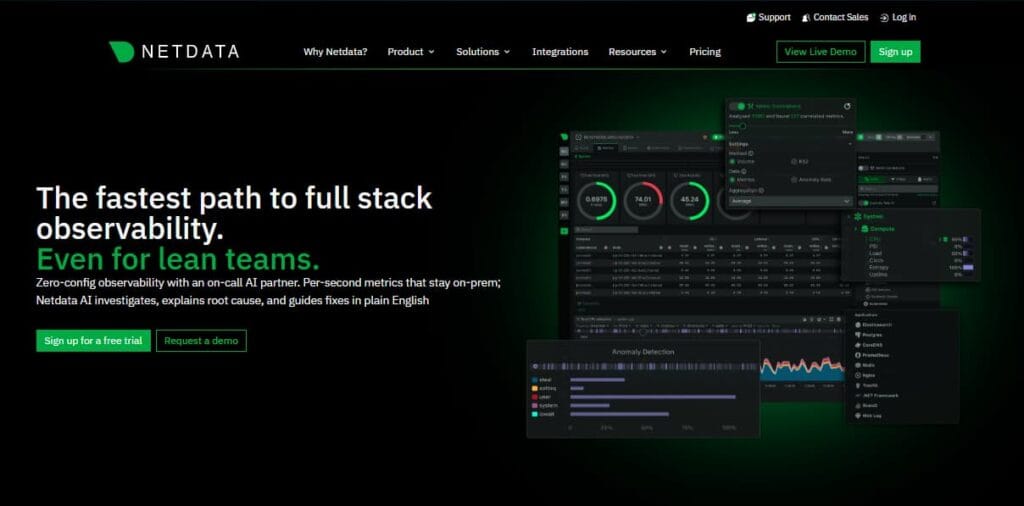
Netdata provides real-time monitoring with per-second granularity. Its native ScyllaDB collector gathers node-level metrics and streams them to Netdata Cloud or self-hosted Netdata parent nodes. The platform emphasizes immediate visibility over historical analysis, making it well-suited for troubleshooting active incidents.
Key Features:
- Native ScyllaDB collector gathers metrics with 1-second granularity for real-time visibility
- Auto-detection discovers ScyllaDB nodes without manual configuration
- Pre-built ScyllaDB dashboards track node health, compaction, cache hit rates, and query latency
- Anomaly detection highlights unusual metric patterns without manual threshold setting
- Low resource footprint: minimal CPU and memory overhead on monitored nodes
Pricing: Free and open source for self-hosted deployment. Netdata Cloud starts at $20/node/month for managed infrastructure.
Pros:
- Real-time 1-second metrics granularity reveals transient performance issues other tools miss
- Low overhead agent runs efficiently even on resource-constrained nodes
- Auto-detection reduces configuration complexity for ScyllaDB clusters
- Free open-source option for teams willing to self-host
Cons:
- Short default retention (1 hour) limits historical analysis without external storage integration
- Limited correlation with application traces: primarily infrastructure-focused
- Per-node pricing for Netdata Cloud becomes expensive for large ScyllaDB clusters
- Less comprehensive ScyllaDB-specific signal depth compared to ScyllaDB Monitoring Stack
Best for: Teams troubleshooting active ScyllaDB performance issues who need real-time visibility with minimal configuration overhead.
Pricing based on publicly available information as of January 2026. Enterprise discounts, custom contracts, and negotiated rates are not reflected here.
8. Dynatrace
Dynatrace delivers AI-assisted observability with automatic root cause analysis. Its ScyllaDB monitoring uses OneAgent to collect metrics and correlate them with application traces, infrastructure health, and user experience data. Dynatrace’s Davis AI engine automatically identifies performance anomalies and suggests remediation.
Key Features:
- OneAgent auto-discovers ScyllaDB nodes and begins metric collection without manual configuration
- Davis AI correlates ScyllaDB performance degradation with application traces and infrastructure events
- Automatic baseline learning eliminates manual alert threshold tuning
- Full stack correlation links ScyllaDB query latency to specific application endpoints and user sessions
- On-prem and SaaS deployment options support varied compliance requirements
Pricing: Host-based licensing starts around $74/host/month. Full stack monitoring with AI features typically $0.08 per GiB ingested plus host fees.
Pros:
- AI-driven root cause analysis reduces mean time to resolution for ScyllaDB incidents
- Automatic discovery and baseline learning minimize configuration overhead
- Full stack correlation reveals impact of ScyllaDB performance on user experience
- On-prem deployment option supports data residency requirements
Cons:
- High cost for large ScyllaDB clusters: 50 nodes at $74/host = $3,700/month before data ingestion fees
- Complex pricing model with host fees plus ingestion charges makes budgeting difficult
- OneAgent overhead is higher than lightweight exporters like scylla_exporter
- AI features require substantial telemetry volume to be effective: less useful for small deployments
Best for: Large enterprises with complex ScyllaDB deployments who value AI-assisted troubleshooting and have budget for premium tooling.
Pricing based on publicly available information as of January 2026. Enterprise discounts, custom contracts, and negotiated rates are not reflected here.
9. Elastic Observability
Elastic Observability integrates ScyllaDB monitoring into the ELK stack via Metricbeat. Teams already using Elasticsearch for logs can add ScyllaDB metrics to the same platform, enabling unified search across logs, metrics, and APM traces. Elastic’s search capabilities make it well-suited for ad hoc investigation of ScyllaDB performance issues.
Key Features:
- Metricbeat ScyllaDB module collects node metrics and ships them to Elasticsearch
- Unified search across ScyllaDB metrics, application logs, and distributed traces in Kibana
- Pre-built Kibana dashboards visualize ScyllaDB cluster health and performance trends
- Alerting on ScyllaDB metrics via Elasticsearch query DSL with notification routing
- Self-hosted or Elastic Cloud deployment options support varied infrastructure requirements
Pricing: Free and open source for self-hosted ELK stack. Elastic Cloud starts at $99/month for the standard tier with usage-based billing for storage and compute.
Pros:
- Unified platform for teams already using the ELK stack for application logs
- Powerful search capabilities enable ad hoc analysis of ScyllaDB performance data
- Self-hosted option eliminates ongoing licensing costs
- Flexible deployment model supports on-prem, cloud, or hybrid infrastructure
Cons:
- Requires Elasticsearch operational expertise to deploy and tune at scale
- Metricbeat integration is less comprehensive than ScyllaDB native exporters
- High resource consumption for Elasticsearch clusters storing ScyllaDB metrics at scale
- Alert configuration via Elasticsearch query DSL steeper learning curve than other tools
Best for: Teams already operating ELK stack who want to add ScyllaDB metrics to existing log aggregation infrastructure.
Pricing based on publicly available information as of early 2026. Enterprise discounts, custom contracts, and negotiated rates are not reflected here.
How to Choose the Right ScyllaDB Monitoring Tool
Selecting a ScyllaDB monitoring tool depends on five key factors: ScyllaDB-specific signal depth, deployment model, total cost of ownership, existing observability stack, and operational capability.
ScyllaDB-specific signal depth: ScyllaDB Monitoring Stack provides the most comprehensive ScyllaDB-native visibility, including per-shard metrics, compaction backlog by table, and query performance broken down by consistency level. Generic observability platforms like Datadog and New Relic require Prometheus exporter integration and miss some ScyllaDB internal signals.
Deployment model: On-prem requirements eliminate SaaS-only tools like Datadog, New Relic, and Grafana Cloud immediately. Self-hosted options include ScyllaDB Monitoring Stack, Prometheus + Grafana, CubeAPM, Netdata, and Elastic. Hybrid needs favor CubeAPM or Dynatrace, which support both models.
Total cost of ownership: For large ScyllaDB clusters, per-host pricing from Datadog and Dynatrace scales poorly. A 50-node cluster on Datadog infrastructure monitoring alone costs $750/month before metrics or traces. Ingestion-based pricing from CubeAPM ($0.20/GB) or New Relic ($0.40/GB) scales more predictably. Open source options like ScyllaDB Monitoring Stack eliminate licensing costs but require infrastructure and operational investment.
Existing observability stack: Teams already using Datadog, New Relic, or Elastic for application monitoring should evaluate adding ScyllaDB to the same platform before introducing new tooling. Unified visibility across application traces and database metrics reduces context switching during incident response.
Operational capability: Self-hosted tools like ScyllaDB Monitoring Stack and Prometheus + Grafana require expertise in running monitoring infrastructure at scale. Managed platforms like Datadog and New Relic eliminate this overhead but trade operational burden for higher ongoing cost and data control constraints.
Decision framework: Start with deployment requirements. If on-prem is mandatory, narrow to ScyllaDB Monitoring Stack, Prometheus + Grafana, CubeAPM, Netdata self-hosted, or Elastic self-hosted. If SaaS is acceptable, evaluate total cost at your scale: model per-host pricing for 12 months vs. ingestion-based pricing. For teams needing unified application and database visibility, prioritize tools with strong trace correlation like CubeAPM, Datadog, New Relic, or Dynatrace. For maximum ScyllaDB signal depth regardless of other factors, ScyllaDB Monitoring Stack remains the reference implementation.
The biggest mistake teams make is underestimating Day 2 operational cost for self-hosted tools or total cost at scale for per-host SaaS pricing. Model both scenarios explicitly before committing.
Monitoring ScyllaDB with CubeAPM
CubeAPM monitors ScyllaDB clusters via native Prometheus integration, ingesting metrics from scylla_exporter without custom agents or proprietary instrumentation. The platform correlates ScyllaDB query latency directly with distributed application traces, showing exactly which service endpoints triggered slow queries. This unified view eliminates tool switching between database monitoring and application performance analysis.
CubeAPM runs inside your VPC or data center, keeping all ScyllaDB telemetry within your infrastructure. This deployment model satisfies data residency requirements and eliminates AWS/GCP egress fees that SaaS platforms incur when telemetry leaves your cloud. For teams running ScyllaDB alongside microservices on Kubernetes, CubeAPM provides Kubernetes monitoring that surfaces pod health, resource saturation, and deployment events in the same interface as ScyllaDB metrics.
Unlike per-host or per-metric pricing models, CubeAPM charges $0.20/GB for all ingested data with unlimited retention. A 20-node ScyllaDB cluster generating 500 GB monthly telemetry costs $75/month regardless of metric cardinality or query volume. This predictability helps teams budget observability costs as ScyllaDB deployments scale.
Migration from existing monitoring tools takes under an hour. CubeAPM’s Prometheus compatibility means existing scylla_exporter deployments continue working without modification. Pre-built dashboards surface ScyllaDB node health, compaction progress, and query performance immediately after connection. Alert templates cover common ScyllaDB issues: high latency, replication lag, and compaction backlog.
ScyllaDB generates hundreds of metrics per node across cache statistics, compaction state, query latency histograms, and per-table performance counters. CubeAPM’s unlimited retention preserves this telemetry indefinitely, enabling long term capacity planning and performance trend analysis without storage cost surprises. Historical data remains fully searchable at the same $0.20/GB rate as recent metrics.
For teams monitoring ScyllaDB alongside application code, CubeAPM provides the operational simplicity of managed SaaS with the data control and cost predictability of self-hosted deployment.
Monitoring ScyllaDB in production requires understanding per-shard performance characteristics, compaction backlog implications, and how query patterns stress specific nodes. The right monitoring tool surfaces these signals clearly enough to prevent incidents before they impact users. ScyllaDB Monitoring Stack delivers the deepest ScyllaDB-native visibility for teams comfortable operating their own monitoring infrastructure. CubeAPM provides unified database and application observability for teams needing trace correlation inside their own cloud. Datadog and New Relic suit enterprises prioritizing managed convenience over cost at scale. Prometheus + Grafana gives maximum flexibility to teams with strong DevOps capability.
The most common failure mode is deploying monitoring tools that lack ScyllaDB-specific signal depth. Generic infrastructure monitoring that only tracks CPU and memory misses compaction backlog, per-shard latency distribution, and query performance by consistency level. Without these signals, teams troubleshoot ScyllaDB incidents blind, relying on guesswork instead of data-driven root cause analysis.
Disclaimer: The information in this article reflects the latest details available at the time of publication and may change as technologies and products evolve. Features, pricing, and plan limits can change over time. Always verify the latest information directly with the vendor before making purchasing or deployment decisions.
Frequently Asked Questions
What is the best free ScyllaDB monitoring tool?
ScyllaDB Monitoring Stack is the most comprehensive free option, providing official ScyllaDB-specific dashboards, metrics, and alerts as an open-source bundle. Prometheus + Grafana with scylla_exporter offers maximum flexibility for teams comfortable building custom dashboards.
How does ScyllaDB monitoring differ from Cassandra monitoring?
ScyllaDB’s shard-per-core architecture requires monitoring per-shard latency distribution and scheduler saturation metrics that do not exist in Cassandra. ScyllaDB also eliminates JVM garbage collection monitoring since it is written in C++.
Can I monitor ScyllaDB with Datadog or New Relic?
Yes, both platforms support ScyllaDB via Prometheus integration. Datadog uses its agent to scrape scylla_exporter metrics. New Relic ingests metrics via Prometheus remote write. Neither provides ScyllaDB-native instrumentation equivalent to the ScyllaDB Monitoring Stack.
What metrics should I monitor for ScyllaDB performance?
Essential ScyllaDB metrics include per-shard read and write latency, compaction backlog by table, cache hit rates, coordinator saturation, replica sync lag, and stall detector events. Query-level metrics like slow query count and ALLOW FILTERING usage identify application issues.
Does CubeAPM support ScyllaDB monitoring?
Yes, CubeAPM monitors ScyllaDB via native Prometheus integration using scylla_exporter. It correlates ScyllaDB metrics with application traces and logs in a unified platform deployed inside your infrastructure.
How much does ScyllaDB monitoring cost at scale?
Cost depends on deployment model and metric volume. Open source tools like ScyllaDB Monitoring Stack incur only infrastructure costs. Per-host SaaS platforms like Datadog charge $15/host/month minimum. Ingestion-based platforms like CubeAPM charge $0.20/GB regardless of node count.
What is scylla_exporter and why do I need it?
scylla_exporter is the official Prometheus exporter for ScyllaDB that exposes cluster metrics in Prometheus format. Most monitoring tools, except the ScyllaDB Monitoring Stack, require it to collect ScyllaDB metrics.