










Redis cluster monitoring becomes non-negotiable at scale. A single slow query or a memory leak in one node can cascade across your entire cluster, degrading user experience for minutes before anyone notices. Without proper monitoring, teams discover bottlenecks only after they impact production, turning debugging into a multi-hour fire drill instead of a five-minute alert-to-resolution cycle.
According to the CNCF Annual Survey 2024, 87% of organizations use Redis or similar in-memory data stores in production, but only 41% report having comprehensive visibility into cache performance, replication lag, and memory utilization across distributed instances. That gap translates directly into slower incident response and higher infrastructure costs from over-provisioned nodes that are never right-sized because teams lack the metrics to optimize.
This guide compares 10 Redis cluster monitoring tools across open-source platforms, SaaS solutions, and self-hosted observability stacks. Each is evaluated on pricing transparency, deployment model, Redis-specific metric depth, and ease of integration with existing monitoring infrastructure.
Quick Comparison: 10 Redis Cluster Monitoring Tools at a Glance
| Tool | Best For | Pricing | Free Plan | Deployment |
|---|---|---|---|---|
| CubeAPM | Self-hosted, unified observability, cost-sensitive teams | $0.20/GB ingestion, unlimited users | 14-day trial | Self-hosted (vendor-managed) |
| Prometheus + redis_exporter | OTel-native teams, DIY monitoring | Free open source | Yes | Self-hosted |
| Grafana Cloud | Teams already using Grafana dashboards | Free tier, then usage-based | Yes | SaaS + self-hosted |
| Datadog | Multi-cloud enterprises, breadth over cost | $15/host/month + add-ons | 14-day trial | SaaS only |
| SolarWinds DPM | Enterprise Redis + database monitoring | Custom pricing, starts $1,995/year | 14-day trial | SaaS + hybrid |
| RedisInsight | Redis GUI and basic monitoring | Free | Yes | Desktop + self-hosted |
| eG Innovations | Infrastructure-heavy enterprises | Custom pricing | Demo available | SaaS + on-prem |
| New Relic | Broad observability platform users | $0.40/GB beyond 100 GB free | Free tier | SaaS only |
| Dynatrace | AI-automated triage, enterprise scale | Custom pricing, typically $0.20/GiB+ | 15-day trial | SaaS + self-hosted |
| Elastic APM | Teams already on the ELK stack | Free OSS, Elastic Cloud from $99/month | Yes | Self-hosted + cloud |
1. CubeAPM
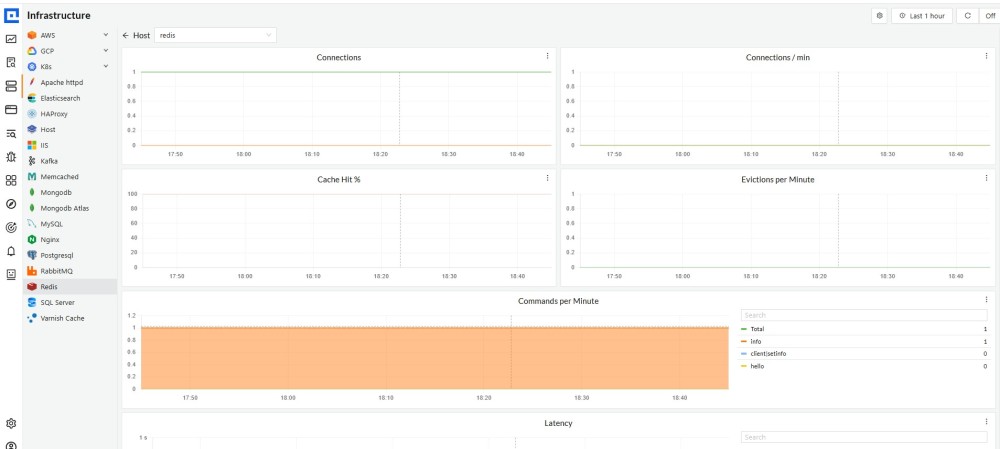
CubeAPM is a self-hosted, OpenTelemetry-native observability platform covering APM, infrastructure monitoring, logs, and Kubernetes with Redis cluster monitoring built in via Prometheus-compatible exporters and native OpenTelemetry support.
Key Features:
- Native Prometheus redis_exporter integration for Redis cluster metrics
- Pre-built dashboards for memory usage, replication lag, command latency, and eviction rates
- Correlate Redis metrics with application traces and logs in one unified view
- Self-hosted deployment keeps Redis telemetry data inside your VPC
- Unlimited retention with no per-host or per-user fees
Pricing:
$0.20/GB data ingestion, billed quarterly. No separate charges for Redis monitoring, dashboards, or alerting. Self-hosted deployment means infrastructure costs are under your control.
Pros:
- Single platform for Redis, Kubernetes, APM, and logs; eliminates tool sprawl
- Predictable pricing with no surprise host-based fees as Redis nodes scale
- Full data ownership and compliance by default with on-prem deployment
- Fast onboarding; RedisInsight metrics available in under an hour
Cons:
- Requires BYOC or on-prem infrastructure; your team manages the deployment
- Fewer out-of-the-box Redis integrations than SaaS incumbents
- AI-based smart sampling is not full AIOps anomaly detection
Best for:
DevOps teams running Redis clusters in regulated industries or cost-sensitive environments that need unified observability without SaaS data egress or unpredictable pricing.
2. Prometheus + redis_exporter
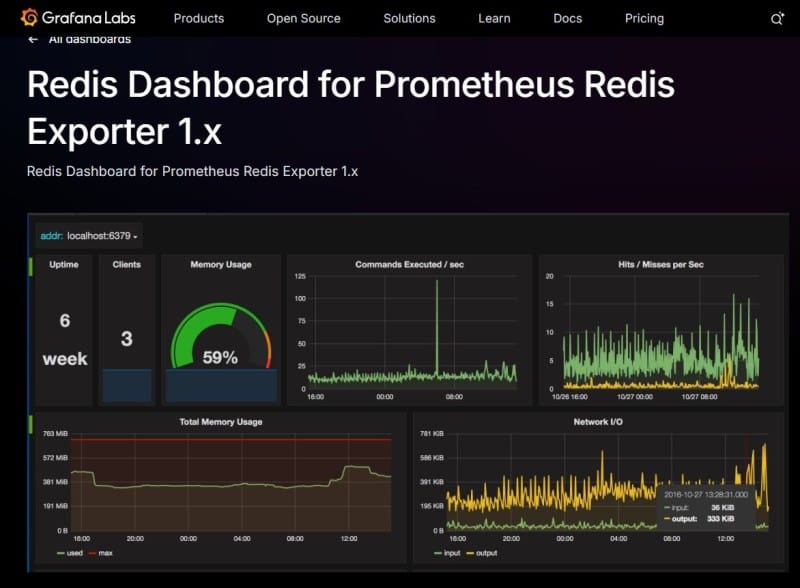
Prometheus is an open-source time series database built for infrastructure and application monitoring. The oliver006 redis_exporter is the most widely deployed open-source Redis metrics exporter, with native Prometheus integration and support for Redis Cluster, Redis Sentinel, and standalone instances.
Key Features:
- Collects 50+ Redis metrics, including memory usage, command stats, replication lag, and keyspace hits/misses
- Native Prometheus scrape endpoint; no agent installation required
- Works with Redis Cluster, Sentinel, and standalone deployments
- Fully open source with active community support
Pricing:
Free and open source. Infrastructure costs depend on your Prometheus deployment scale; typically $50–$200/month for a mid-size cluster on AWS EC2 or GCP Compute.
Pros:
- Zero licensing cost and no vendor lock-in
- Deep Redis metric coverage with community-maintained exporter
- Native Prometheus integration fits existing monitoring stacks
Cons:
- DIY setup and maintenance; requires PromQL knowledge and Grafana for visualization
- No built-in alerting beyond Prometheus Alertmanager (which requires separate configuration)
- Scaling Prometheus for high-cardinality Redis metrics requires manual tuning
Best for:
Engineering teams already using Prometheus and Grafana who want full control over Redis monitoring without SaaS dependencies.
3. Grafana Cloud
Grafana Cloud is a managed SaaS platform built on Grafana, Prometheus, Loki, and Tempo. It includes pre-built Redis monitoring dashboards and native support for Prometheus redis_exporter.
Key Features:
- Pre-configured Redis dashboards for cluster health, memory usage, and command latency
- Native Prometheus data source support for redis_exporter metrics
- Unified view of Redis metrics, application logs, and distributed traces
- Managed service eliminates self-hosting Prometheus and Grafana
Pricing:
Free tier includes 10,000 series and 50 GB logs per month. Paid plans start at $49/month for higher limits. Usage-based pricing applies beyond included quotas; typically $0.30/GB for logs and $8 per 1,000 active series.
Pros:
- Fast setup with pre-built Redis dashboards
- Managed service reduces operational burden compared to self-hosting
- Strong ecosystem of community plugins and integrations
Cons:
- Pricing scales unpredictably as Redis metrics increase
- Limited Redis-specific features compared to specialized APM tools
- Cloud-only deployment; no on-prem option
Best for:
Teams already using Grafana dashboards who want managed Redis monitoring without self-hosting Prometheus.
4. Datadog
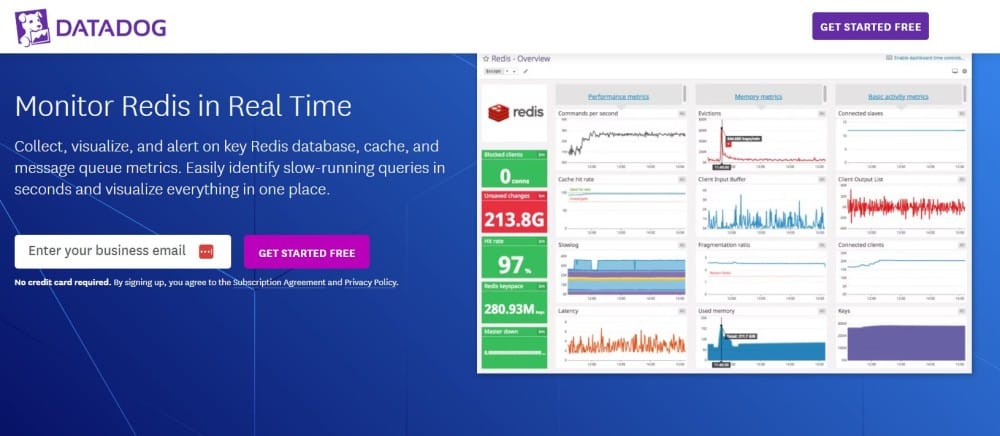
Datadog is a cloud-native SaaS observability platform covering infrastructure, APM, logs, and RUM. Its Redis integration collects metrics via the Datadog Agent and supports Redis Cluster, Sentinel, and standalone deployments.
Key Features:
- 50+ Redis metrics, including memory fragmentation, replication lag, and slow log analysis
- Pre-built Redis dashboards and anomaly detection
- Correlate Redis metrics with APM traces and logs in one platform
- Native support for Redis Cluster sharding and Sentinel failover monitoring
Pricing:
Infrastructure Monitoring starts at $15/host/month for basic metrics. APM costs $31/host/month for distributed traces. Redis monitoring falls under infrastructure pricing, but correlating with APM adds per-host charges. A 50-node Redis cluster costs $750/month for infrastructure monitoring alone before logs or custom metrics.
Pros:
- Comprehensive Redis metric coverage with minimal configuration
- Strong correlation between Redis performance and application traces
- Deep integration ecosystem with 1,000+ technologies
Cons:
- Per-host pricing compounds fast as Redis clusters scale
- Cloud-only deployment rules it out for data residency requirements
- Total cost becomes unpredictable when layering APM, logs, and custom metrics
Best for:
Large enterprises running multi-cloud infrastructure who prioritize breadth of integrations over cost predictability.
5. SolarWinds Database Performance Monitor (DPM)
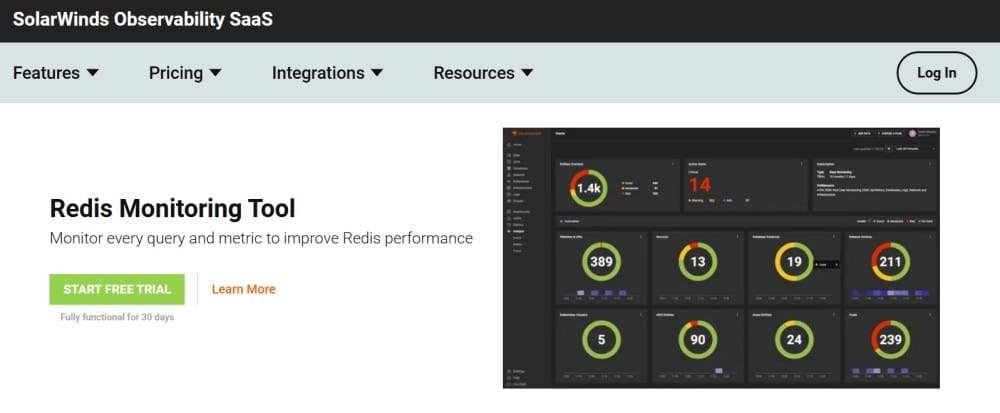
SolarWinds DPM is a SaaS database monitoring platform supporting Redis, MySQL, PostgreSQL, MongoDB, and Oracle. It focuses on query-level performance analysis and slow command detection.
Key Features:
- Redis query performance analysis with microsecond resolution
- Slow command detection and trending over time
- Pre-built dashboards for memory usage, replication lag, and command latency
- Integration with SolarWinds infrastructure monitoring products
Pricing:
Custom pricing, typically starts at $1,995/year for small deployments. Enterprise pricing is quote-based. SolarWinds does not publish transparent per-host or per-GB pricing; verify current rates directly with their sales team.
Pros:
- Deep query-level insight into Redis command performance
- Strong correlation between Redis metrics and database performance
- Enterprise support and compliance features
Cons:
- Opaque pricing model requires sales engagement
- SaaS-only deployment with no on-prem option
- Limited open source ecosystem compared to Prometheus-based tools
Best for:
Enterprise teams running multiple database types (Redis, MySQL, PostgreSQL) who need unified database performance monitoring.
6. Redis Insight
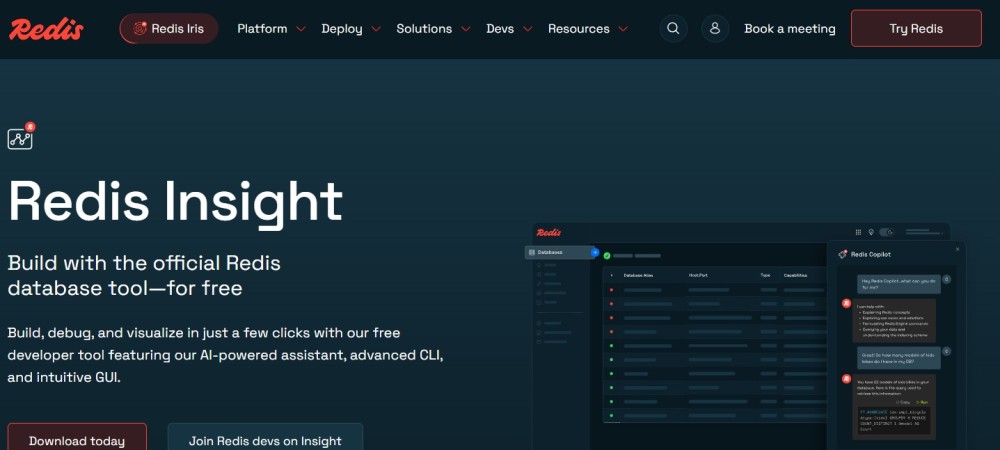
Redis Insight is a free desktop application and web-based GUI for Redis monitoring and data exploration. It supports Redis Cluster, Sentinel, and standalone instances with built-in performance metrics and slow log analysis.
Key Features:
- Real-time Redis metrics including memory usage, keyspace stats, and command latency
- Slow log viewer for identifying bottleneck commands
- Data browser for inspecting keys, values, and TTLs
- Native support for Redis Cluster topology visualization
Pricing:
Free for all features. No licensing cost or usage limits.
Pros:
- Zero cost and no vendor lock-in
- Native Redis Cluster support with topology visualization
- Desktop and web versions for flexible deployment
Cons:
- Basic alerting; no proactive anomaly detection or SLA tracking
- Limited historical data retention compared to time series databases
- Not designed for production-grade monitoring at enterprise scale
Best for:
Development teams and small production deployments that need basic Redis monitoring without operational complexity.
7. eG Innovations
eG Innovations is an enterprise infrastructure monitoring platform supporting Redis, Kubernetes, VMware, and cloud services. It focuses on automatic discovery and root cause analysis.
Key Features:
- Automatic Redis instance discovery across hybrid environments
- Pre-built dashboards for memory usage, replication lag, and command throughput
- Root cause analysis correlating Redis performance with infrastructure metrics
- Support for Redis Cluster and Sentinel deployments
Pricing:
Custom pricing based on infrastructure size. No public rate card; pricing starts from mid-market enterprise budgets, typically $10,000+ annually for production deployments.
Pros:
- Strong infrastructure correlation for hybrid cloud environments
- Automatic discovery reduces manual configuration
- Enterprise support and compliance features
Cons:
- High cost of entry for small and mid-size teams
- Opaque pricing model requires sales engagement
- Limited community ecosystem compared to open source tools
Best for:
Enterprise IT teams managing complex hybrid infrastructure who need unified monitoring across Redis, VMs, and cloud services.
8. New Relic

New Relic is a SaaS observability platform covering APM, infrastructure, logs, and RUM. Its Redis integration collects metrics via the New Relic Infrastructure agent.
Key Features:
- 30+ Redis metrics, including memory usage, command latency, and eviction rates
- Pre-built Redis dashboards with anomaly detection
- Correlate Redis metrics with APM traces and logs in one platform
- Native support for Redis Cluster and Sentinel deployments
Pricing:
New Relic charges $0.40/GB for data ingestion beyond the free 100 GB monthly allotment. Redis metrics typically add 500 MB to 2 GB per node per month depending on sampling frequency. A 50-node cluster generates 25–100 GB/month in Redis telemetry, costing $0–$40/month at baseline rates. APM and log correlation add separate per-GB charges.
Pros:
- Unified platform for Redis, APM, and logs
- Strong anomaly detection and alerting
- Free tier includes 100 GB/month data ingestion
Cons:
- Per-GB pricing scales unpredictably as Redis telemetry volume grows
- Cloud-only deployment with no on-prem option
- NRQL query language creates lock-in for dashboards and alerts
Best for:
Teams already using New Relic for APM who want to add Redis monitoring without introducing a separate tool.
9. Dynatrace
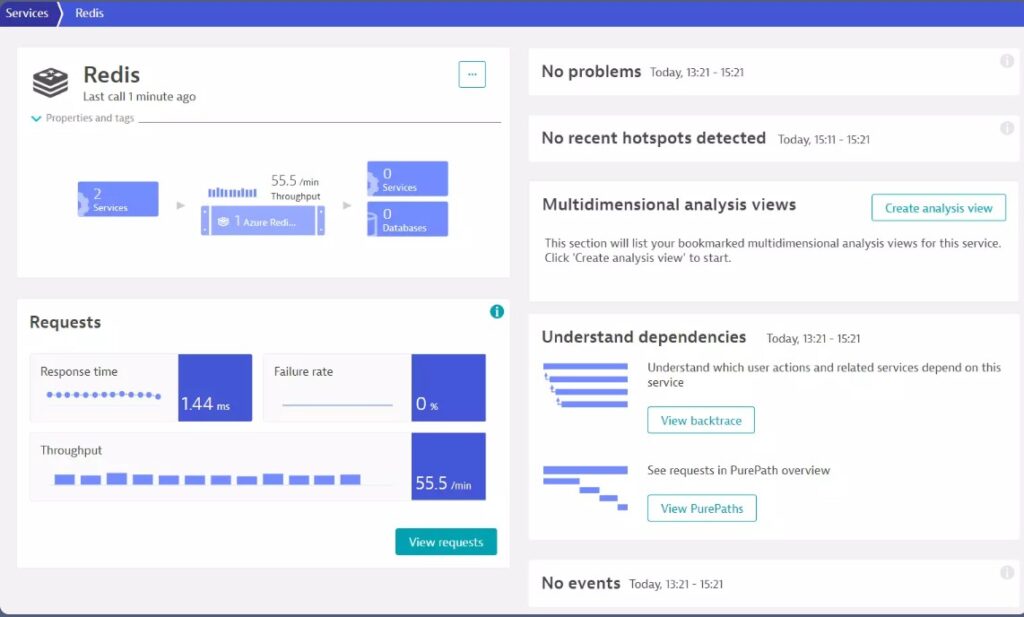
Dynatrace is an enterprise SaaS observability platform built on AI-automated root cause analysis. Its Redis monitoring integrates with infrastructure, APM, and log analytics.
Key Features:
- 40+ Redis metrics with automatic baseline learning and anomaly detection
- AI-assisted root cause analysis correlating Redis performance with application traces
- Pre-built Redis dashboards and custom metric support
- Native support for Redis Cluster and Sentinel failover monitoring
Pricing:
Custom pricing, typically $0.20/GiB or higher for full-stack monitoring. Enterprise contracts often start at $30,000+ annually. Redis monitoring falls under infrastructure pricing — verify current rates at Dynatrace’s pricing page.
Pros:
- Strong AI-automated root cause analysis
- Deep correlation between Redis metrics and application performance
- Enterprise support and compliance features
Cons:
- High cost of entry for small and mid-size teams
- Opaque pricing model requires sales engagement
- Cloud-first architecture with limited on-prem flexibility
Best for:
Enterprise teams running complex microservices architectures who need AI-automated Redis performance analysis.
10. Elastic APM
Elastic APM is part of the Elastic Stack (formerly ELK). It provides Redis monitoring via Metricbeat, the infrastructure metrics collector for Elasticsearch.
Key Features:
- 30+ Redis metrics collected via the Metricbeat Redis module
- Pre-built Redis dashboards in Kibana
- Unified storage in Elasticsearch for metrics, logs, and traces
- Native support for Redis Cluster and Sentinel deployments
Pricing:
Free for self-hosted Elastic Stack. Elastic Cloud starts at $99/month for managed Elasticsearch with 64 GB RAM and 480 GB storage. Redis monitoring falls under standard Metricbeat ingestion; no separate licensing cost.
Pros:
- Zero licensing cost for self-hosted deployments
- Strong correlation between Redis metrics and application logs
- Powerful Kibana query language for custom analysis
Cons:
- DIY setup and scaling require Elasticsearch expertise
- Metricbeat Redis module has fewer metrics than specialized exporters
- Self-hosted Elasticsearch can be resource-intensive at scale
Best for:
Teams already running the Elastic Stack who want to add Redis monitoring without introducing a separate tool.
How to Choose the Right Redis Cluster Monitoring Tool
Choosing the right Redis monitoring tool depends on five core factors: deployment model, pricing predictability, Redis-specific metric depth, integration with your existing stack, and team size.
Deployment model: SaaS, self-hosted, or hybrid?
If you have data residency requirements or run Redis in regulated industries (healthcare, finance, government), self-hosted tools like CubeAPM, Prometheus, or Elastic APM keep telemetry data inside your VPC. SaaS platforms like Datadog and New Relic simplify operations but send Redis metrics outside your infrastructure.
Pricing: per-host, per-GB, or open source?
Per-host pricing (Datadog at $15/host/month) compounds fast as Redis clusters scale. Per-GB pricing (CubeAPM at $0.15/GB, New Relic at $0.40/GB) is predictable if you know your telemetry volume. Open source tools (Prometheus, Elastic) eliminate licensing costs but add infrastructure and maintenance overhead.
Redis-specific metrics: how deep do you need to go?
Basic monitoring (memory usage, command latency, replication lag) is available in every tool. Advanced features like slow log analysis, keyspace pattern detection, and per-shard metrics require specialized platforms. Prometheus redis_exporter offers the deepest metric coverage among open-source tools. SolarWinds DPM and Datadog lead among SaaS platforms.
Integration: does it fit your current stack?
If you already use Prometheus and Grafana, adding redis_exporter is a one-hour setup. If you already use Datadog for APM, enabling Redis monitoring requires minimal configuration. Introducing a standalone Redis tool creates operational overhead — choose platforms that unify Redis monitoring with your existing observability stack.
Team size and budget: DIY vs. managed?
Small teams (under 10 engineers) benefit from managed SaaS tools that eliminate operational burden. Mid-size teams (10–50 engineers) can justify self-hosted tools like CubeAPM or Elastic APM to control costs. Large enterprises (50+ engineers) often choose Datadog or Dynatrace for breadth of integrations despite higher costs.
Disclaimer: The information in this article reflects the latest details available at the time of publication and may change as technologies and products evolve. Features, pricing, and plan limits can change over time. Always verify the latest information directly with the vendor before making purchasing or deployment decisions.
Frequently Asked Questions
What is Redis cluster monitoring?
Redis cluster monitoring is the practice of tracking performance metrics, availability, and health across multiple Redis nodes in a distributed cluster. It measures memory usage, replication lag, command latency, and keyspace statistics to detect bottlenecks and failures before they impact production.
What are the most important Redis metrics to monitor?
Critical Redis metrics include memory usage and fragmentation ratio, command latency and throughput, replication lag between primary and replica nodes, eviction and expiration rates, keyspace hit and miss ratios, and connected client count. These metrics reveal performance bottlenecks, capacity planning needs, and replication health.
How does Prometheus monitor Redis clusters?
Prometheus monitors Redis using the redis_exporter, an open-source exporter that scrapes Redis metrics and exposes them as a Prometheus endpoint. The exporter collects 50+ metrics including memory stats, command latency, replication lag, and keyspace data. Prometheus scrapes these metrics at regular intervals and stores them in its time series database.
Can Grafana monitor Redis without Prometheus?
Yes, Grafana can monitor Redis using multiple data sources, including Elasticsearch (via Metricbeat Redis module), InfluxDB (via Telegraf Redis plugin), or direct Redis data source plugins. However, Prometheus with redis_exporter remains the most common and well-supported Redis monitoring stack in the Grafana ecosystem.
What is the difference between Redis monitoring and Redis GUI tools?
Redis GUI tools like RedisInsight focus on data exploration, key inspection, and manual query execution for development and debugging. Redis monitoring tools focus on continuous metric collection, alerting, and production performance analysis. GUI tools are developer-focused, while monitoring tools are operations-focused.
How much does Redis monitoring cost at scale?
Costs vary widely by tool and deployment model. Open source tools like Prometheus are free but require infrastructure (typically $50–$200/month for mid-size clusters). SaaS platforms charge per-host (Datadog at $15/host/month) or per-GB (CubeAPM at $0.20/GB, New Relic at $0.40/GB). A 50-node Redis cluster costs $750/month on Datadog vs. $0–$100/month with self-hosted Prometheus.
Does CubeAPM support Redis Cluster and Sentinel?
Yes, CubeAPM supports Redis Cluster and Sentinel deployments via native Prometheus redis_exporter integration. It collects all standard Redis metrics, including per-shard statistics, replication lag, and failover events. Pre-built dashboards surface Redis performance alongside APM traces and logs in one unified view.