










Hybrid cloud infrastructure is inherently complex. Your monitoring stack spans AWS, Azure, GCP, on-premises data centers, and edge locations all at once. A database might live in your private cloud while the application layer runs in AWS and the CDN sits in Azure. When something breaks, you need visibility across all of it without switching between seven different dashboards or stitching together fragmented telemetry.
According to the CNCF’s 2025 Annual Survey, 68% of organizations now run workloads across multiple cloud providers, and 42% maintain significant on-premises infrastructure alongside public cloud resources. That architectural reality is why hybrid cloud monitoring exists as its own category. Generic monitoring tools built for single cloud providers miss the cross-environment correlations that matter most during incidents.
This guide compares 9 hybrid cloud monitoring tools across deployment model, multi-cloud support, pricing transparency, and observability signal depth. Each tool is assessed on how well it handles the specific challenges of monitoring distributed infrastructure that spans public cloud, private cloud, and on-premises environments.
Quick Comparison: 9 Hybrid Cloud Monitoring Tools at a Glance
| Tool | Best For | Pricing Model | Deployment | Multi-Cloud Native? |
|---|---|---|---|---|
| CubeAPM | Teams that need full stack observability inside their own cloud with unified metrics, logs, traces, and infrastructure monitoring | $0.20/GB ingestion, unlimited retention | Self-hosted (vendor managed) | ✓ Yes |
| Datadog | Large enterprises needing breadth of integrations across 700+ technologies and managed SaaS delivery | Host-based $15–$31/host/month + add-ons | SaaS only | ✓ Yes |
| ScienceLogic SL1 | IT operations teams managing complex hybrid environments with ITOM and AIOps requirements | Custom enterprise pricing | SaaS + on-premises | ✓ Yes |
| Dynatrace | Enterprise teams wanting AI-driven automated root cause analysis across hybrid infrastructure | Host-based pricing starting ~$0.08/hour per host | SaaS + Managed | ✓ Yes |
| Grafana Cloud | Teams already using Prometheus, Loki, Tempo, or open source Grafana stacks | Free tier + usage-based Pro plans | SaaS + self-hosted OSS | ✓ Yes |
| New Relic | Teams that want managed observability with broad platform coverage but can accept SaaS-only deployment | $0.40/GB beyond 100 GB free, plus user seats | SaaS only | ✓ Yes |
| Splunk Observability | Enterprise security and compliance-heavy environments needing SIEM integration alongside monitoring | Host based $15+/host/month | SaaS + on-premises | ✓ Yes |
| SolarWinds SAM | Mid-market IT teams monitoring traditional infrastructure alongside cloud workloads | Perpetual license ~$3,000+ or subscription $165/month | On-premises + hybrid | Partial |
| Elastic Observability | Teams already invested in the ELK stack who want to extend logs into full observability | Free OSS, Elastic Cloud starts $99/month | Self-hosted + SaaS | ✓ Yes |
Pricing based on publicly available information as of early 2026. Enterprise discounts, custom contracts, and negotiated rates are not reflected here.
What Makes Hybrid Cloud Monitoring Different from Single Cloud Monitoring
Hybrid cloud monitoring solves three problems that single cloud tools cannot.
First, it eliminates tool sprawl. When your infrastructure spans AWS, Azure, and an on-premises VMware cluster, using CloudWatch for AWS, Azure Monitor for Azure, and a separate SNMP-based tool for VMware means you are managing three disconnected systems. Hybrid cloud monitoring platforms aggregate telemetry from all three into one unified view.
Second, it preserves cross-environment correlation. A slow API response in AWS might actually be caused by a database connection pool exhaustion in your on-premises PostgreSQL cluster. Single cloud tools cannot trace that dependency. Hybrid monitoring platforms can because they ingest telemetry from both sides.
Third, it respects data residency requirements. Many regulated industries, healthcare, finance, and government cannot send telemetry outside their own infrastructure. Hybrid cloud monitoring tools with on premises or self hosted deployment options allow those teams to monitor cloud workloads without exporting telemetry to a third party SaaS platform.
A 2025 survey by Flexera found that 92% of enterprises have a multi-cloud strategy, but only 34% said their monitoring tools provide adequate visibility across all environments. That gap is what hybrid cloud monitoring platforms are built to close.
1. CubeAPM

Best for: DevOps and platform teams that want full stack observability inside their own cloud without SaaS data egress, pricing sprawl, or DIY self-hosting overhead.
CubeAPM is a self-hosted, OpenTelemetry native observability platform covering APM, logs, infrastructure, Kubernetes, RUM, synthetic monitoring, and error tracking. It runs inside your cloud or on-premises, so there is no data egress and no external dependency during incidents. Your monitoring stays up even if the internet does not.
Recognized as a High Performer in G2’s Spring 2026 APM Grid Report and ranked among the easiest-to-use APM tools on G2. Trusted by redBus (world’s largest bus aggregator, part of NASDAQ-listed MakeMyTrip operating in 8+ countries), Delhivery ($3.5B valuation), Mamaearth ($1.2B valuation), Policybazaar, Practo, Ola, and others.
Key Features:
- Full-stack unified monitoring covering APM, logs, infrastructure, Kubernetes, Kafka, RUM, synthetic monitoring, and error tracking
- OpenTelemetry native from day one with no proprietary agents
- Self-hosted and BYOC deployment for complete data sovereignty
- Unlimited data retention with no egress surprises
- AI-based Smart Sampling that retains traces that matter while reducing storage overhead
- Direct engineering support via WhatsApp and Slack channels
Pricing:
CubeAPM uses a single billing dimension: $0.20/GB of data ingested. No per-host fees, no per-user seats, no add-on charges for features. A 100-node hybrid cluster ingesting 10TB/month of telemetry (logs, traces, metrics) costs $1,500/month plus your own infrastructure costs to run the platform.
This estimate models a production-ready setup with high availability. A smaller or simpler deployment may cost significantly less.
Pros:
- Simplest pricing model and lowest cost at scale
- Multi-agent compatible; works alongside Datadog, New Relic, Elastic, and Prometheus agents
- Complete data ownership with no telemetry leaving your infrastructure
- Unlimited retention and predictable pricing with no egress charges
- Engineering-level support that responds in minutes during incidents
- Fast onboarding with zero-downtime migration documented by multiple customers
Cons:
- Requires BYOC or on-premises deployment, meaning your team manages the infrastructure
- No autonomous anomaly detection (AI-based smart sampling is not full AIOps alerting)
- SSO/RBAC less mature than enterprise SaaS incumbents
Best for: Teams that need full control over their observability data, want predictable costs at scale, and can manage infrastructure deployment. Particularly strong for regulated industries, data sovereignty requirements, and teams burned by SaaS vendor lock-in.
2. Datadog
Best for: Large enterprises needing breadth of integrations across 700+ technologies with managed SaaS delivery and no infrastructure overhead.
Datadog is a cloud-based monitoring and analytics platform that provides infrastructure monitoring, APM, log management, RUM, and security monitoring. It offers native support for AWS, Azure, GCP, and on-premises infrastructure through agents and integrations. Datadog’s strength is integration breadth. It connects to more technologies out of the box than any competitor.
Key Features:
- 1000+ out-of-the-box integrations covering cloud providers, databases, containers, and SaaS tools
- Unified dashboards for metrics, logs, traces, and security signals
- AI-powered anomaly detection and automated alerting
- Service maps and distributed tracing for microservices
- Cloud cost management and optimization tools
- Compliance and security monitoring with threat detection
Pricing:
Datadog uses host-based pricing with separate charges for each product. Infrastructure Monitoring starts at $15/host/month for 15-month retention and scales to $31/host/month for enterprise features. APM costs an additional $31/host/month. Logs start at $0.10/GB ingested plus $1.70/million events indexed. A 100-host hybrid environment with APM and 10TB/month logs costs approximately $8,000–$12,000/month before custom metrics, RUM, or synthetics.
Pricing based on publicly available information as of early 2026. Enterprise discounts, custom contracts, and negotiated rates are not reflected here.
Pros:
- Broadest integration ecosystem with 700+ supported technologies
- Fully managed SaaS platform with no infrastructure burden
- Strong APM and distributed tracing capabilities
- Advanced anomaly detection and automated alerting
- Extensive documentation and community support
Cons:
- Cost scales unpredictably as infrastructure and telemetry volume grow
- No on-premises deployment option for data sovereignty requirements
- Separate billing for each product (infrastructure, APM, logs, RUM) creates budget complexity
- Engineers on Reddit have documented bills jumping unexpectedly during traffic spikes source
Best for: Large enterprises with budget flexibility that prioritize integration breadth and managed delivery over cost predictability.
3. ScienceLogic SL1
Best for: IT operations teams managing complex hybrid environments with ITOM and AIOps requirements across thousands of devices and services.
ScienceLogic SL1 is an AIOps platform designed for hybrid cloud monitoring at enterprise scale. It provides unified visibility across public clouds, private clouds, virtualization solutions, serverless, microservices, software-defined networks, servers, storage, and IoT infrastructure. SL1 is built for IT operations teams that need to monitor everything in one platform.
Key Features:
- Unified visibility across 500+ technologies in hybrid IT ecosystems
- Real-time operational data lake by discovering, collecting, and normalizing telemetry
- Automated discovery and dependency mapping across cloud and on-premises environments
- AIOps-powered anomaly detection and event correlation
- Compliance and cost optimization capabilities
- Integration with ITSM platforms like ServiceNow
Pricing:
ScienceLogic uses custom enterprise pricing based on the number of managed devices, services, and cloud resources. Pricing is not publicly disclosed. Based on G2 reviews, typical enterprise deployments start around $50,000 annually and scale with infrastructure size.
Pricing is based on publicly available information as of early 2026. Enterprise discounts, custom contracts, and negotiated rates are not reflected here.
Pros:
- Comprehensive coverage of hybrid infrastructure with 500+ integrations
- Strong AIOps capabilities for event correlation and noise reduction
- Single platform for ITOM, monitoring, and automation
- Both SaaS and on-premises deployment options
- Purpose-built for large-scale enterprise IT operations
Cons:
- Complex setup and steep learning curve reported by users on G2
- Custom pricing makes cost evaluation difficult before engagement
- Overkill for smaller teams or those not managing enterprise-scale complexity
- User interface described as overwhelming by some reviewers source
Best for: Enterprise IT operations teams managing thousands of devices across hybrid cloud, on-premises, and edge infrastructure who need unified ITOM and AIOps in one platform.
4. Dynatrace
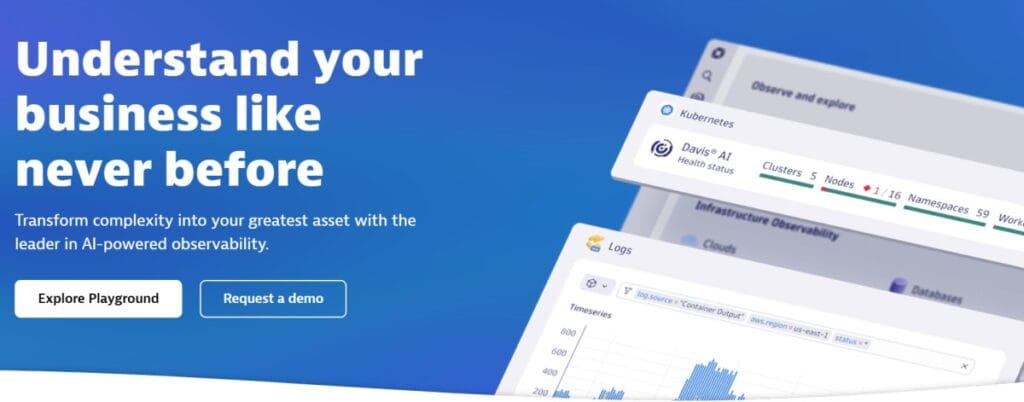
Best for: Enterprise teams wanting AI-driven automated root cause analysis across hybrid infrastructure without manual dashboard tuning.
Dynatrace is an AI-powered observability platform that provides automatic discovery, instrumentation, and root cause analysis across applications, infrastructure, and user experience. Its core differentiator is Davis AI, which automatically baselines performance, detects anomalies, and correlates issues across distributed systems. Dynatrace supports hybrid cloud with agents for AWS, Azure, GCP, VMware, Kubernetes, and traditional on-premises infrastructure.
Key Features:
- Davis AI for automated anomaly detection and root cause analysis
- Automatic discovery and instrumentation with OneAgent
- Full stack monitoring across applications, infrastructure, and user experience
- Distributed tracing and service dependency mapping
- Cloud cost and resource optimization recommendations
- Support for both SaaS and Managed deployment models
Pricing:
Dynatrace uses host-based pricing. Infrastructure Monitoring starts around $0.08/hour per host (~$58/host/month). Full stack monitoring with APM adds approximately $0.10/hour per host (~$73/host/month). Additional charges apply for digital experience monitoring, log ingestion ($0.20/GiB), and synthetic monitoring. A 100-host hybrid environment with full stack monitoring and 10TB/month logs costs approximately $10,000–$15,000/month.
Pricing based on publicly available information as of early 2026. Enterprise discounts, custom contracts, and negotiated rates are not reflected here.
Pros:
- Industry-leading AI-driven root cause analysis that reduces MTTR
- Automatic discovery and instrumentation reduces manual setup
- Unified platform covering applications, infrastructure, logs, and user experience
- Strong support for Kubernetes and cloud native architectures
- Both SaaS and Managed (on-premises) deployment options
Cons:
- Premium pricing makes it one of the most expensive options at scale
- Complexity of features can overwhelm smaller teams
- Learning curve for maximizing Davis AI capabilities
- Some users report slow support response times on G2 source
Best for: Large enterprises with complex hybrid infrastructure that need automated root cause analysis and can justify premium pricing for reduced MTTR.
5. Grafana Cloud
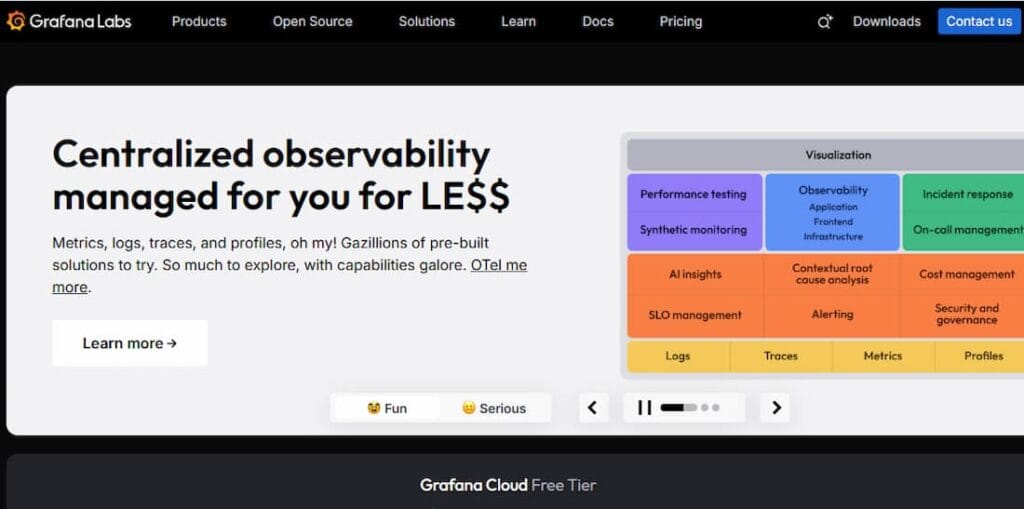
Best for: Teams already using Prometheus, Loki, Tempo, or open source Grafana stacks who want managed hosting with multi-cloud support.
Grafana Cloud is the managed SaaS offering built on the open source Grafana observability stack. It provides hosted Prometheus for metrics, Loki for logs, Tempo for traces, and Grafana for visualization. Grafana Cloud supports hybrid environments through remote write from on-premises Prometheus instances and agent-based telemetry collection from AWS, Azure, GCP, and private infrastructure.
Key Features:
- Managed hosting of Prometheus, Loki, Tempo, and Grafana
- Native Kubernetes monitoring through Grafana Agent
- Multi-cloud support with integrations for AWS, Azure, GCP, and on-premises
- Alerting and incident management through Grafana OnCall
- Plugin ecosystem with 200+ data source integrations
- Free tier with generous limits for small teams
Pricing:
Grafana Cloud uses usage-based pricing. The Free tier includes 10,000 metrics, 50 GB logs, and 50 GB traces. Pro plans charge $8/active series/month for metrics, $0.50/GB for logs, and $0.50/GB for traces. A 100-host hybrid environment with 500,000 active metrics and 10TB logs/traces costs approximately $4,000–$6,000/month.
Grafana Cloud pricing page
Pricing based on publicly available information as of early 2026. Enterprise discounts, custom contracts, and negotiated rates are not reflected here.
Pros:
- Strong open source foundation with no vendor lock-in
- Flexible deployment model supporting SaaS and self-hosted
- Best-in-class visualization and dashboard capabilities
- Active community and extensive plugin ecosystem
- Generous free tier for small teams and startups
Cons:
- Requires understanding of Prometheus, Loki, and Tempo to maximize value
- Higher operational complexity compared to fully managed platforms
- Alerting and anomaly detection less sophisticated than AI-driven competitors
- Costs can escalate quickly with high cardinality metrics
Best for: Teams already invested in the Prometheus ecosystem who want managed hosting and multi-cloud support without sacrificing open source flexibility.
6. New Relic

Best for: Teams that want managed observability with broad platform coverage but can accept SaaS-only deployment and consumption-based pricing.
New Relic is a cloud-based observability platform providing APM, infrastructure monitoring, log management, RUM, synthetic monitoring, and error tracking. It supports hybrid cloud through agents for AWS, Azure, GCP, Kubernetes, and on-premises infrastructure. New Relic’s strength is ease of use and quick time to value for teams that do not need on-premises deployment.
Key Features:
- Unified observability covering applications, infrastructure, logs, and user experience
- Automatic instrumentation for popular languages and frameworks
- Distributed tracing and service maps
- Custom dashboards with NRQL query language
- Alerting and incident intelligence
- Integration with 800+ technologies
Pricing:
New Relic uses consumption-based pricing. Data ingestion costs $0.40/GB beyond 100 GB free per month. Full platform user seats cost $99/user/month or $549/user/month for enterprise. A 100-host hybrid environment with 10TB/month telemetry and 10 users costs approximately $4,000–$6,000/month for data plus $990–$5,490/month for users.
New Relic pricing page
Pricing based on publicly available information as of early 2026. Enterprise discounts, custom contracts, and negotiated rates are not reflected here.
Pros:
- Fast time to value with automatic instrumentation
- Broad platform coverage in a single managed SaaS offering
- Strong APM and distributed tracing capabilities
- Generous 100 GB free data ingestion per month
- Good documentation and support
Cons:
- SaaS only deployment means no option for data residency requirements
- User seat costs compound quickly as teams grow
- NRQL query language creates vendor lock-in
- Costs can escalate unpredictably with data volume source
Best for: Mid-market teams that prioritize ease of use and managed delivery over cost predictability and can accept SaaS only architecture.
7. Splunk Observability Cloud
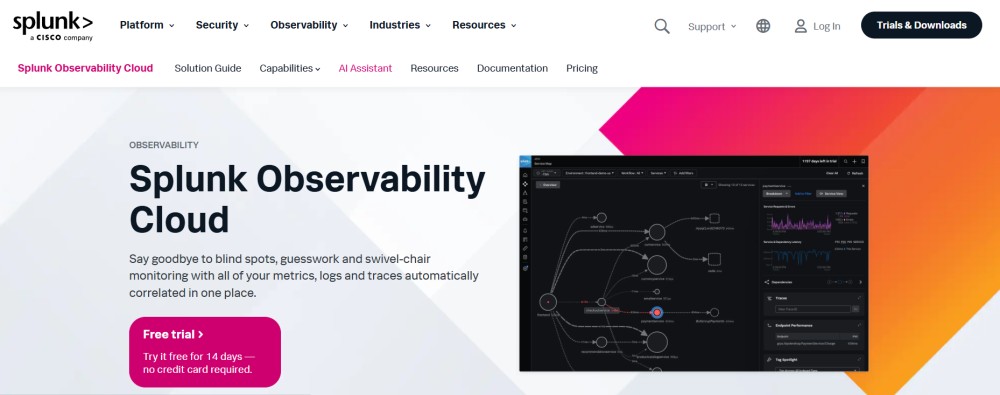
Best for: Enterprise security- and compliance-heavy environments needing SIEM integration alongside monitoring across hybrid infrastructure.
Splunk Observability (formerly SignalFx) provides infrastructure monitoring, APM, RUM, and synthetic monitoring with deep integration into Splunk’s broader security and analytics platform. It supports hybrid cloud through agents for AWS, Azure, GCP, Kubernetes, and traditional data center infrastructure. Splunk’s differentiator is unifying observability with security monitoring and log analytics.
Key Features:
- Infrastructure and APM monitoring across cloud and on-premises environments
- Real-time metrics with high cardinality support
- Distributed tracing and service dependency mapping
- Integration with Splunk Enterprise for logs and SIEM correlation
- NoSample distributed tracing that captures all transactions
- Custom dashboards and alerting
Pricing:
Splunk Observability uses host-based pricing. Infrastructure Monitoring starts at $15/host/month. APM adds $25/host/month. RUM and Synthetics are priced separately. A 100-host hybrid environment with APM costs approximately $4,000/month before logs or SIEM integration.
Splunk pricing page
Pricing is based on publicly available information as of early 2026. Enterprise discounts, custom contracts, and negotiated rates are not reflected here.
Pros:
- Strong integration with Splunk Enterprise for unified logs, monitoring, and security
- High cardinality metrics with no sampling
- NoSample APM captures all traces without sampling decisions
- Both SaaS and on-premises deployment options
- Purpose-built for enterprise security and compliance
Cons:
- Expensive at scale, especially when combined with Splunk Enterprise
- Complex licensing model with separate charges for each product
- Steep learning curve for teams not already using Splunk
- Overkill for teams that do not need SIEM integration
Best for: Enterprise teams already using Splunk Enterprise who need to unify observability and security monitoring across hybrid infrastructure.
8. SolarWinds Server & Application Monitor (SAM)
Best for: Mid-market IT teams monitoring traditional infrastructure alongside cloud workloads with perpetual licensing or subscription models.
SolarWinds SAM provides infrastructure and application monitoring for hybrid environments. It supports Windows, Linux, VMware, AWS, Azure, and on-premises infrastructure through SNMP, WMI, and agent-based monitoring. SolarWinds is popular with IT operations teams managing traditional infrastructure alongside cloud migration projects.
Key Features:
- Infrastructure monitoring for servers, VMs, databases, and applications
- Application performance monitoring with transaction tracing
- Automatic discovery and dependency mapping
- Custom dashboards and alerting
- Integration with SolarWinds Orion platform for broader network monitoring
- Both perpetual licensing and subscription pricing
Pricing:
SolarWinds SAM offers two pricing models. Perpetual licenses start around $3,000 for 15 nodes. Subscription pricing starts at $165/month for 10 nodes. A 100-node hybrid environment costs approximately $2,000–$3,000/month on subscription or $15,000–$20,000 for perpetual licensing.
SolarWinds pricing page
Pricing based on publicly available information as of early 2026. Enterprise discounts, custom contracts, and negotiated rates are not reflected here.
Pros:
- Traditional perpetual licensing option for teams that prefer capital expenses
- Strong support for Windows and legacy infrastructure
- On-premises deployment with no external data egress
- Integration with broader SolarWinds Orion platform
- Lower upfront cost compared to enterprise SaaS platforms
Cons:
- Less sophisticated APM and distributed tracing compared to modern platforms
- Cloud native and Kubernetes support lags behind competitors
- User interface feels dated compared to modern observability tools
- Limited support for OpenTelemetry and vendor-neutral instrumentation
Best for: Mid-market IT teams managing traditional infrastructure alongside AWS or Azure who prefer perpetual licensing and on-premises deployment.
9. Elastic Observability
Best for: Teams already invested in the ELK stack (Elasticsearch, Logstash, Kibana) who want to extend logs into full observability across hybrid infrastructure.
Elastic Observability is the monitoring solution built on the Elastic Stack. It provides infrastructure monitoring, APM, log management, and uptime monitoring. Elastic supports hybrid cloud through Beats agents for AWS, Azure, GCP, Kubernetes, and on-premises infrastructure. It is particularly strong for teams that already use Elasticsearch for log management and want to add metrics and traces.
Key Features:
- Unified logs, metrics, and traces in Elasticsearch
- APM with distributed tracing across microservices
- Infrastructure and Kubernetes monitoring through Metricbeat
- Uptime monitoring and synthetic checks
- Custom dashboards and alerting in Kibana
- Both self-hosted and managed Elastic Cloud deployment
Pricing:
Elastic offers free open-source self-hosting. Managed Elastic Cloud starts at $99/month for the Standard tier with 100 GB storage and scales usage based on larger deployments. A 100-host hybrid environment with 10TB logs and metrics costs approximately $3,000–$5,000/month on Elastic Cloud.
Elastic Cloud pricing page
Pricing based on publicly available information as of early 2026. Enterprise discounts, custom contracts, and negotiated rates are not reflected here.
Pros:
- Free open source option for full self-hosted deployment
- Unified logs, metrics, and traces in one platform
- Strong full-text search capabilities inherited from Elasticsearch
- Flexible deployment supporting self-hosted and managed cloud
- Active open source community and extensive documentation
Cons:
- Operational complexity of managing Elasticsearch clusters at scale
- Weaker APM and tracing compared to purpose-built observability platforms
- High resource consumption for Elasticsearch at large scale
- Alerting and anomaly detection less sophisticated than AI-driven competitors
Best for: Teams already using Elasticsearch for logs who want to add infrastructure and APM monitoring without introducing another platform.
How to Choose the Right Hybrid Cloud Monitoring Tool
Choosing the right hybrid cloud monitoring tool depends on five core questions.
1. Do you have data residency or compliance requirements?
If you operate in healthcare, finance, government, or any regulated industry with strict data residency rules, you need a tool that can deploy on-premises or inside your own cloud VPC. CubeAPM, ScienceLogic, Dynatrace Managed, Grafana self-hosted, and Elastic self-hosted all support this. Datadog, New Relic, and Better Stack are SaaS only and send telemetry outside your infrastructure.
2. What is your infrastructure scale and complexity?
If you are monitoring fewer than 50 hosts, cost is less of a constraint and ease of use matters more. Tools like Grafana Cloud, New Relic, or Better Stack offer fast setup. If you are managing 500+ hosts across multiple clouds, cost predictability becomes critical. CubeAPM’s $0.20/GB pricing and Grafana’s usage-based model are more predictable at scale than Datadog’s or Dynatrace’s host based pricing.
3. Do you already have existing monitoring infrastructure?
If you already use Prometheus for metrics or the ELK stack for logs, Grafana Cloud or Elastic Observability extend your existing investment. If you are starting fresh, CubeAPM or ScienceLogic provide full-stack platforms without requiring Prometheus or Elasticsearch expertise.
4. Do you need AI-driven root cause analysis?
If you want automated anomaly detection and AI-powered root cause analysis, Dynatrace and Datadog lead this category. If you prefer manual investigation with powerful query tools and full data access, CubeAPM, Grafana, and Elastic give you more control.
5. What is your budget and how predictable does it need to be?
If cost predictability is critical and you want to avoid per-host, per-user, or per-feature billing, CubeAPM’s flat ingestion pricing is the most transparent. If budget flexibility exists and you prioritize breadth of integrations, Datadog or Dynatrace may justify their premium pricing.
The wrong tool is not necessarily the most expensive or the least expensive. The wrong tool is the one that does not match your deployment constraints, scale, or operational model.
Monitoring Hybrid Cloud Infrastructure with CubeAPM
CubeAPM is purpose-built for teams that need full-stack observability across hybrid cloud environments without sending telemetry outside their own infrastructure. It monitors AWS, Azure, GCP, on-premises data centers, Kubernetes clusters, and edge locations from a single unified platform.
CubeAPM deploys inside your cloud VPC or on-premises environment and stays there. Your telemetry data logs, metrics, traces, and infrastructure signals never leave your infrastructure. This solves two problems at once: data sovereignty compliance and zero egress costs. When your monitoring platform runs in the same AWS region as your workloads, you pay zero data transfer fees.
What CubeAPM monitors in hybrid environments:
- Infrastructure metrics from AWS EC2, Azure VMs, GCP Compute Engine, VMware, Hyper-V, and bare metal servers
- Kubernetes cluster health, pod performance, node resource utilization across AKS, EKS, GKE, and self-managed clusters
- Application traces across microservices regardless of whether they run in public cloud, private cloud, or on-premises
- Database performance for RDS, Azure SQL, Cloud SQL, and self-hosted PostgreSQL, MySQL, MongoDB across any environment
- Network latency and connectivity across cloud regions, VPNs, and on-premises networks
CubeAPM uses OpenTelemetry native instrumentation, meaning it works with any application already instrumented with OpenTelemetry SDKs. For teams migrating from Datadog or New Relic, CubeAPM is compatible with those agents, allowing incremental migration without ripping out existing instrumentation.
Pricing is $0.20/GB of telemetry ingested, regardless of how many hosts, users, or environments you monitor. A 200-node hybrid environment spanning AWS, Azure, and an on-premises data center ingesting 15TB/month costs $2,250/month. That number does not change if you add more users, enable more features, or spin up temporary test environments.
Delhivery, one of India’s largest logistics companies, documented 75% cost savings after migrating from Datadog to CubeAPM while gaining better visibility across their hybrid AWS and on-premises infrastructure. Mamaearth, a $1.2B consumer goods company, completed migration in under an hour with zero downtime and documented nearly 70% savings.
For teams evaluating hybrid cloud monitoring tools, CubeAPM fits best when data sovereignty, cost predictability, and full stack observability inside your own cloud matter more than having a vendor manage your infrastructure.
Disclaimer
Disclaimer: The information in this article reflects the latest details available at the time of publication and may change as technologies and products evolve. Features, pricing, and plan limits can change over time. Always verify the latest information directly with the vendor before making purchasing or deployment decisions.
Frequently Asked Questions
What is hybrid cloud monitoring?
Hybrid cloud monitoring is the practice of tracking performance, availability, and health of applications and infrastructure that span multiple environments, including public clouds (AWS, Azure, GCP), private clouds, on-premises data centers, and edge locations. It provides unified visibility across all environments from a single platform.
Why is hybrid cloud monitoring more complex than single cloud monitoring?
Hybrid cloud monitoring is more complex because it requires correlating telemetry data from multiple disconnected environments, each with different networking, security, and access models. Single cloud tools like CloudWatch or Azure Monitor only see their own environment and miss cross-environment dependencies.
What are the best hybrid cloud providers?
The leading hybrid cloud providers are AWS with Outposts, Microsoft Azure with Azure Stack, Google Cloud with Anthos, and VMware Cloud. Each provides infrastructure that bridges public cloud and on-premises environments. Your monitoring tool must support all of these to provide true hybrid visibility.
Which tools are used for cloud infrastructure monitoring?
Cloud infrastructure monitoring tools include CubeAPM, Datadog, Dynatrace, New Relic, Grafana, Splunk, SolarWinds, Elastic, and Prometheus. The best tool depends on your deployment model (SaaS vs. self-hosted), scale, budget, and whether you need data residency.
Do I need separate monitoring tools for AWS, Azure, and on-premises infrastructure?
No. Hybrid cloud monitoring platforms like CubeAPM, Datadog, ScienceLogic, and Dynatrace are designed to monitor all three from a single unified platform. Using separate tools creates visibility gaps and makes it harder to correlate issues across environments during incidents.