










Vector databases have become critical infrastructure for AI applications. As organizations deploy RAG pipelines, semantic search, and recommendation engines at scale, the ability to monitor vector database performance in real time determines whether your AI system stays fast and reliable or quietly degrades user experience. A query that takes 200ms today can balloon to 2 seconds after index fragmentation or traffic spikes without the right monitoring in place.
The vector database market reached $2.58 billion in 2026 and is projected to hit $17.91 billion by 2034, growing at 24% annually as AI adoption accelerates across enterprises. This growth makes vector database monitoring a production necessity rather than a nice-to-have. Whether you are running Pinecone serverless, self-hosted Milvus, or pgvector inside PostgreSQL, you need visibility into query latency, index health, storage utilization, and error rates before they cascade into customer-facing incidents.
This guide compares 8 vector database monitoring tools across real-time metrics, deployment model, cost structure, and OpenTelemetry compatibility. Each tool is evaluated on how it handles vector-specific signals like ANN search latency, index fullness, upsert throughput, and recall degradation.
Quick Comparison: 8 Vector Database Monitoring Tools
| Tool | Best For | Pricing | Free Plan | OTel Native? | Self-hosted? |
|---|---|---|---|---|---|
| CubeAPM | Teams running vector DBs on-prem with APM + infra | $0.20/GB ingestion | 50% off Pro trial | ✓ Native | ✓ Yes |
| Datadog | Multi-cloud enterprises, Pinecone + serverless | $15/host/mo + $0.10/GB logs | 14-day trial | Partial | ✗ SaaS only |
| Prometheus + Grafana | Open source teams, full control | Free OSS | ✓ Yes | ✓ Strong | ✓ Yes |
| New Relic | Broad observability + vector DB side by side | $0.40/GB beyond 100 GB free | 100 GB/mo free | Partial | ✗ SaaS only |
| Elastic APM | Teams already on ELK stack | Free OSS, $99/mo hosted | ✓ OSS free | Partial | ✓ Yes |
| Dynatrace | Enterprise AI-assisted analysis | Host-based, $0.20/GiB logs | 15-day trial | Partial | ✓ Yes |
| Better Stack | Startups, fast setup, lean teams | $29/mo | Free tier | ✓ Native | ✗ SaaS only |
| Coralogix | Real-time log + metric correlation | $0.42/GB (Streama filtering) | 14-day trial | ✓ Native | ✗ SaaS only |
Pricing estimates based on mid-market usage profile: 60 hosts, ~13 TB/month ingestion, 30-day retention. Verify current pricing with each vendor.
1. CubeAPM

CubeAPM is a self-hosted, OpenTelemetry native observability platform covering APM, logs, infrastructure, Kubernetes, and real user monitoring. It runs inside your cloud or on-premises, meaning vector database telemetry never leaves your infrastructure.
Key Features:
- Native OpenTelemetry ingestion with zero sampling by default
- Unified view of vector DB metrics, application traces, and infrastructure health
- Custom dashboards for tracking ANN query latency, index fullness, and upsert rates
- Smart alerting with full context linking metrics to traces and logs
- Unlimited retention with predictable $0.20/GB pricing
Pricing: $0.20/GB ingestion-based pricing with no per-host or per-user fees. Includes unlimited retention and all features. Pro plan starts at 50% off for new customers.
Pros:
- Complete data ownership with self-hosted deployment
- Single ingestion price covers metrics, logs, and traces without surprise add-ons
- Fast migration from Datadog, New Relic, or Prometheus agents
- Engineering-level support via WhatsApp and Slack channels
Cons:
- Requires you to manage the infrastructure (vendor provides managed support)
- SSO and RBAC are less mature than enterprise SaaS platforms
- No autonomous anomaly detection yet
Best for: Teams running vector databases on-prem or in private VPCs who need a full observability stack (APM + logs + infra) with data residency and cost predictability.
2. Datadog
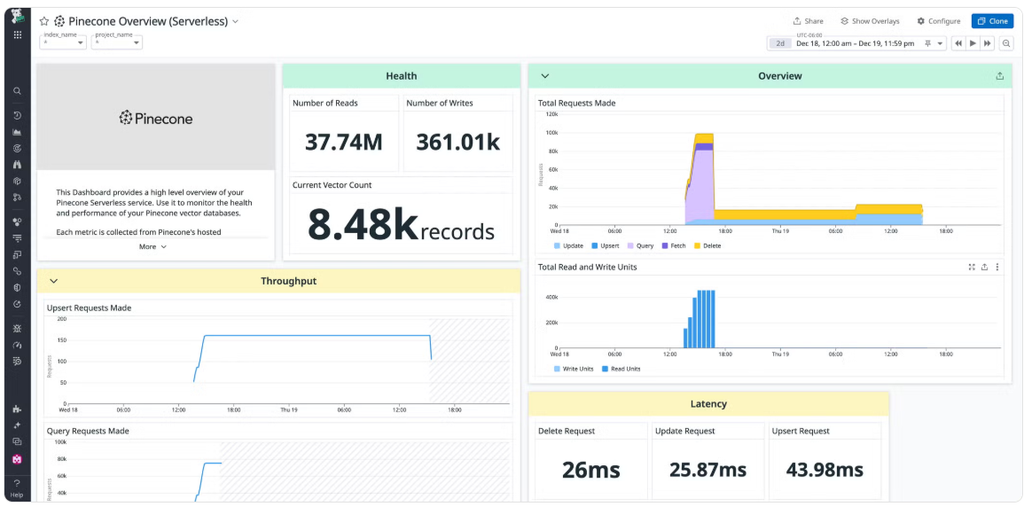
Datadog is a cloud native observability platform with a dedicated Pinecone integration that monitors both serverless and pod-based Pinecone indexes in real time. It provides preconfigured dashboards for index health, query throughput, and storage utilization.
Key Features:
- Out-of-the-box Pinecone integration with 25+ vector DB-specific metrics
- Preconfigured dashboards for serverless and pod-based index performance
- Recommended monitors for storage fullness and write overload alerts
- Multi-cloud support across AWS, Azure, GCP
- 700+ integrations covering your entire stack
Pricing: Infrastructure monitoring starts at $15/host/month. APM adds $31/host/month. Log ingestion at $0.10/GB plus $1.70/million events indexed. AWS egress fees add approximately $0.10/GB when sending telemetry to Datadog SaaS.
Pros:
- First and only observability platform with native Pinecone serverless support
- Preconfigured dashboards reduce setup time
- Strong multi-cloud coverage and broad integration ecosystem
- Mature alerting with anomaly detection
Cons:
- Per-host pricing compounds fast as infrastructure scales
- Indexing fees on top of ingestion for logs create billing complexity
- SaaS only architecture incompatible with strict data residency requirements
Best for: Enterprises running Pinecone at scale who need managed multi-cloud observability and are willing to pay premium pricing.
3. Prometheus + Grafana
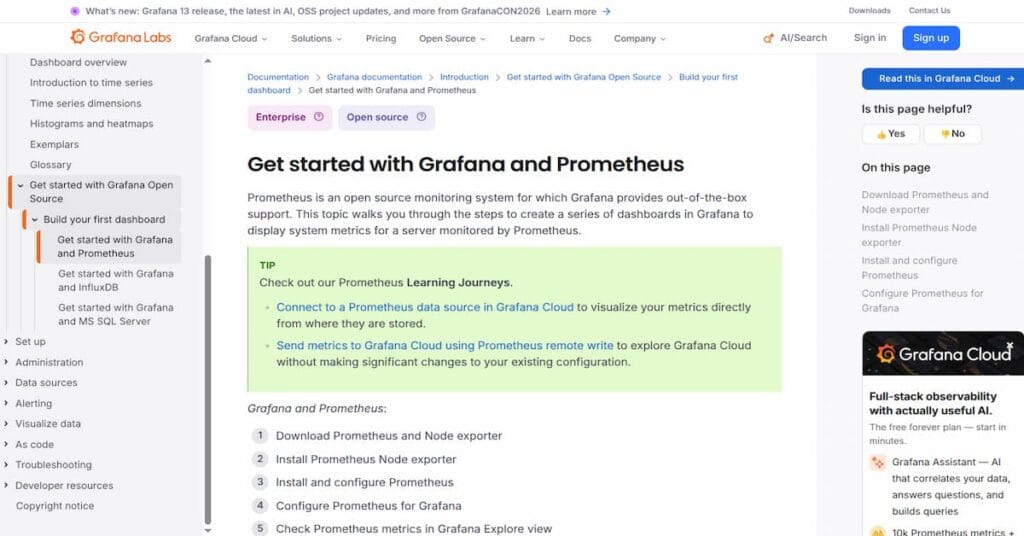
Prometheus is an open-source metrics system with a time series database optimized for high cardinality labels. Grafana provides visualization and alerting on top of Prometheus data. Together, they form the most widely deployed open-source monitoring stack.
Key Features:
- Native support for custom metrics from vector databases via client libraries
- PromQL query language for flexible metric aggregation and analysis
- Grafana dashboards for visualizing query latency, index size, memory usage
- Alert Manager for routing notifications to Slack, PagerDuty, email
- Self-hosted deployment with full data control
Pricing: Free open source. Infrastructure costs depend on your cluster size and retention period.
Pros:
- Zero licensing cost with complete control over data
- Highly flexible custom metric collection
- Large community with pre-built exporters for many databases
- Works well with infrastructure monitoring platforms for unified visibility
Cons:
- Requires significant operational overhead to run at scale
- High cardinality queries can degrade performance without tuning
- No built-in distributed tracing or log correlation
- Alert configuration can be verbose and error-prone
Best for: Teams already running Prometheus who want full control over monitoring infrastructure and have ops capacity to manage it.
4. New Relic

New Relic is a full-stack observability platform covering APM, logs, infrastructure, and real user monitoring. It supports custom metric ingestion via OpenTelemetry and provides dashboards for tracking vector database performance alongside application traces.
Key Features:
- Custom metric ingestion via OpenTelemetry for any vector database
- Unified view of vector DB metrics, application traces, and logs
- NRQL query language for flexible metric analysis
- AI-assisted anomaly detection and alerting
- Distributed tracing linked to database queries
Pricing: 100 GB/month free, then $0.40/GB beyond that. Full platform user seats at $99/user/month for enterprise features. Compute Capacity Units (CCU) billing available for high-volume workloads.
Pros:
- Generous 100 GB/month free tier for small teams
- Strong APM correlation between vector DB queries and application traces
- Mature platform with broad language and framework support
- Good documentation and community resources
Cons:
- Per-user seat pricing creates friction for growing teams
- CCU billing model is opaque and hard to forecast
- Proprietary NRQL query language creates vendor lock-in
- SaaS only deployment is incompatible with data residency requirements
Best for: Teams already on New Relic who want to add vector database monitoring into their existing observability stack.
5. Elastic APM
Elastic APM is part of the Elastic Stack (formerly ELK: Elasticsearch, Logstash, Kibana). It provides distributed tracing, metrics, and logs in a single platform. Teams already running Elasticsearch can extend it to monitor vector databases by ingesting custom metrics.
Key Features:
- Native Elasticsearch storage for metrics and traces
- Kibana dashboards for visualizing vector DB performance
- Distributed tracing linked to database queries
- Alerting via Kibana or Elastic Watcher
- Self-hosted or managed cloud deployment
Pricing: Free open source. Elastic Cloud hosted plans start at $99/month for the standard tier with 8 GB RAM.
Pros:
- Free if you self-host and already run Elasticsearch
- Powerful search and aggregation via Elasticsearch DSL
- Strong integration with Logstash for custom metric pipelines
- Can scale to billions of events with proper tuning
Cons:
- Steep learning curve if you are new to the Elastic Stack
- Resource-intensive, requiring significant infrastructure for large deployments
- Alert configuration can be complex compared to modern tools
- Trace sampling required at scale to avoid overwhelming storage
Best for: Teams already running the Elastic Stack who want to add vector database monitoring without adopting a new tool.
6. Dynatrace
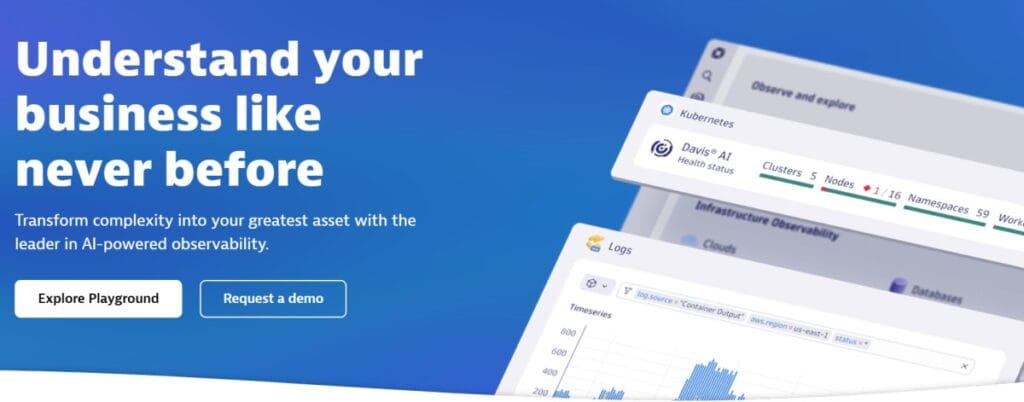
Dynatrace is an enterprise observability platform with AI-assisted root cause analysis. It provides automatic instrumentation for applications and infrastructure, including custom metric ingestion for vector databases.
Key Features:
- AI-assisted anomaly detection and root cause analysis
- Automatic topology mapping linking vector DB to upstream services
- Custom metric ingestion via OpenTelemetry
- Distributed tracing with automatic service dependency detection
- Self-hosted or SaaS deployment options
Pricing: Host-based pricing with application monitoring starting around $74/host/month. Log ingestion at $0.20/GiB. Contact sales for enterprise pricing.
Pros:
- Strong AI-assisted analysis reduces manual triage time
- Automatic instrumentation minimizes configuration overhead
- Enterprise-grade support and compliance certifications
- Flexible deployment on-prem or SaaS
Cons:
- Premium pricing makes it expensive for mid-market teams
- Less flexible for custom metric pipelines compared to open source tools
- Proprietary agent can conflict with OpenTelemetry instrumentation
- Learning curve for teams without Dynatrace experience
Best for: Large enterprises with budget for premium tooling who want AI-assisted analysis and automatic instrumentation.
7. Better Stack
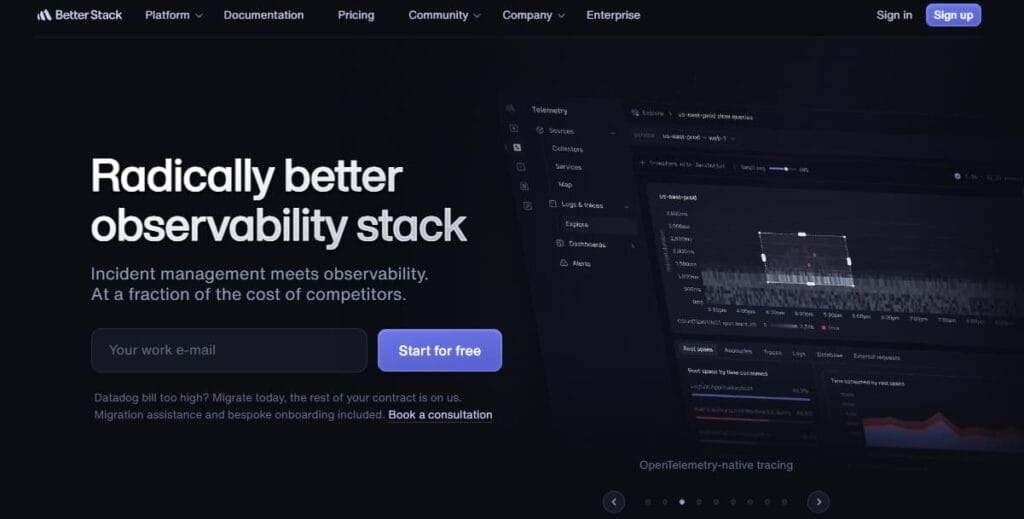
Better Stack is a developer-focused observability platform designed for fast setup and ease of use. It provides log management, uptime monitoring, and incident management in a single tool.
Key Features:
- Fast log ingestion with sub-second search
- Custom metric dashboards for vector database performance
- Uptime monitoring with multi-region checks
- Incident management with on-call scheduling
- Developer-friendly UI with minimal configuration
Pricing: Free tier available. Paid plans start at $29/month per responder with bundled logs and metrics.
Pros:
- Fast setup with minimal configuration overhead
- Clean UI optimized for developer experience
- Affordable pricing for small and mid-market teams
- Good documentation and responsive support
Cons:
- SaaS only deployment not suitable for data residency requirements
- Limited advanced features compared to enterprise platforms
- No distributed tracing or APM capabilities
- Smaller integration ecosystem compared to Datadog or New Relic
Best for: Startups and small teams who want fast setup, clean UX, and straightforward pricing without enterprise complexity.
8. Coralogix
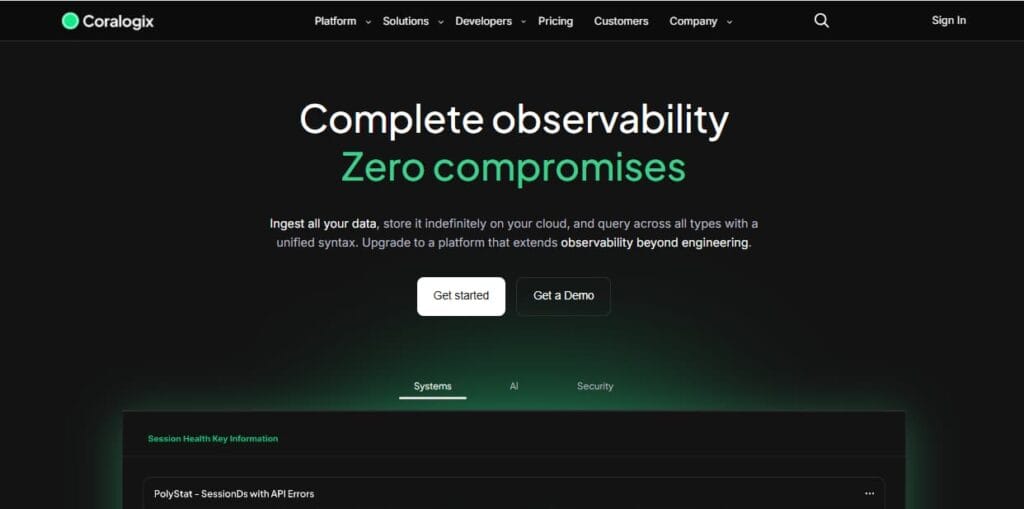
Coralogix is a log analytics platform with real-time in-stream processing. Its Streama technology analyzes logs and metrics as they are ingested, reducing storage costs by filtering low-value data before indexing.
Key Features:
- Real-time in-stream processing with Streama filtering
- Custom metric ingestion for vector database monitoring
- Log and metric correlation in a single platform
- Alerting with anomaly detection
- OpenTelemetry native ingestion
Pricing: $0.42/GB for logs with Streama filtering. Metric ingestion adds $0.09 per million data points. 14-day free trial available.
Pros:
- In-stream filtering reduces storage costs for high-volume environments
- Real-time processing enables faster alerting
- OpenTelemetry native ingestion
- Good balance of features and cost for log-heavy workloads
Cons:
- SaaS only deployment incompatible with strict data residency requirements
- Smaller ecosystem compared to Datadog or New Relic
- Limited infrastructure monitoring features
- Pricing can be hard to forecast with variable data volume
Best for: Log-heavy teams with high ingestion rates who want to reduce storage costs with intelligent filtering.
How to Choose the Right Vector Database Monitoring Tool
Choosing the right monitoring tool depends on your deployment model, team size, budget, and observability maturity. Here is a decision framework:
If data residency or compliance is non-negotiable: Choose a self-hosted tool like CubeAPM, Prometheus + Grafana, or Elastic APM. These keep all telemetry inside your infrastructure.
If you are already on an observability platform: Extend your existing tool. Datadog if you use Pinecone, New Relic if you are on New Relic, Elastic APM if you run the ELK stack.
If cost predictability matters most: Choose tools with simple ingestion-based pricing like CubeAPM ($0.20/GB all-in) or Coralogix ($0.42/GB with filtering). Avoid per-host or per-user pricing that compounds as you scale.
If you need enterprise AI-assisted analysis: Dynatrace offers the most mature AI root cause analysis but comes with premium pricing.
If you want fast setup with minimal ops burden: Better Stack provides the cleanest developer experience for small teams.
If you are running Pinecone at scale: Datadog is the only platform with native Pinecone serverless support and preconfigured dashboards.
If you are building on open source and want full control: Prometheus + Grafana gives you complete flexibility but requires ops capacity to run it well.
Every tool in this guide can monitor vector databases. The right choice depends on whether you optimize for cost, control, ease of use, or enterprise features.
Monitoring Vector Databases with CubeAPM
CubeAPM provides unified monitoring for vector databases alongside APM, logs, and infrastructure metrics in a single self-hosted platform. It runs inside your cloud or on-premises, keeping all telemetry data within your infrastructure.
For vector database monitoring, CubeAPM ingests metrics via OpenTelemetry or Prometheus exporters. This includes query latency, index size, memory usage, upsert throughput, and error rates. You can build custom dashboards to track ANN search performance, filter by service or endpoint, and set alerts on critical thresholds.
Because CubeAPM correlates metrics with distributed traces and logs, you can trace a slow vector search query back to the exact application service that triggered it. This cuts root cause analysis time from hours to minutes.
CubeAPM’s $0.20/GB ingestion-based pricing means you pay the same rate each for metrics, logs, and traces with no per-host or per-user fees. Retention is unlimited with no extra cost, making it predictable as you scale.
Teams running Milvus, Weaviate, Qdrant, or pgvector in private VPCs use CubeAPM to monitor vector database performance without sending telemetry to external SaaS platforms.
Disclaimer: The information in this article reflects the latest details available at the time of publication and may change as technologies and products evolve. Features, pricing, and plan limits can change over time. Always verify the latest information directly with the vendor before making purchasing or deployment decisions.
Frequently Asked Questions
What metrics should I monitor for vector databases?
Track query latency (p50, p95, p99), index fullness, upsert throughput, memory usage, error rates, and recall accuracy. Query latency is the most critical metric since it directly impacts user experience in RAG and semantic search applications.
Can I use Prometheus to monitor vector databases?
Yes. Most vector databases expose Prometheus-compatible metrics endpoints. You can scrape these with Prometheus and visualize them in Grafana. This works well for open-source deployments where you control the infrastructure.
Does Datadog support monitoring Milvus or Weaviate?
Datadog has native support for Pinecone but not Milvus or Weaviate. You can still monitor those by ingesting custom metrics via OpenTelemetry or statsd. This requires more configuration than the preconfigured Pinecone integration.
What is the difference between monitoring serverless vector databases vs. self-hosted?
Serverless vector databases like Pinecone Serverless abstract infrastructure, so you monitor query performance and cost. Self-hosted databases like Milvus require monitoring CPU, memory, disk I/O, and cluster health in addition to query metrics.
How much does it cost to monitor vector databases at scale?
Cost depends on your tool and data volume. Ingestion-based pricing like CubeAPM ($0.20/GB) or Coralogix ($0.42/GB) is predictable. Per-host pricing like Datadog ($15 to $31/host/month) compounds fast. Budget for AWS egress fees (~$0.10/GB) if sending telemetry to SaaS platforms.
Can I monitor vector databases with open source tools?
Yes. Prometheus + Grafana is the most common open-source stack for vector database monitoring. It requires operational overhead but gives you complete control over data and costs nothing for licensing.
What is the best tool for monitoring Pinecone?
Datadog is the only platform with native Pinecone serverless support and preconfigured dashboards. For self-hosted monitoring, CubeAPM or Prometheus + Grafana work well with custom metric ingestion.