










Parseable is an open-source, cloud native log analytics platform built on object storage rather than traditional indexing architectures like Elasticsearch or Splunk. According to the 2025 CNCF Survey, 87% of organizations use logs as a primary signal type, but log storage costs remain a top complaint across observability platforms. Parseable attempts to solve this by storing logs directly in object storage (S3, Azure Blob, MinIO) and querying them without prebuilt indexes, which reduces storage overhead significantly.
This review covers Parseable’s pricing model, core features, deployment options, OpenTelemetry compatibility, and how it compares to alternatives like CubeAPM, Grafana Loki, and traditional log platforms. Every pricing figure cited here links to the original source or reflects publicly available information as of early 2026.
What Is Parseable?

Parseable is a log analytics platform designed to simplify log ingestion, storage, and querying without the complexity of index management. Unlike Elasticsearch, which requires indexing each log entry before it becomes searchable, Parseable writes logs directly to object storage in Parquet columnar format and queries them on demand using Apache Arrow for fast in-memory processing.
This architecture removes the need for dedicated index clusters, reduces storage costs to object storage rates (typically $0.02 to $0.03 per GB per month on AWS S3), and makes long retention periods affordable by default. Parseable runs as a single binary, supports Kubernetes deployments via Helm, and integrates with FluentBit, Vector, and OpenTelemetry Collector for log ingestion.
The platform targets teams that want cost-effective log storage without managing Elasticsearch clusters, need compliance-friendly long-term retention, or prefer self-hosted deployments to keep logs within their own infrastructure.
Parseable Pricing Model: How Much Does Parseable Cost?
Parseable pricing is ingestion-based, billed per GB of logs ingested into the platform. According to the Parseable pricing page, two tiers are available:
Pro Plan: $0.39/GB ingested
- Billed quarterly
- Includes 365-day retention
- 99.9% uptime SLA
- AI native analysis features
- Community support via Slack
Enterprise Plan: Custom pricing, billed annually
- All Pro features
- Dedicated account management
- Custom retention periods
- Priority support
- Advanced security and compliance controls
No per-host, per-user, or per-query fees exist. The only variable is ingestion volume. Storage costs are separate and depend on the object storage backend you use (AWS S3, Azure Blob, GCS, MinIO).
This estimate models a production-ready setup with high availability. A smaller or simpler deployment may cost significantly less.
Example Cost Scenario: 5TB Monthly Ingestion
Using Parseable Pro at $0.39/GB:
- Log ingestion: 5TB = 5,000 GB × $0.39 = $1,950/month
- Object storage (AWS S3 Standard, 365 days): 5TB × $0.023/GB/month = $115/month
- Total: ~$2,065/month
This scenario assumes S3 Standard storage for active querying. If you move logs older than 90 days to S3 Glacier for archival, storage costs drop further.
Pricing is based on publicly available information as of early 2026. Enterprise discounts, custom contracts, and negotiated rates are not reflected here.
Core Features: What Does Parseable Include?
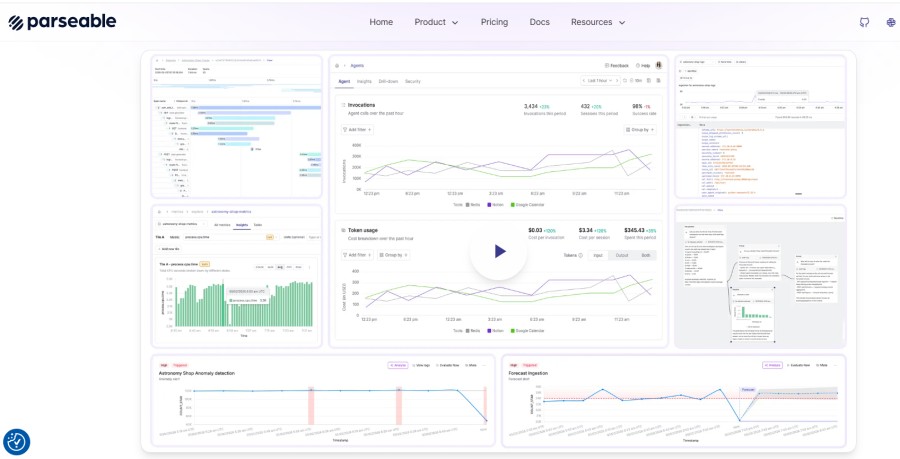
Parseable covers log ingestion, storage, querying, and basic alerting. It does not provide full APM (distributed tracing, service maps, error tracking) or infrastructure metrics out of the box. Teams typically pair Parseable with Prometheus for metrics and Jaeger or Tempo for traces.
Log Ingestion and Compatibility
Parseable accepts logs via HTTP REST API, supporting structured JSON logs and plain text. Integrations exist for:
- FluentBit and Fluentd for container and host log collection
- Vector for high-performance log routing
- OpenTelemetry Collector for unified telemetry pipelines
- Logstash for teams migrating from Elasticsearch
No proprietary agents are required. Logs are written to object storage immediately after ingestion, making them queryable within seconds.
Storage Architecture: Why Object Storage Matters
Traditional log platforms like Elasticsearch store logs in indexed shards distributed across nodes. This speeds up queries but increases storage costs because every log line gets indexed. Parseable skips indexing entirely and writes logs in Parquet format to object storage, which costs 10x less than indexed storage.
Because object storage (S3, Azure Blob, GCS) is durable by default with 11 nines of reliability, Parseable eliminates the need for replication across nodes. A single Parseable instance can handle ingestion and query processing, reducing infrastructure overhead significantly compared to multi-node Elasticsearch clusters.
Query Performance and Search
Parseable uses Apache Arrow for in-memory columnar processing, which accelerates queries over compressed Parquet files stored in object storage. Query speed depends on the amount of data scanned and the resources allocated to the Parseable instance. For typical log queries filtering by timestamp, service name, or log level, response times range from sub-second to a few seconds depending on retention window and data volume.
Full-text search across raw log messages is supported but slower than indexed platforms like Elasticsearch. If your use case requires sub-100ms full-text search across petabytes of logs, Parseable may not be ideal. But for structured log queries filtering on JSON fields or timestamps, performance is comparable to indexed systems at a fraction of the cost.
Alerting and Notifications
Parseable supports basic query-based alerting. You define a query, set a threshold, and configure notification channels (Slack, email, webhooks). Alerts trigger when query results exceed the defined condition.
This is less sophisticated than dedicated alerting platforms like Prometheus Alertmanager or Grafana. For complex alerting workflows with multi-condition logic, teams typically integrate Parseable with external alerting tools rather than relying on its native alerting alone.
AI Native Analysis (Pro and Enterprise Only)
Parseable’s Pro and Enterprise plans include AI-driven log analysis features. These use natural language queries to extract insights from logs without writing complex query syntax. According to Parseable’s GitHub repository, this feature is still evolving, and specific capabilities are documented in their release notes.
Deployment Options: Self-Hosted vs Managed Cloud
Parseable can be deployed in three ways:
- Self-hosted on Kubernetes: Install via Helm chart, run in your own VPC or data center. You manage the Parseable binary and provide object storage (S3, MinIO, etc.). No data leaves your infrastructure.
- Self-hosted on VMs or bare metal: Run the Parseable binary directly on any Linux host with access to object storage. Suitable for edge deployments or teams without Kubernetes.
- Managed cloud service: Parseable offers a managed SaaS option where they run the infrastructure, and you pay per GB ingested. This is the Pro plan listed on their pricing page.
Most teams choose self-hosted deployments to control costs and meet data residency requirements. The managed option simplifies operations but removes the cost advantage of running on your own object storage.
OpenTelemetry Compatibility
Parseable integrates with OpenTelemetry via the OpenTelemetry Collector. Logs collected by the OTel Collector can be routed to Parseable using the HTTP exporter. This works for both self-hosted and managed deployments.
Because Parseable focuses only on logs, teams using OpenTelemetry for full observability (logs, traces, metrics) typically send logs to Parseable and traces/metrics to a separate backend like Prometheus, Tempo, or a unified platform like CubeAPM.
Parseable does not natively correlate logs with traces or metrics. Correlation must be done manually via trace IDs embedded in logs or using external tools like Grafana to query multiple data sources together.
Parseable vs Alternatives: How Does It Compare?
Parseable vs CubeAPM
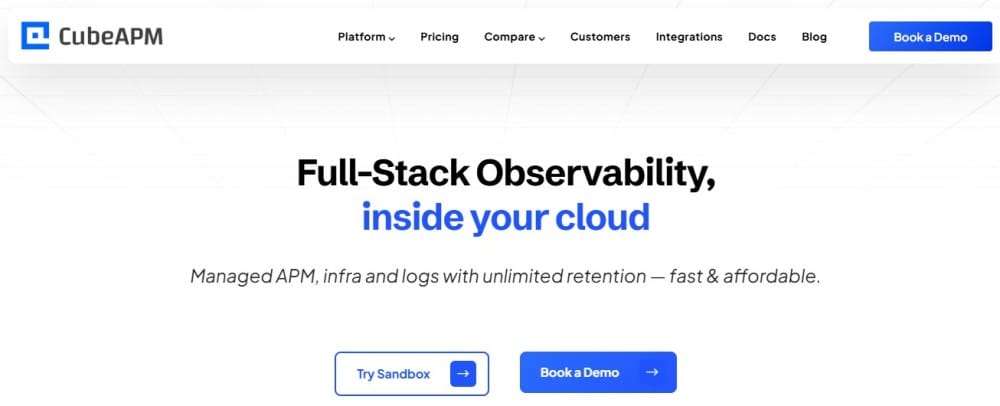
CubeAPM provides unified observability covering logs, traces, metrics, infrastructure monitoring, RUM, and synthetics in one self-hosted platform. Parseable focuses only on logs and requires separate tools for APM and metrics.
Pricing: CubeAPM charges $0.20/GB for all telemetry data (logs, traces, metrics), while Parseable charges $0.39/GB for logs alone. For teams needing full stack observability, CubeAPM’s unified pricing is simpler and often lower at scale.
Deployment: Both support self-hosted deployments inside your VPC. CubeAPM is vendor-managed, meaning the CubeAPM team handles upgrades, patches, and support while your data stays local. Parseable is fully DIY when self-hosted.
OpenTelemetry: CubeAPM is natively built on OpenTelemetry, providing first-class support for OTel logs, traces, and metrics. Parseable supports OTel logs via the Collector but does not handle traces or metrics.
Best for: Parseable is best for teams that only need cost-effective log storage and already have separate solutions for APM and metrics. CubeAPM is best for teams wanting unified observability without managing multiple tools.
Parseable vs Grafana Loki
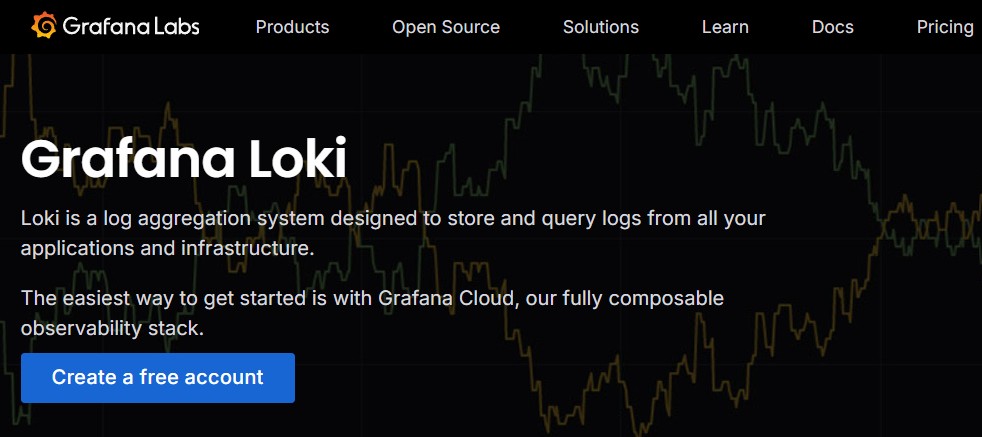
Grafana Loki is another object storage-based log aggregation system, often paired with Grafana for visualization. Like Parseable, Loki avoids indexing full log content and instead indexes metadata labels for efficient querying.
Pricing: Both are open source and free to self-host. Grafana Cloud charges based on usage, with logs billed separately from metrics and traces. Parseable’s managed Pro plan is $0.39/GB. Exact Grafana Cloud log pricing varies by plan and retention tier.
Query language: Loki uses LogQL, a query language similar to PromQL. Parseable uses SQL-based queries over Parquet files. Teams already familiar with SQL may find Parseable easier.
Ecosystem: Loki integrates tightly with Grafana, Prometheus, and Tempo for unified observability. Parseable requires more manual integration work to connect with other tools.
Best for: Loki is best for teams already using Grafana and Prometheus who want a native log solution in that ecosystem. Parseable is best for teams wanting simpler SQL queries and minimal dependencies.
Parseable vs Elasticsearch
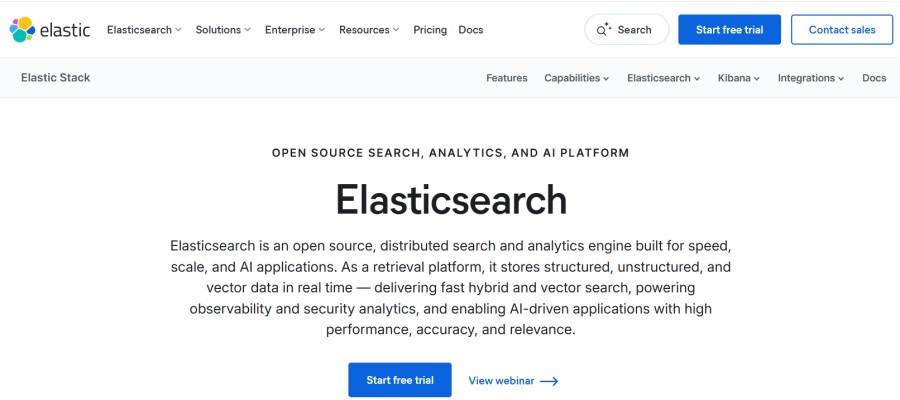
Elasticsearch is the most widely deployed log platform, known for powerful full-text search and indexing. It requires managing clusters, shards, and index lifecycles, which increases operational complexity.
Cost: Elasticsearch storage costs are significantly higher due to indexing. A 5TB log volume indexed in Elasticsearch requires 10 to 15TB of storage after replication and indexing overhead. Parseable stores the same 5TB as 5TB in object storage, reducing costs by 70% or more at scale.
Query speed: Elasticsearch delivers sub-100ms full-text search across massive datasets. Parseable is slower for unstructured full text queries but competitive for structured queries filtering on JSON fields or timestamps.
Operational complexity: Elasticsearch clusters require tuning, shard management, and rebalancing. Parseable runs as a single binary with minimal configuration.
Best for: Elasticsearch is best for teams needing advanced full-text search and willing to invest in cluster operations. Parseable is best for teams prioritizing cost and simplicity over search speed.
Parseable Pros and Cons
Pros
- Low storage costs: Object storage rates (S3, MinIO) are 10x cheaper than indexed storage
- No index management: No shards, rebalancing, or index lifecycle policies to maintain
- OpenTelemetry compatible: Integrates with OTel Collector for log ingestion
- Self-hosted option: Full data control for compliance and data residency
- Predictable pricing: Single dimension billing per GB ingested, no per host or per user fees
Cons
- Logs only: No APM, traces, metrics, or infrastructure monitoring out of the box
- Slower full-text search: Unstructured log searches are slower than Elasticsearch
- Basic alerting: Limited compared to Prometheus Alertmanager or Grafana
- Smaller ecosystem: Fewer integrations and community plugins than Elasticsearch or Loki
- DIY when self-hosted: Upgrades, scaling, and troubleshooting are your responsibility
How to Migrate to Parseable from Elasticsearch or Splunk
Migrating to Parseable involves changing log ingestion endpoints and rewriting queries from Lucene or SPL to SQL. Here is a practical migration path:
- Deploy Parseable alongside existing log platform: Run both in parallel during migration to avoid downtime
- Route a subset of logs to Parseable: Start with non-critical logs to test ingestion and query performance
- Rewrite dashboards and alerts: Convert queries from Lucene (Elasticsearch) or SPL (Splunk) to SQL for Parseable
- Validate query performance: Test typical log queries to ensure response times meet SLA
- Migrate remaining logs: Route all logs to Parseable once validation completes
- Decommission old platform: Shut down Elasticsearch or Splunk clusters after confirming Parseable meets all requirements
Most teams complete migration in 2 to 6 weeks depending on log volume and dashboard complexity. Parseable provides migration scripts for Elasticsearch on their GitHub repository.
Parseable offers predictable, ingestion-based pricing at $0.39/GB with 365-day retention and no per-user or per-host fees. Its object storage architecture reduces storage costs by 70% or more compared to indexed platforms like Elasticsearch. However, it covers logs only and requires separate tools for APM, metrics, and infrastructure monitoring.
For teams needing unified observability without managing multiple systems, platforms like CubeAPM provide logs, traces, metrics, and APM in one self-hosted solution at $0.20/GB for all telemetry data. For teams focused solely on cost-effective log storage and willing to manage their own deployments, Parseable delivers strong value.
Disclaimer: The information in this article reflects the latest details available at the time of publication and may change as technologies and products evolve. Features, pricing, and plan limits can change over time. Always verify the latest information directly with the vendor before making purchasing or deployment decisions.
Frequently Asked Questions
How much does Parseable cost?
Parseable Pro costs $0.39/GB ingested with 365 day retention included. Enterprise pricing is custom and billed annually. Storage costs are separate and depend on your object storage provider (S3, Azure Blob, MinIO).
Is Parseable open source?
Yes, Parseable is open source and available on GitHub under the Apache 2.0 license. You can self-host it at no cost, but managed cloud plans are paid.
Does Parseable support OpenTelemetry?
Parseable integrates with OpenTelemetry via the OpenTelemetry Collector. Logs collected by the OTel Collector can be routed to Parseable using the HTTP exporter. It does not natively handle traces or metrics.
How does Parseable pricing compare to Elasticsearch?
Parseable charges per GB ingested ($0.39/GB on Pro plan) with storage billed separately at object storage rates (~$0.02/GB/month on S3). Elasticsearch requires indexed storage, which costs 10x more due to replication and indexing overhead.
Can Parseable replace Datadog for logs?
Parseable can replace Datadog for log storage and querying but does not include APM, metrics, or infrastructure monitoring. Teams using Datadog for full observability need separate tools for traces and metrics if switching to Parseable.
What is the difference between Parseable and Grafana Loki?
Both use object storage to reduce log costs and avoid indexing. Loki integrates tightly with Grafana and uses LogQL for queries. Parseable uses SQL-based queries and runs as a standalone binary. Loki fits teams already using Grafana; Parseable fits teams wanting simpler SQL queries.
Does Parseable support self-hosted deployments?
Yes, Parseable can be deployed on Kubernetes via Helm or on VMs/bare metal as a single binary. You provide object storage (S3, MinIO, Azure Blob), and Parseable handles ingestion and querying. All data stays in your infrastructure.