Linux powers over 96% of the world’s top servers, making it the backbone of enterprise and cloud-native applications. For administrators, monitoring Linux workloads means more than tracking CPU or memory. Many monitoring tools add cost and complexity, with host-based pricing and limited Linux-specific insights.
CubeAPM was built to solve these problems for Linux environments. Built with Linux workloads at its core, CubeAPM delivers full-stack observability for Linux servers, applications, and containers.
In this guide, we explore the best Linux application monitoring tools, analyzing their strengths, limitations, and pricing models. From kernel-level metrics to container visibility, you’ll see how these platforms help monitor CPU, memory, I/O, and logs at scale.
Best Linux Application Monitoring Tools
- CubeAPM
- Datadog
- New Relic
- Dynatrace
- Zabbix
- Better Stack
- Checkmk
- Grafana
What is a Linux Application Monitoring Tool?
A Linux application monitoring tool collects and analyzes telemetry from servers and applications — tracking CPU, memory, disk, network, processes, containers, and application requests. By combining metrics, logs, and traces, these tools turn vague symptoms into actionable root causes.
At the host level, agents and exporters tap into Linux system interfaces like /proc and /sys to report CPU, memory, and I/O health across bare metal, VMs, and container nodes. Modern platforms extend this with eBPF, which safely hooks into kernel events to capture latency, network behavior, and system calls with minimal overhead.
Because most Linux environments now run in containers, effective monitoring must understand cgroups v2 and Kubernetes scheduling. This ensures resource usage is tied to the right pod or service rather than just the node. Advanced tools also ingest logs from systemd-journald and applications, correlating them with metrics and traces so that error spikes can be traced directly back to the requests or services that caused them.
What A Linux Application Monitoring Tool Does
- Detects and explains performance issues across hosts, containers, and services using metrics (e.g., CPU steal, TCP retransmits), logs (journald/syslog/app), and distributed traces of end-to-end request paths.
- Attributes resource usage correctly via cgroups and containers, so alerts and SLOs map to the right pod or service — not just the node.
- Surfaces kernel-level causes such as syscalls, network, or I/O issues with eBPF when “top” and “htop” aren’t enough.
- Streams and correlates logs from journald and applications with request traces, turning “503 spikes” into actionable root causes.
How it’s delivered
- Agents or exporters on Linux hosts and containers collect system metrics and application telemetry.
- Backends (either SaaS or self-hosted) store, query, alert, and visualize the data, with OpenTelemetry ensuring you’re not locked into one vendor.
Example: How CubeAPM Handles Linux Application Monitoring
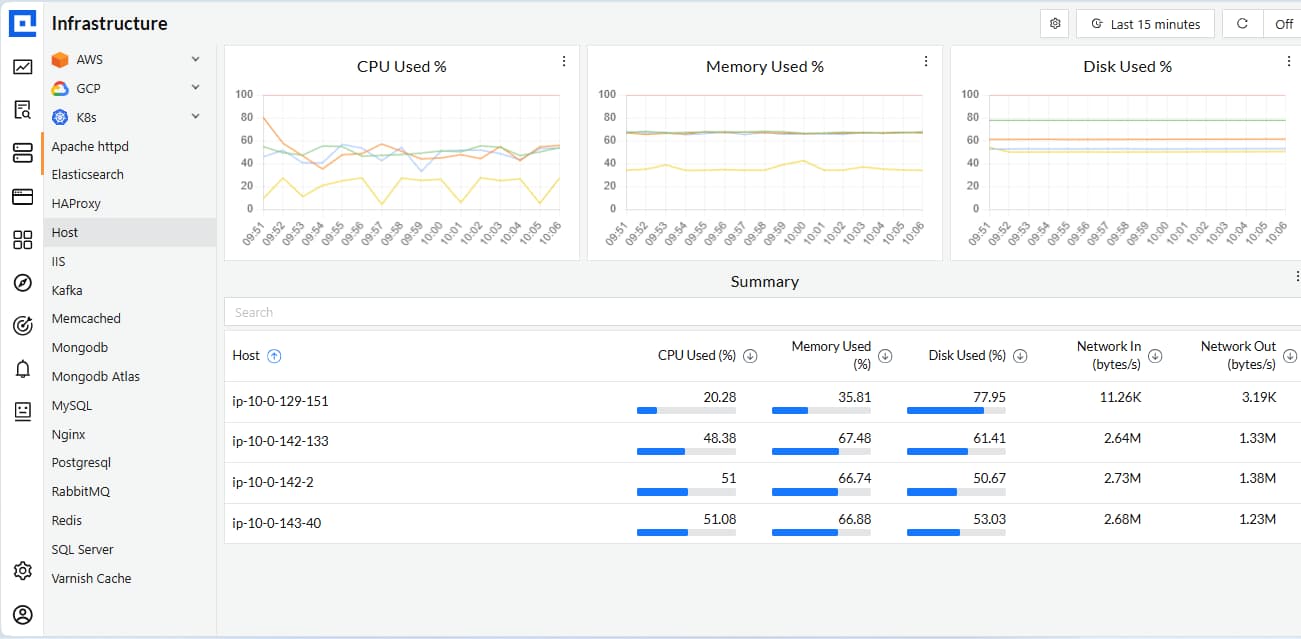
CubeAPM Linux infrastructure monitoring dashboard showing host-level CPU, memory, disk, and network usage across multiple Linux servers.
CubeAPM approaches Linux application monitoring by combining host-level telemetry, container visibility, and application traces into one unified platform. It deploys lightweight OpenTelemetry Collectors on Linux servers or Kubernetes nodes to capture CPU, memory, I/O, and network metrics straight from /proc and /sys. This ensures system administrators see not only whether a host is healthy, but also which process, container, or namespace is driving resource pressure.
Beyond infrastructure, CubeAPM integrates logs, traces, and service-level metrics from Linux applications themselves. It supports Prometheus exporters, OpenTelemetry instrumentation, and even existing New Relic agents, so admins don’t need to re-instrument workloads. With built-in dashboards for common Linux services like MySQL, Nginx, and Redis, plus smart sampling and predictable pricing, CubeAPM delivers observability that is tuned to the scale and complexity of Linux environments. This process can be broken into:
- Host telemetry: Collects CPU, memory, disk, and network metrics via Linux system interfaces.
- Process & container visibility: Tracks workloads with cgroups v2 and Kubernetes, attributing usage to the right pod or service.
- Kernel-level insights: Uses eBPF to capture syscalls, latency, and network behavior at very low overhead.
- Logs & correlation: Ingests journald and application logs, tying them directly to traces and metrics.
- Prometheus compatibility: Scrapes Linux exporters like node_exporter or PostgreSQL exporter.
- Application tracing: Ingests OpenTelemetry and New Relic agent data without re-instrumentation.
- Dashboards & alerts: Offers ready Linux service dashboards and contextual alerts with trace correlation.
- Predictable pricing: Flat $0.15/GB ingestion and $0.02/GB infra metrics — no host-based surprises
Why Teams Choose Different Linux Application Monitoring Tools
1. Pricing and scale realities
Teams often weigh host-based versus data-based pricing. In dense containerized Linux environments, per-host costs can skyrocket, while data-volume pricing may offer more predictable bills. Retention also matters: some need long-term storage for audits, others prefer short retention with cheaper cold storage options.
2. Linux-first technical fit
Not every tool goes deep into the Linux kernel. Teams that need eBPF support for system calls, I/O, and network latency will pick differently than those satisfied with basic CPU and memory checks. Container attribution via cgroups v2 and Kubernetes awareness is also critical, along with first-class support for journald logs across distros.
3. Open standards and migration path
Linux admins value OpenTelemetry so they can instrument once and avoid vendor lock-in. Compatibility with Prometheus exporters is another deciding factor, since many teams already run node_exporter and service exporters. Tools with ready dashboards and alert rules for Linux-specific signals like I/O wait or TCP retransmits speed up adoption.
4. Performance and overhead
Monitoring itself can’t slow down Linux workloads. Teams choose tools with lightweight agents and smart sampling, so they capture enough traces without consuming too much CPU or memory. Query performance at scale is equally important—when thousands of nodes are in play, slow queries can block critical investigations.
5. Usability and team workflow
Linux monitoring has to serve both ops and dev teams. Operators want heatmaps of nodes and pods, while developers need request-level traces and error grouping. Tools that balance both perspectives and control alert noise with deduplication and incident workflows usually win out because they shorten troubleshooting cycles.
6. Ecosystem and integrations
A good Linux monitoring tool fits seamlessly into the stack. Native support for services like Nginx, PostgreSQL, or Redis saves setup time. Integrations with CI/CD pipelines, infrastructure-as-code frameworks, and chat or ticketing systems ensure the tool adapts to the team’s workflow instead of creating silos.
7. Total cost of ownership
Open-source Linux monitoring options like Prometheus, Grafana, Zabbix, or Checkmk reduce licensing costs but shift the burden of setup and maintenance to the team. Managed APMs add recurring costs but free teams from operating the monitoring stack themselves. The steepness of the learning curve often tips the scales one way or the other.
Top 8 Linux Application Monitoring Tools
1. CubeAPM

Known for
CubeAPM is known for being an OpenTelemetry-native, Linux-first observability platform that unifies metrics, logs, traces, errors, and synthetic checks into a single stack. It’s designed to deliver enterprise-grade visibility at predictable costs, making it especially attractive for Linux system administrators who need depth without runaway pricing. Many teams also recognize CubeAPM for its fast migration path, since it works seamlessly with Prometheus exporters and existing Datadog or New Relic agents.
Linux Application Monitoring Features
- Collects host-level telemetry directly from /proc and /sys for CPU, memory, disk, and network stats
- Integrates with systemd-journald for Linux-native log ingestion and correlation
- Supports cgroups v2 and Kubernetes attribution to tie resource usage to the right pod or service
- Leverages eBPF hooks for syscall tracing, network latency, and kernel-level insights with low overhead
- Provides pre-built dashboards for Linux services like Nginx, MySQL, Redis, and Kafka
Key Features
- Full-stack MELT observability (Metrics, Events, Logs, Traces)
- Distributed tracing with smart sampling for high-traffic Linux applications
- Infrastructure monitoring across bare metal, VMs, and Kubernetes clusters
- Error tracking with correlation to logs and traces
- Synthetic monitoring and real user monitoring (RUM)
- Agent compatibility with Prometheus, Datadog, New Relic, and Elastic
- On-premises or hybrid deployment options for compliance
Pros
- Predictable flat $0.15/GB ingestion with no host-based fees
- Strong Linux internals coverage (journald, eBPF, cgroups)
- Easy migration with compatibility for other popular agents
- Slack/WhatsApp support with sub-5-minute response times
- Scales efficiently without blind sampling gaps
Cons
- Not suited for teams looking for off-prem solutions
- Strictly an observability platform and does not support cloud security management
Pricing
- Flat-pricing of $0.15/GB
CubeAPM Linux Application Monitoring Pricing at Scale
*All pricing comparisons are calculated using standardized Small/Medium/Large team profiles defined in our internal benchmarking sheet, based on fixed log, metrics, trace, and retention assumptions. Actual pricing may vary by usage, region, and plan structure. Please confirm current pricing with each vendor.
For a mid-sized SaaS company ingesting 45TB(~45,000) total monthly data ingestion and 45,000TB of observability data outcharged by the cloud provider, the total cost will be about ~$7200/month.
Techfit
CubeAPM is a great fit for Linux-heavy organizations running containerized, microservices-based applications that need deep kernel visibility, predictable costs, and flexible deployment (SaaS or on-prem). It is particularly valuable for teams in compliance-driven industries like finance or healthcare, where Linux workloads must be monitored without compromising on security or data locality.
2. Datadog
Known for
Datadog is known as one of the most widely adopted cloud-based monitoring platforms, offering extensive integrations and a polished SaaS experience. It is particularly popular with DevOps teams that want a single pane of glass for infrastructure, applications, and cloud services. While strong in breadth, it is often criticized for complex pricing models that scale poorly in Linux-heavy environments.
Linux Application Monitoring Features
- Provides Linux host monitoring through lightweight agents that collect CPU, memory, disk, and network metrics
- Offers pre-built dashboards for Linux processes and kernel metrics, including load averages, I/O wait, and TCP retransmits
- Integrates with journald, syslog, and common Linux application logs for ingestion and search
- Supports containerized Linux environments with Kubernetes and Docker integrations, attributing resource usage to pods and containers
- Limited kernel-level visibility compared to tools using eBPF, often requiring third-party extensions for deep Linux insights
Key Features
- APM with distributed tracing and service maps
- Infrastructure monitoring across hosts, containers, and cloud providers
- Log management with centralized ingestion and search
- Synthetic monitoring for uptime and API checks
- Real user monitoring (RUM) for frontend performance
- 900+ integrations covering Linux services, databases, and middleware
Pros
- Extensive integrations and plug-and-play setup
- Strong UI with customizable dashboards
- Reliable SaaS delivery with high availability
- Popular in multi-cloud and hybrid deployments
Cons
- Pricing complexity with per-host, per-feature, and retention-based charges
- Costs rise sharply in dense Linux container environments
Pricing
- APM (Pro Plan): $35/host/month
- Infra (Pro Plan): $15/host/month
- Ingested Logs: $0.10 per ingested or scanned GB per month
Datadog Linux Application Monitoring Pricing at Scale
For a mid-sized SaaS company operating 125 APM hosts, 40 profiled hosts, 100 profiled container hosts, 200 infrastructure hosts, 1.5 million container hours, 300,000 custom metrics, 500 million indexed spans, and 3,500 indexed logs, while ingesting approximately 10 TB (≈10,000 GB) of logs per month, the estimated monthly cost would be around $27,475.
Techfit
Datadog is a strong choice for organizations that want a SaaS-first, integration-rich monitoring experience with quick onboarding for Linux workloads. However, teams with large Linux fleets or heavy containerization often find costs difficult to control, making Datadog best suited for smaller to mid-scale deployments where simplicity outweighs cost predictability.
3. New Relic
Known for
New Relic is known for its long-standing presence in the APM market, with strong adoption among developers and SaaS teams. It offers polished dashboards, application-centric visibility, and a developer-friendly ecosystem. Many teams adopt it for quick app instrumentation, but costs and retention limits often become pain points when scaling Linux workloads.
Linux Application Monitoring Features
- Collects Linux host metrics such as CPU, memory, load averages, and I/O directly from installed agents
- Provides process-level monitoring to track the performance of services like Apache, Nginx, MySQL, and JVM-based apps
- Supports Linux container monitoring in Docker and Kubernetes environments with integrations for pod- and cluster-level metrics
- Basic log ingestion from journald and syslog, though it often requires additional configuration for full Linux coverage
- Limited kernel-level visibility compared to tools leveraging eBPF for syscall and network tracing
Key Features
- Application performance monitoring with distributed tracing
- Infrastructure monitoring for hosts, containers, and cloud platforms
- Centralized log ingestion and search
- Browser and mobile real user monitoring (RUM)
- Synthetic checks for uptime and API testing
- AI-powered anomaly detection and alerting
Pros
- Strong application monitoring focus with rich dashboards
- Developer-friendly instrumentation and SDKs
- Unified platform for APM, infrastructure, logs, and synthetics
- Large community and documentation base
Cons
- Pricing complexity with ingestion, retention, and per-user licensing fees
- Costs rise sharply at scale with high-volume Linux telemetry
Pricing
- Free: 100GB/Month
- $0.4 per GB of ingested data above the 100GB
- $400 per user/month for advanced features and dashboards
New Relic Linux Application Monitoring Pricing at Scale
A mid-sized SaaS company ingesting 45TB (~45,000 GB) of telemetry data per month and with 10 full users, the cost would come around ~$25,990/month.
Techfit
New Relic is a good fit for teams that want fast instrumentation and application-focused insights, especially in developer-driven organizations. However, for Linux-heavy environments at scale, its pricing model and lack of deep kernel observability make it less suitable compared to newer, cost-predictable alternatives.
4. Dynatrace
Known for
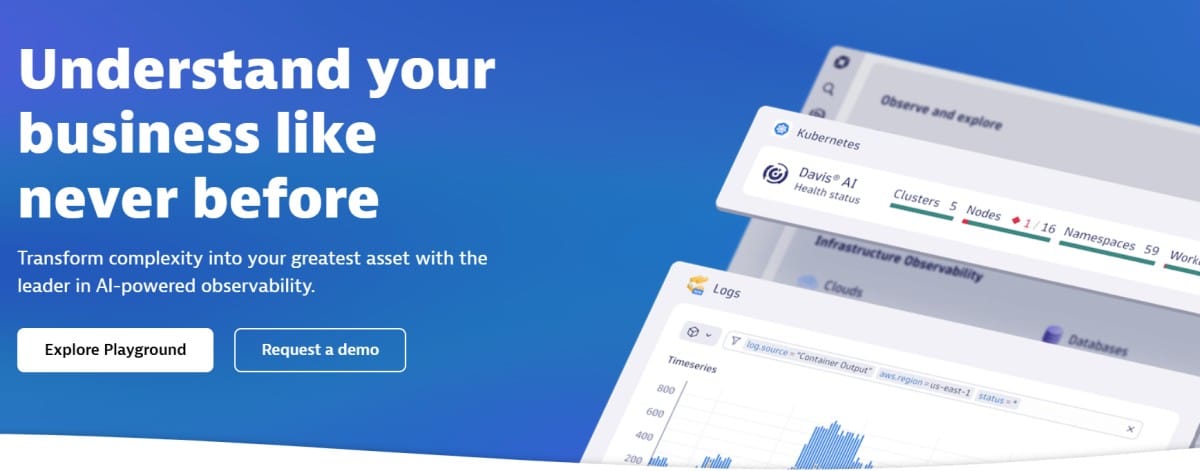
Dynatrace is known for its AI-driven observability platform that emphasizes automation through its Davis AI engine. It is widely used in large enterprises to monitor complex infrastructures spanning Linux servers, containers, cloud services, and applications. Teams often value its automated root cause analysis, though licensing costs and platform complexity can be barriers for Linux-heavy operations.
Linux Application Monitoring Features
- Monitors Linux hosts with detailed CPU, memory, disk I/O, and network metrics through installed OneAgents
- Provides process- and service-level insights for Linux applications such as Apache, Nginx, PostgreSQL, and JVM workloads
- Strong Kubernetes and Docker integrations to map Linux containerized workloads and cluster dependencies
- Offers anomaly detection based on Linux system events, resource saturation, and application-layer errors
- Limited flexibility for kernel-level tracing since it does not natively leverage eBPF
Key Features
- AI-powered anomaly detection and root cause analysis (Davis AI)
- Full-stack APM with distributed tracing and service dependency mapping
- Infrastructure monitoring across Linux servers, containers, and cloud platforms
- Centralized log ingestion and analytics
- Application security module for runtime vulnerability detection
- Synthetic and real user monitoring for end-to-end experience tracking
Pros
- Strong automation and root cause analysis capabilities
- Deep integration across enterprise-scale hybrid and multi-cloud environments
- Robust dashboards and visualizations of Linux service dependencies
- Built-in security module for proactive risk detection
Cons
- Pricing tied to hosts and consumption can be prohibitive for Linux-heavy environments
- Higher learning curve due to platform complexity and AI-driven workflows
Pricing
- Full-Stack Monitoring: $0.08 per hour for an 8 GiB host
- Log Management & Analytics (Ingest & Process): $0.20 per GB
Dynatrace Linux Application Monitoring Pricing at Scale
For a mid-sized SaaS company operating 125 APM hosts, 200 infrastructure hosts, ingesting approximately 10 TB (≈10,000 GB) of logs, generating 300,000 custom metrics, consuming 1.5 million container hours, and producing around 45,000 GB of observability data egress (charged by the cloud provider) would incur an estimated monthly cost of approximately $21,850.
Techfit
Dynatrace is well-suited for large enterprises with complex Linux and hybrid infrastructures that value AI-driven automation and root cause analysis. However, its pricing model and complexity make it less practical for smaller teams or Linux environments that need cost predictability and lightweight deployments.
5. Zabbix
Known for
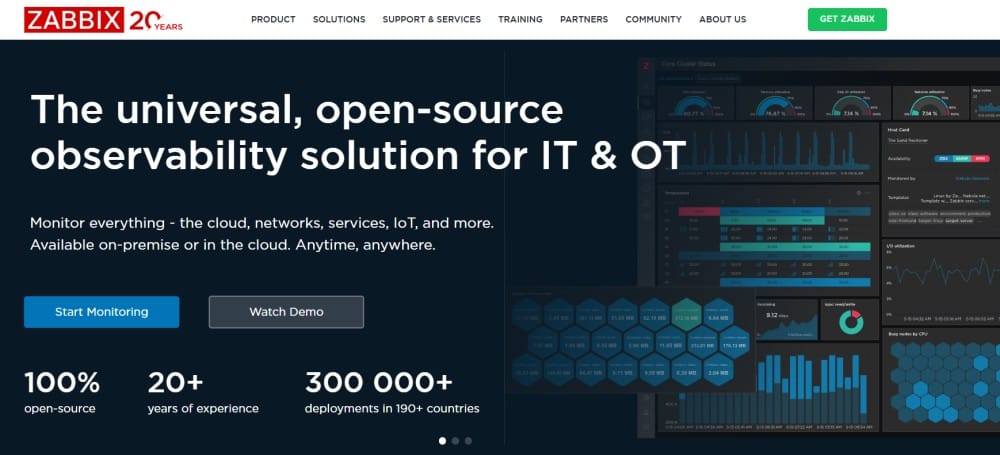
Zabbix is known as a long-standing open-source monitoring platform that offers agent-based and agentless monitoring across servers, networks, and applications. It is widely trusted in traditional sysadmin and enterprise IT circles for its flexibility and extensive community support. Many teams choose Zabbix for Linux monitoring because it is free to use and highly customizable, though it requires significant setup and maintenance effort.
Linux Application Monitoring Features
- Provides deep Linux host monitoring via Zabbix agents, collecting CPU, memory, disk, and network usage directly from system interfaces
- Supports process-level tracking for Linux services such as Apache, MySQL, and Nginx
- Integrates with systemd and syslog for Linux log collection and alerting
- Offers SNMP, IPMI, and SSH-based checks for Linux hardware and virtualized environments
- Can be extended with community templates to monitor kernel parameters and application performance on Linux servers
Key Features
- Infrastructure monitoring across servers, VMs, and networks
- Flexible alerting system with escalation rules
- Auto-discovery of Linux hosts and services
- Customizable dashboards and visualization tools
- Native support for distributed monitoring at scale
- Large open-source community providing templates and extensions
Pros
- Completely free and open-source
- Highly customizable and flexible for Linux use cases
- Strong community with thousands of ready-to-use templates
- Scales well for traditional Linux server fleets
Cons
- Steeper learning curve compared to commercial tools
- Requires more manual setup and configuration for Linux applications
Pricing
Zabbix Cloud Tiers:
- Medium: $750/month
- Large: $1,875/month
- xLarge: $2,500/month
- 2xLarge: $5,000/month
Zabbix Linux Application Monitoring Pricing at Scale
For a mid-sized company ingesting 10 TB/month of Linux observability data, Zabbix Cloud’s calculator suggests a Nano tier at $50/month, but the dominant cost comes from storage. At $0.30/GB storage equivalent, 10,000 GB equals $2,997/month, bringing the total to about $3,047/month ($50 + $2,997). This shows how Zabbix pricing is driven more by storage requirements than by host or tier size.
Techfit
Zabbix is a solid choice for Linux system administrators in enterprises or government organizations who need a free, flexible monitoring solution and have the in-house expertise to manage it. It’s best suited for traditional Linux fleets where cost control is critical, but it lacks the modern observability depth required by cloud-native or container-heavy workloads.
6. Better Stack

Known for
Better Stack is known as a modern uptime and log management platform that emphasizes simplicity, sleek dashboards, and collaboration features. It has gained popularity among startups and agile teams that want fast setup and lightweight observability without the overhead of enterprise tools. Many choose it as a cost-friendly alternative for Linux monitoring, though it doesn’t cover deep kernel-level observability.
Linux Application Monitoring Features
- Provides Linux uptime monitoring with fast incident detection and alerting
- Collects host-level CPU, memory, disk, and network metrics via lightweight agents and integrations
- Ingests Linux system logs, including syslog and journald, for centralized analysis
- Offers process monitoring for Linux services like Nginx, Apache, and PostgreSQL through built-in integrations
- Kubernetes and Docker support allows monitoring of Linux containers and clusters, though coverage is lighter compared to full APM suites
Key Features
- Uptime and API monitoring with customizable checks
- Log management with structured search and alerts
- Dashboards for system metrics and application health
- Team collaboration features (incident timelines, Slack/Teams integrations)
- Simple alert routing with on-call scheduling and escalation policies
- Integrations with popular developer tools like GitHub, PagerDuty, and Sentry
Pros
- Sleek, modern UI with easy setup
- Affordable pricing compared to large APM vendors
- Strong log management capabilities for Linux workloads
- Built-in collaboration features help reduce incident response time
Cons
- Expensive when scaling operations.
- Users report missing features like outgoing webhooks that limit usability.
- Steep learning curve.
- Complex initial setup and configuration.
Pricing
- Free tier available for personal projects
- Logs: $0.15/GB
- Metrics: $7.50, 2TB included
- Errors: $0.000075/exception
Better Stack Linux Application Monitoring Pricing at Scale
For a mid-sized SaaS company operating 125 APM hosts, ingesting 25TB(~25, OOOGB) of data by APM hosts, 10TB (~10,000GB) of logs, 10TB (~10,000GB) of infra hosts, and 45,000GB of observability data (charged by the cloud provider), the cost would come around $20,550/month.
Techfit
Better Stack is a good fit for startups and small-to-mid teams running Linux applications that prioritize affordable monitoring, log centralization, and easy collaboration. It works best where uptime, API checks, and log visibility are the main needs, rather than deep Linux kernel or distributed tracing observability.
7. Checkmk
Known for
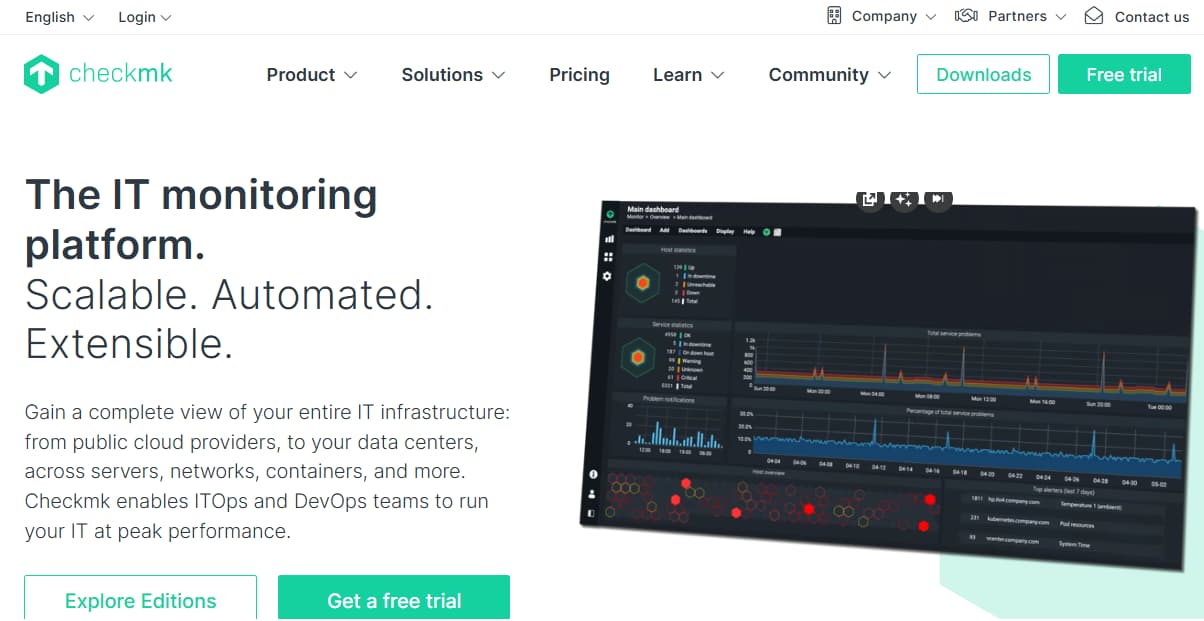
Checkmk is known as a flexible open-source and enterprise monitoring solution with strong support for Linux and hybrid infrastructures. Built in Germany, it is trusted by sysadmins for its stability and efficiency in monitoring servers, applications, and networks. Many teams choose Checkmk for Linux because it blends open-source flexibility with enterprise-grade automation.
Linux Application Monitoring Features
- Provides deep Linux host monitoring using Checkmk agents that collect CPU, memory, disk, and network metrics directly from /proc and other system interfaces
- Monitors Linux services such as Apache, MySQL, Nginx, and PostgreSQL with ready-to-use plugins
- Collects system logs via syslog and journald for alerting and correlation
- Supports process and kernel monitoring with built-in checks for load averages, I/O wait, and swap activity
- Integrates with Docker and Kubernetes for Linux container monitoring and resource attribution
Key Features
- Unified monitoring of infrastructure, applications, and networks
- 2,000+ ready-to-use plugins covering Linux services and applications
- Automated service discovery for Linux hosts and containers
- Advanced dashboards and reporting features
- Flexible rule-based configuration to fine-tune Linux checks
- Integration with ticketing and alerting systems (Slack, PagerDuty, JIRA)
Pros
- Strong Linux support with hundreds of pre-built checks
- Scalable architecture for large Linux server fleets
- Flexible configuration and automation with rule-based monitoring
- Available as both open-source (RAW) and enterprise editions
Cons
- Requires more setup compared to SaaS APMs
- Learning curve can be steep for new users
Pricing
- Raw Edition: Free (open source, no support)
- Enterprise Edition: $225/month
- Cloud Edition: $300/month
- MSP Edition: $350/month
Checkmk Linux Application Monitoring Pricing at Scale
For a mid-sized company ingesting 10 TB/month of Linux observability data, Checkmk Cloud’s base license costs $300/month. However, the pricing also scales with the number of services and hosts being monitored. Assuming 50 Linux hosts with ~200 services each (10,000 services total), the subscription typically rises into the $3,000–$4,000/month range, depending on support level and add-ons. With log storage and extra features included, the monthly bill is realistically close to $4,500/month for 10 TB workloads at scale.
Techfit
Checkmk is best suited for Linux system administrators and enterprises that want a powerful, flexible monitoring solution with strong automation. It’s ideal for traditional Linux fleets and hybrid infrastructures where sysadmins want control, but it may lack the modern observability depth (e.g., distributed tracing, smart sampling) that cloud-native teams require.
8. Grafana
Known for
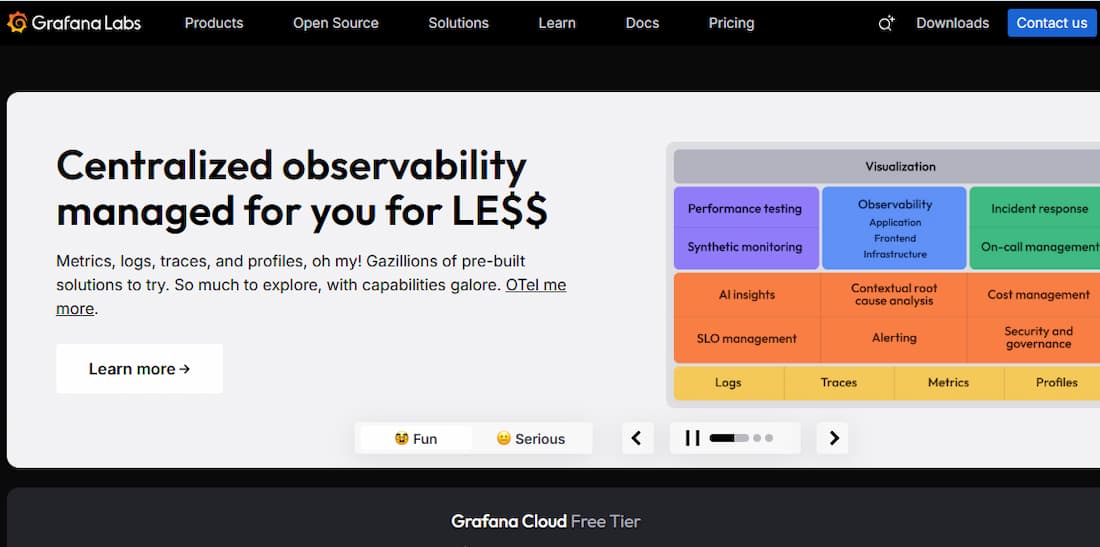
Grafana is known as the leading open-source visualization platform, widely used for turning metrics and logs into dashboards. It is especially popular in Linux-heavy environments where teams already use Prometheus, Loki, or other exporters to collect telemetry. While Grafana by itself is not a full APM, it serves as the central interface for Linux observability stacks.
Linux Application Monitoring Features
- Visualizes Linux host metrics collected by Prometheus node_exporter (CPU, memory, disk, network)
- Integrates with system logs through Grafana Loki, enabling search and correlation for journald and syslog data
- Supports Linux process and service monitoring via pre-built dashboards for Nginx, MySQL, Redis, and PostgreSQL
- Works with cAdvisor and Kubernetes exporters to monitor Linux containerized workloads
- Can integrate with eBPF-based exporters for kernel-level insights into syscalls and network performance
Key Features
- Highly customizable dashboards for metrics, logs, and traces
- Supports more than 100 data sources, including Prometheus, InfluxDB, Elasticsearch, and Loki
- Alerting engine with routing to Slack, PagerDuty, and other tools
- Grafana Tempo for distributed tracing
- Grafana Loki for log aggregation and correlation
- Enterprise edition adds RBAC, reporting, and extended integrations
Pros
- Free and open-source core platform
- Extremely flexible with rich visualization options
- Strong community and ecosystem of plugins and dashboards
- Easy integration with Linux monitoring exporters like node_exporter and cAdvisor
Cons
- Requires Prometheus, Loki, or Tempo for a complete Linux observability setup
- More setup and management overhead compared to SaaS APMs
- Expensive at scale
Pricing
- Grafana OSS is free and open-source
- Logs (Loki) → $0.50 per GB ingested
- Metrics (Mimir) → $6.50 per 1k active series/month
- Traces (Tempo) → $0.50 per GB ingested
Grafana Linux Application Monitoring Pricing at Scale
For a mid-sized company operating 125 APM hosts, 200 infra hosts, 10TB(~10,000 GB) of ingested logs, and 45,000GB of observability data out(charged by cloud provider), the cost would come around ~$11,875/month.
Techfit
Grafana is an excellent fit for Linux teams already running Prometheus and exporters who want powerful visualization and alerting. It works best as the “front-end” of Linux observability stacks, but requires complementary tools for full APM functionality. Enterprises that want an open-source foundation with flexible dashboards will find Grafana invaluable, though smaller teams may prefer all-in-one Linux monitoring platforms.
Conclusion
Linux powers most of today’s infrastructure, and monitoring it means going beyond CPU and memory to capture logs, traces, and container-level insights. The tools we reviewed — from Zabbix, Checkmk, and Grafana to Datadog, New Relic, and Dynatrace — each bring strengths but also trade-offs in cost, and complexity.
CubeAPM stands apart with Linux-native observability features like journald log ingestion, cgroups v2 attribution, and eBPF-based kernel insights — all at a flat $0.15/GB. For teams that want predictable costs and deeper visibility into Linux workloads, CubeAPM is the best all-in-one solution.
Disclaimer: The information in this article reflects the latest details available at the time of publication and may change as technologies and products evolve.
FAQs
1. What is a Linux application monitoring tool?
A Linux application monitoring tool tracks the performance and health of applications and services running on Linux servers. Modern options like CubeAPM go further by unifying metrics, logs, traces, and errors into one platform, so Linux admins can move from server-level metrics to root cause analysis in seconds.
2. Why is Linux application monitoring important?
Linux powers the majority of global server infrastructure, making visibility essential. Without it, bottlenecks in containers or kernel-level issues often go unnoticed. CubeAPM helps Linux teams stay ahead by providing journald log ingestion, eBPF-based syscall insights, and cgroups v2 attribution, ensuring problems are caught before they impact users.
3. How do Linux monitoring tools differ from general monitoring tools?
General monitoring tools only track surface-level metrics like CPU or memory. Linux monitoring tools — especially CubeAPM — are designed to capture Linux-native telemetry sources like /proc, /sys, journald, and Kubernetes stats. This depth ensures accurate visibility into services and containers running on Linux.
4. What challenges do teams face with Linux monitoring?
Common challenges include unpredictable costs, alert fatigue, and blind spots in containerized environments. Many legacy vendors charge per host or user, which scales poorly. CubeAPM solves this with flat $0.15/GB ingestion pricing and smart sampling, giving Linux teams full observability without budget surprises.
5. Which Linux monitoring tool is best for enterprises?
Enterprises running large Linux fleets often need compliance, on-prem hosting, and predictable pricing. CubeAPM is purpose-built for this — offering unlimited retention, self-hosting options for regulated industries, and Slack/WhatsApp support with sub-5-minute response times. It’s the most cost-effective way to monitor Linux at scale.


