Kubernetes powers everything from hyperscale SaaS to lean startups, but its dynamic pods, autoscaling, and multi-cluster setups add heavy complexity. Teams struggle with cardinality spikes, rising log costs, and tool sprawl across APM and infra stacks.
This is where CubeAPM excels as a Kubernetes monitoring tool. CubeAPM deploys the OpenTelemetry Collector both as a DaemonSet (for pod/node metrics, logs, and resource stats) and as a Deployment in Kubernetes environments. Once ingested, it provides real-time infrastructure monitoring dashboards.
In this article, we’ll evaluate the top Kubernetes monitoring tools, comparing their features, pricing, and best-fit use cases.
Top 9 Kubernetes Monitoring Tools
- CubeAPM
- Datadog
- New Relic + Pixie
- Dynatrace
- Grafana + Prometheus
- SigNoz
- Elastic Observability (ELK)
- Sematext
- cAdvisor
What is a Kubernetes Monitoring Tool?
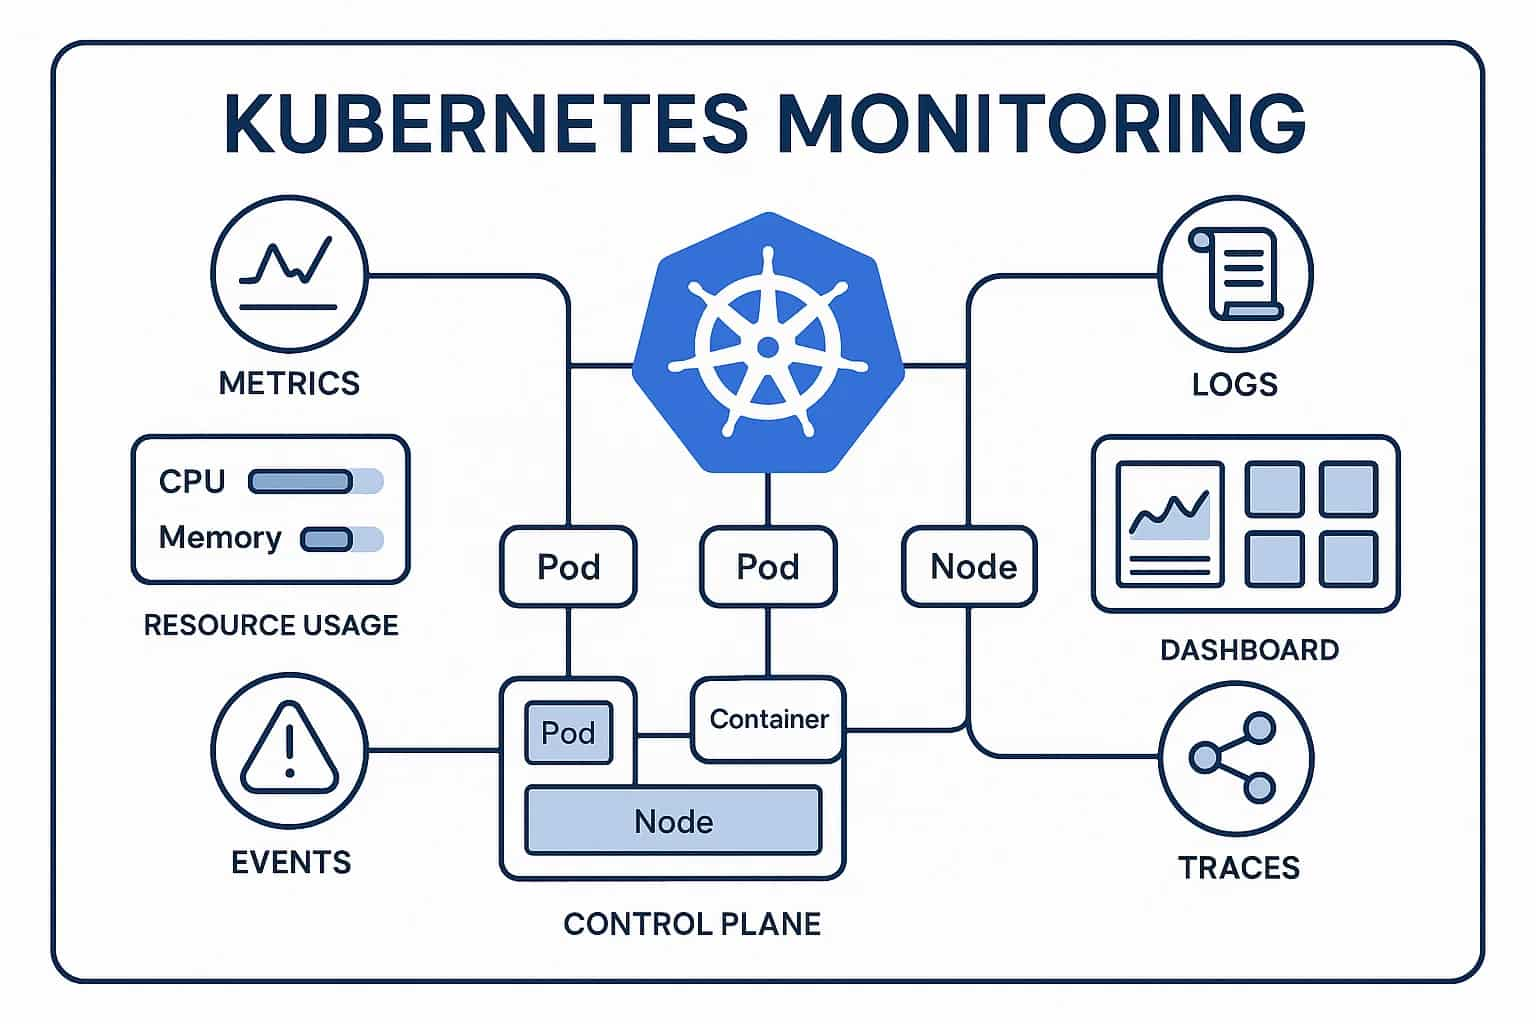
A Kubernetes monitoring tool is designed to track, analyze, and optimize workloads running inside Kubernetes clusters. Unlike traditional APM platforms, Kubernetes monitoring must handle the ephemeral nature of pods, dynamic autoscaling, and multi-cluster operations. These tools collect telemetry such as pod restarts, API server latency, container resource utilization, and deployment events, then correlate this data with logs and traces to help teams troubleshoot issues faster, prevent downtime, and control costs.
At their core, Kubernetes monitoring tools help organizations:
- Track cluster health by continuously monitoring nodes, pods, containers, and control-plane components. This ensures workloads run smoothly, resources are used efficiently, and failures in critical services are detected early — something modern observability tools must deliver at scale.
- Detect issues early through Kubernetes event tracking, such as CrashLoopBackOff, OOMKilled containers, or unschedulable pods. By surfacing these signals in real time, teams can quickly act before small problems grow into outages.
- Correlate signals seamlessly by linking metrics, logs, traces, and events into one unified workflow. This eliminates tool sprawl and provides a single source of truth.
- Optimize costs with smart sampling, tiered data retention, and cardinality management. These features prevent telemetry data from overwhelming storage or budgets, especially in large multi-cluster Kubernetes environments.
- Support compliance with deployment flexibility — whether SaaS, hybrid, or self-hosted. This gives enterprises control over data residency and governance.
Example: How CubeAPM Handles Kubernetes Monitoring
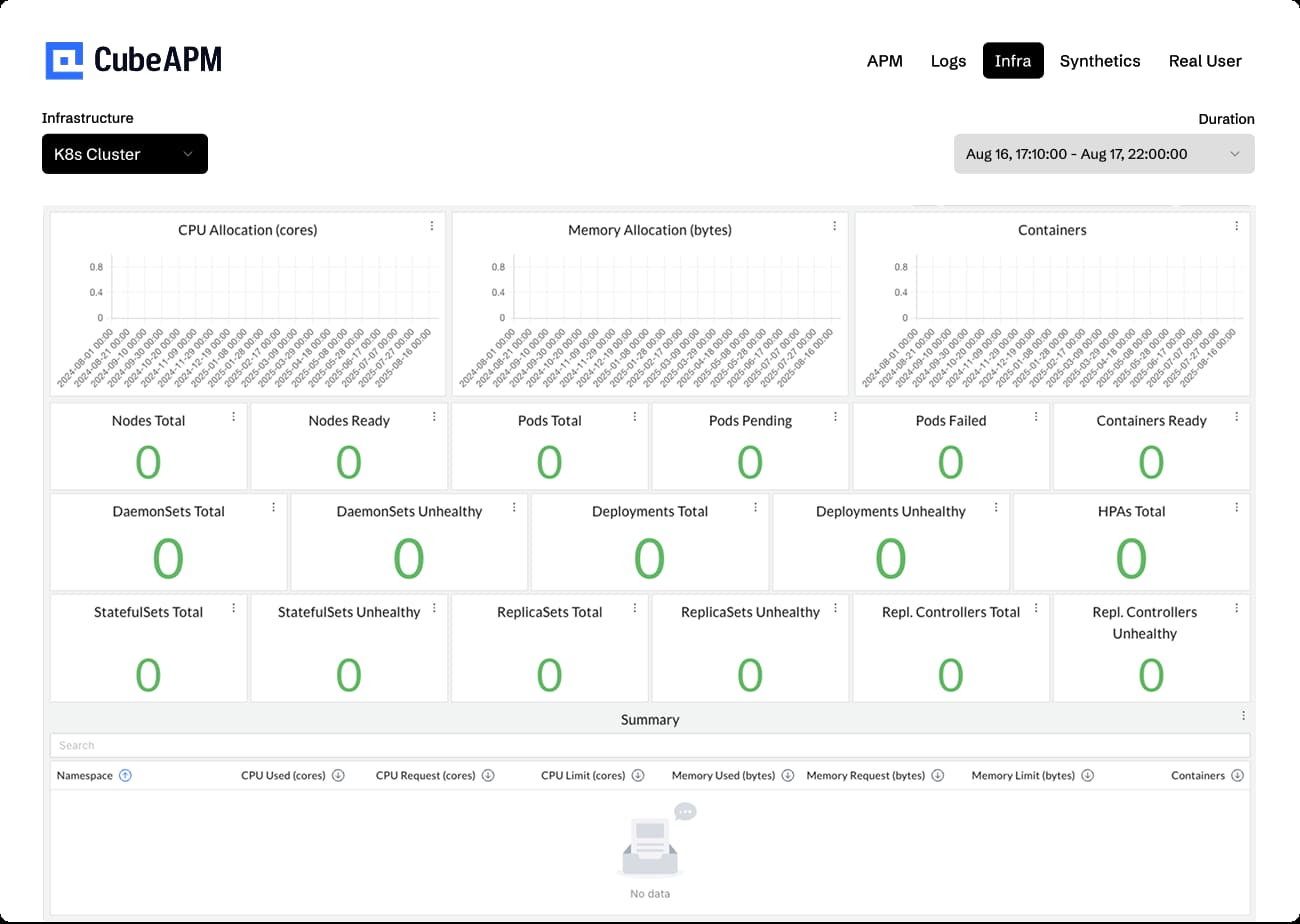
CubeAPM is purpose-built for Kubernetes-heavy environments, offering end-to-end visibility across clusters, nodes, pods, and applications. Its OTEL-native pipeline and unified MELT (Metrics, Events, Logs, Traces) approach allow teams to seamlessly move from high-level cluster metrics to detailed pod logs or traces.
- Infrastructure Monitoring: CubeAPM’s Infrastructure Monitoring dashboards provide real-time visibility into node and container health. Teams can monitor CPU, memory, and network usage at both pod and node levels, with metadata enrichment from Kubernetes. This helps identify bottlenecks like noisy neighbors or resource starvation before they impact workloads.
- Pod & Service Tracing: Enables distributed tracing, where teams can dive into how Kubernetes services interact across clusters. Engineers can view latency bottlenecks, API errors, and slow database queries in real time. This is critical for debugging complex microservices environments where a single failing pod can cascade into user-facing outages.
- Event & Error Tracking: CubeAPM captures Kubernetes events such as CrashLoopBackOffs, failed deployments, or pod evictions and ties them directly to metrics and traces. This correlation reduces mean time to resolution (MTTR) by showing not just that an error occurred, but why it occurred in the context of infrastructure and application health.
- Cost Efficiency at Scale: Unlike traditional vendors, CubeAPM applies smart sampling, retention management, and per-GB pricing to keep costs predictable—even in clusters generating terabytes of telemetry each month. This makes it especially effective for teams running multi-cluster or hybrid deployments, where data growth can otherwise spiral out of control.
Why Teams Choose Different Kubernetes Monitoring Tools
Kubernetes monitoring isn’t one-size-fits-all. Different teams pick different tools depending on how they run clusters, manage costs, and handle compliance. Below are the key reasons why choices vary in 2025.
1. OTel Support
Some teams standardize on OpenTelemetry (OTEL) for flexibility, ensuring they can send telemetry to any backend and apply smart sampling. Others stay with Prometheus for native kube-state-metrics and time-series monitoring, often extended with Thanos or Mimir for multi-cluster scale. Meanwhile, organizations that want zero-code setup lean on eBPF-based tools like Pixie, which capture pod-level telemetry without extra agents.
2. Depth of Kubernetes Signal Coverage
Observability depends on how deep tools go into Kubernetes signals. Teams want visibility into the control plane, API server, and etcd, plus node and pod health. They also need event tracking for CrashLoopBackOffs, pod evictions, and failed deployments, along with container-level CPU, memory, and network usage. This is why many teams integrate Kubernetes monitoring directly with their infrastructure monitoring stack to get a single, correlated view.
3. Scale and Cardinality Management
As clusters scale into thousands of pods, telemetry explodes. Teams must manage metric cardinality (labels and series counts) and avoid runaway storage costs. The right tools offer features like label filtering, aggregation, and sampling to keep observability both accurate and affordable.
4. Cost Models and Ingestion Strategy
Pricing models influence adoption heavily. Some platforms charge per host or per pod, while others use ingestion-based pricing per GB of logs, metrics, and traces. Teams choose tools that align with their workloads—dense clusters often prefer per-GB billing, while lighter clusters might benefit from per-host models. Predictable costs are a priority for enterprise monitoring strategies, where budgets are tight and telemetry growth is constant.
5. Deployment Model and Compliance Needs
For regulated industries like finance or healthcare, data residency and compliance requirements make self-hosted or hybrid options attractive. Others choose SaaS-based tools for speed and ease of use. The ability to deploy as SaaS, BYOC (bring your own cloud), or fully on-prem often determines which platform fits best.
6. Automation and AI Assistance
Large enterprises look for platforms with AI-driven root cause analysis and anomaly detection. These reduce alert fatigue and accelerate remediation by automatically connecting metrics, logs, and traces across Kubernetes workloads. Tools with built-in AI or automation appeal to teams running very large, complex estates.
7. Ecosystem Fit and Team Skills
The monitoring tool must fit the team’s skills and existing stack. For example, SRE teams already familiar with Prometheus and Grafana prefer to extend with OSS-friendly tools like Loki or Mimir. Teams running service meshes such as Istio or Linkerd want platforms that can ingest mesh telemetry out of the box.
Top 8 Kubernetes Monitoring Tools
1. CubeAPM
Known For
CubeAPM is known as a Kubernetes-first, OpenTelemetry-native observability platform that unifies metrics, logs, traces, RUM, synthetics, error tracking, and infrastructure monitoring. It offers both SaaS and self-hosted deployment, making it highly flexible for compliance-heavy teams.
Why Use CubeAPM for Kubernetes Monitoring (Key K8s Features)
- OTEL & Prometheus Native: Fully supports OpenTelemetry collectors and Prometheus metrics, ensuring no vendor lock-in.
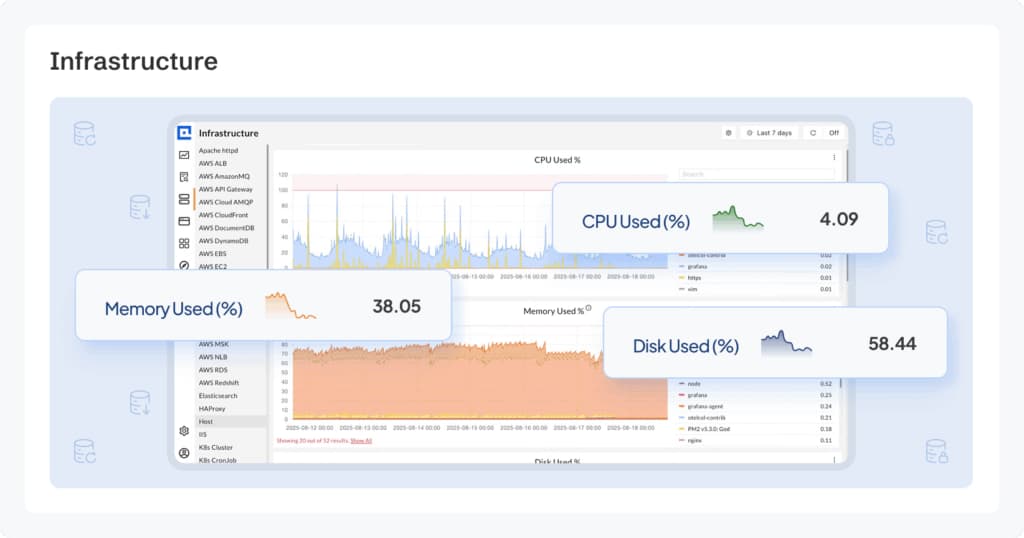
- Infra dashboards: node/pod CPU, memory, disk, and network, enriched with Kubernetes metadata.
- Smart Sampling: Context-aware sampling keeps error and latency traces while filtering noise, cutting costs significantly.
- K8s Metadata Enrichment: Auto-collects kubelet, control plane, pod, and cluster events with metadata correlation.
- Agent Compatibility: Works with Datadog, New Relic, and Prometheus agents for painless migration.
Key Features
- OpenTelemetry-native pipelines with drop-in compatibility.
- Full MELT coverage (metrics, events, logs, traces).
- Smart sampling to reduce cardinality and costs.
- Prebuilt Kubernetes infra dashboards (nodes, pods, clusters).
- SaaS and self-hosted deployment options.
Pros
- 60–80% cheaper than incumbents like Datadog and New Relic at Kubernetes scale.
- 800+ integrations across infra, cloud, and apps.
- Predictable per-GB pricing with no user license fees.
- Flexible deployment (SaaS or self-hosted) to suit compliance needs.
- Fast, direct support with engineers available via Slack/WhatsApp.
Cons
- Not suited for teams looking for off-prem solutions
- Strictly an observability platform and does not support cloud security management
Pricing
- Flat Pricing of $0.15/GB for data ingested
CubeAPM Kubernetes Monitoring Pricing At Scale
*All pricing comparisons are calculated using standardized Small/Medium/Large team profiles defined in our internal benchmarking sheet, based on fixed log, metrics, trace, and retention assumptions. Actual pricing may vary by usage, region, and plan structure. Please confirm current pricing with each vendor.
For a mid-sized SaaS company ingesting 45TB(~45,000) total monthly data ingestion and 45,000TB of observability data outcharged by the cloud provider, the total cost will be about ~$7200/month.
Techfit
CubeAPM is best suited for Kubernetes-heavy engineering teams that need deep observability without runaway costs. It fits organizations running multi-cluster, cloud-native, or hybrid environments where cost predictability, compliance, and scalability matter. With OTEL-native pipelines, full MELT coverage, and smart sampling, CubeAPM helps enterprises ingest large volumes of telemetry while keeping budgets under control. Its ability to run in SaaS or self-hosted mode makes it ideal for industries like finance, healthcare, and government, where data residency and strict compliance requirements are non-negotiable.
2. Datadog
Known For
Datadog is widely recognized as a leading SaaS observability platform, trusted for its massive integration ecosystem (+900), Kubernetes auto-discovery, and rich visualization. It covers the full observability stack — metrics, logs, traces, RUM, synthetics, and security monitoring — in one managed platform.
Why Use Datadog for Kubernetes Monitoring (Key K8s Features)
- Kubernetes Auto-Discovery: Dynamically detects pods, services, and containers with minimal setup.
- Live Container Map: Real-time view of pod/container health and resource use.
- Kubernetes events captured: pod scheduling failures, OOMKilled, CrashLoopBackOff.
- Cluster Agent: Collects kube-state-metrics, control plane, and workload data.
Key Features
- Unified dashboards covering APM, logs, security, and RUM.
- AI-driven anomaly detection and alert correlation.
- Role-based access controls and compliance features.
- Advanced synthetics and RUM capabilities.
Pros
- 900+ integrations across cloud, infra, and application ecosystems.
- Strong visualization tools with customizable dashboards and queries.
- All-in-one SaaS platform, reducing the need to maintain separate OSS stacks.
Cons
- The cost is extremely high for small and growing teams
- Steep learning curve
- Complexity makes navigation a challenge
Pricing
- APM (Pro Plan): $35/host/month
- Infra (Pro Plan): $15/host/month
- Ingested Logs: $0.10 per ingested or scanned GB per month
Datadog Kubernetes Monitoring Pricing At Scale
For a mid-sized SaaS company operating 125 APM hosts, 40 profiled hosts, 100 profiled container hosts, 500,000,000 indexed spans, 200 infra hosts, 1,500,000 container hours, 300,000 custom metrics, and ingesting around 10TB(~10,000 GB) of logs per month with 3500 indexed logs, the monthly cost would be around ~$27,475/month.
Techfit
Datadog is best for teams that want a managed, all-in-one ecosystem with strong integrations across cloud, infra, and application stacks. It fits organizations with diverse services and multi-cloud deployments that value out-of-the-box dashboards, curated alerts, and broad support for third-party tools. Datadog’s Kubernetes auto-discovery and live container maps make it attractive for fast-moving teams, but its modular pricing model can become a challenge at scale.
3. Dynatrace
Known For
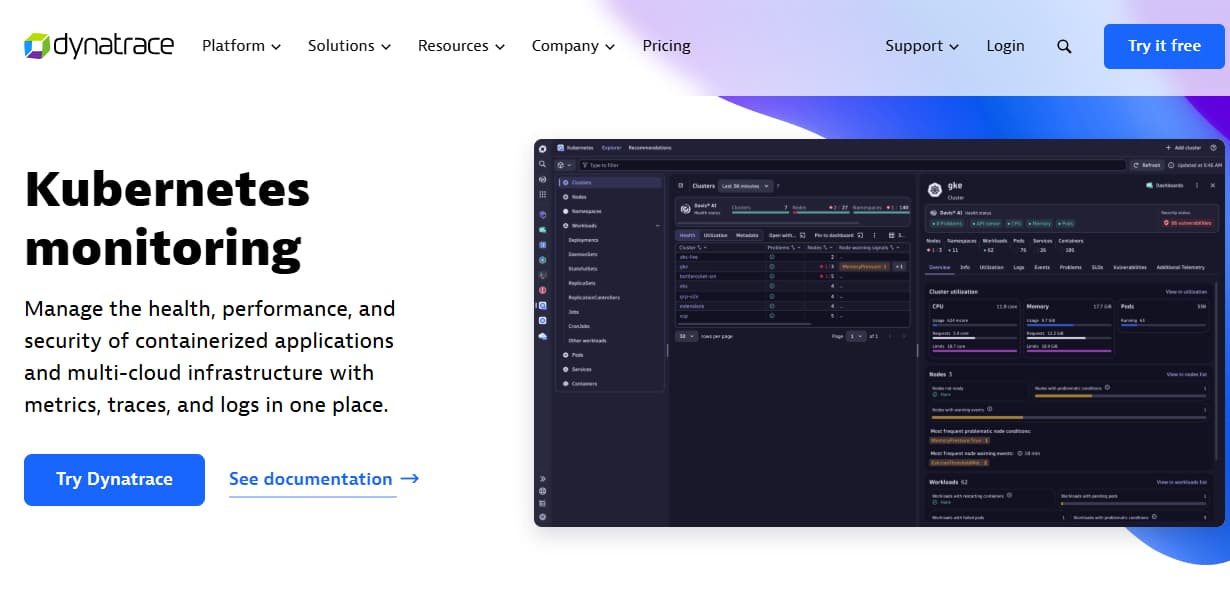
Dynatrace is known for its AI-driven observability and automation. Its patented Davis® AI engine provides automated root-cause analysis, anomaly detection, and predictive insights. Dynatrace is a favorite among large enterprises running complex, multi-cluster Kubernetes deployments.
Why Use Dynatrace for Kubernetes Monitoring (Key K8s Features)
- OneAgent: Automatically instruments Kubernetes workloads with minimal manual setup.
- Kubernetes Cluster Explorer: Visualizes nodes, pods, workloads, and services in a single interface.
- Davis® AI: Correlates metrics, logs, and traces to identify root causes and reduce alert fatigue.
- Cloud-Native Security: Monitors vulnerabilities, compliance, and runtime behavior in Kubernetes clusters.
- Full-Stack Observability: Covers infra, APM, digital experience monitoring, and security in one SaaS platform.
Key Features
- Davis® AI for root-cause analysis and predictive insights.
- Full-stack monitoring: apps, infra, logs, and user experience.
- Real-time service and dependency maps.
- Smart baselining with anomaly detection.
- Enterprise-grade compliance and governance.
Pros
- Strong AI capabilities with automated RCA and anomaly detection.
- End-to-end coverage across infrastructure, applications, and user experience.
- Enterprise-grade features suited for large-scale Kubernetes environments.
- Minimal manual configuration with OneAgent.
Cons
- Expesnice as data volumes grow.
- Complex platform, requiring training to use advanced features effectively.
- Overwhelming UI for new users.
Pricing
- Infrastructure Monitoring: $29 / mo per host
- Full-Stack Monitoring: $58 / mo per 8 GiB host
Dynatrace Kubernetes Monitoring Pricing At Scale
A midsized SaaS company operating 125 APM hosts, 200 infra hosts, 10TB(~10,000 GB) of ingested logs, 300,000 custom metrics, 1,500,000 container hours, and 45,000GB of observability data out(charged by cloud provider), the cost would come around ~$21,850/month.
Techfit
Dynatrace is best for enterprises with complex Kubernetes estates that rely on AI-driven automation and predictive analytics to manage observability at scale. With Davis® AI providing root-cause analysis and dependency mapping, it fits global organizations that need to reduce operational overhead and alert fatigue. Dynatrace works well in highly regulated industries but comes at a premium price point, making it more suited to enterprises than lean teams.
4. New Relic
Known For
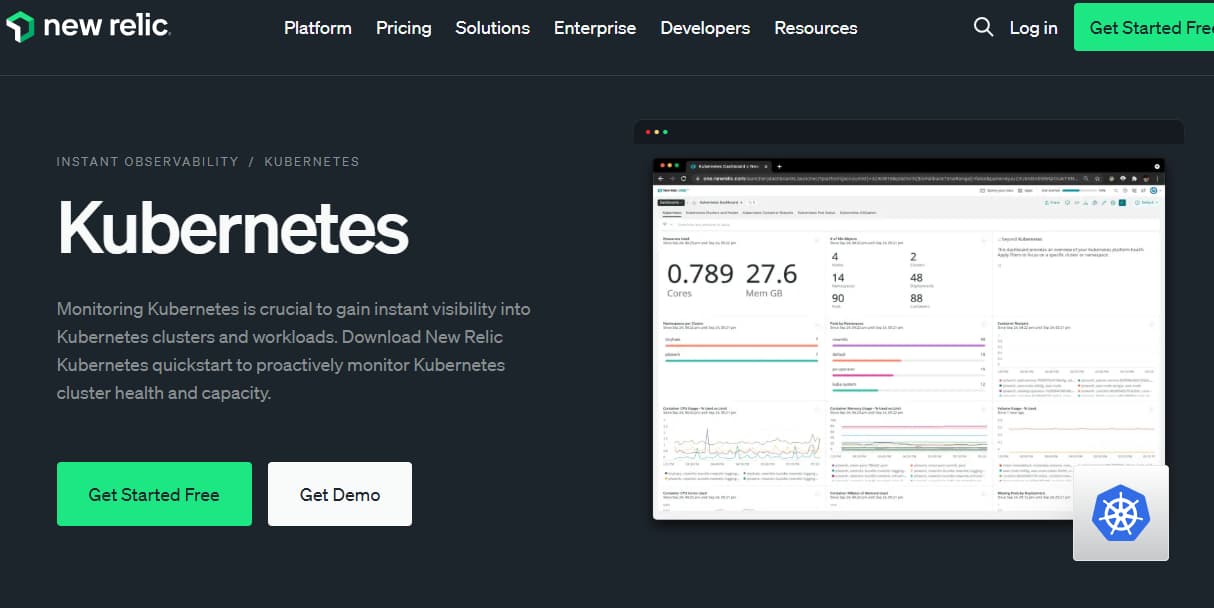
New Relic is a long-established APM and observability platform, known for its all-in-one SaaS approach and recent adoption of Pixie, which brings eBPF-powered no-code Kubernetes instrumentation. It delivers strong dashboards, distributed tracing, and application visibility but often at a high cost when scaled.
Why Use New Relic for Kubernetes Monitoring (Key K8s Features)
- Pixie eBPF Integration: Auto-attaches to pods for code-free instrumentation.
- K8s Explorer: Provides pod, node, and namespace-level health views.
- Full Observability Stack: APM, logs, metrics, traces, synthetics, and RUM combined in one SaaS platform.
- Auto-telemetry for logs and metrics at the pod level.
Key Features
- Unified telemetry platform: metrics, logs, traces, RUM.
- AI-powered anomaly detection and forecasting.
- Dashboards with golden signals (latency, throughput, errors).
- Usage-based pricing with 100GB/month free tier.
Pros
- Pixie integration offers fast Kubernetes visibility with minimal setup.
- Strong dashboards and alerting workflows for app and infra monitoring.
- Wide language and framework support for APM agents.
- Established brand trusted by large enterprises.
Cons
- Expensive as usage grows.
- Retention limits — longer retention requires higher pricing tiers.
- Steep cost curve for logs, traces, and synthetics at Kubernetes scale.
Pricing
- Free Tier: 100GB/month ingested
- Pro plan: $0.40/GB ingested beyond the free 100GB limit
- Pro Plan: $349/user for full platform user
New Relic Kubernetes Monitoring Pricing At Scale
A mid-sized SaaS company ingesting 45TB (~45,000 GB) of telemetry data per month and with 10 full users, the cost would come around ~$25,990/month.
Techfit
New Relic with Pixie is best for fast-moving development teams that want instant Kubernetes observability with minimal setup. Its eBPF-based approach makes it well-suited for environments where engineers prefer no-code instrumentation and quick onboarding. It works especially well for SaaS and product teams that need real-time pod-level insights but may not be as cost-effective for very large clusters.
5. Grafana+ Prometheus
Known For
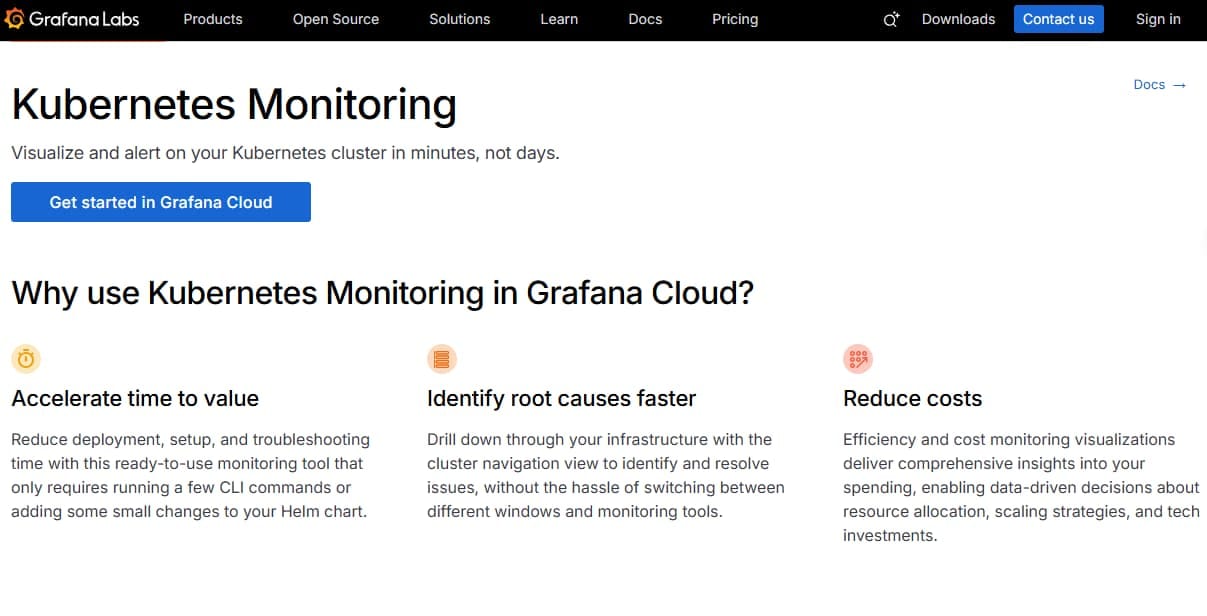
Prometheus is the de facto open-source standard for Kubernetes monitoring, collecting time-series metrics via pull-based scraping. Combined with Grafana, it delivers rich dashboards and flexible visualizations, forming the backbone of most Kubernetes observability stacks.
Why Use Prometheus + Grafana for Kubernetes Monitoring (Key K8s Features)
- kube-state-metrics Integration: Exposes Kubernetes object state metrics (deployments, nodes, pods).
- Alertmanager: Built-in alerting system for custom rules.
- Thanos/Mimir: federation and long-term storage for multi-cluster observability.
- Grafana dashboards: visualize golden signals for pods, nodes, namespaces.
Key Features
- Open-source monitoring with large ecosystem support.
- Grafana visualizations for time-series data.
- Flexible alerting via Alertmanager.
- Extendable with Loki (logs) and Tempo (traces).
- Community-driven innovation and plugins.
Pros
- Free and open-source, widely adopted across the industry.
- Large ecosystem with community exporters and integrations.
- Highly flexible in terms of customization and setup.
- Strong foundation for Kubernetes monitoring pipelines.
Cons
- Steeper learning curve for teams without prior OSS experience.
- Operational overhead, maintaining and tuning Prometheus clusters, takes time.
Pricing
- Grafana OSS: Free
- Pro plan: $19/month
- Metrics: $6.50/ 1k series
- Logs: $0.50/GB ingested
- Traces: $0.50/GB ingested
Grafana Kubernetes Monitoring Pricing At Scale
For a mid-sized SaaS company operating 125 APM hosts, 200 infrastructure hosts, 10TB (~10,000 GB) of ingested logs, and 45,000 GB of observability data (charged by the cloud provider), the cost would come around $11,875/month.
Techfit
Prometheus with Grafana is best for SRE and DevOps teams that want a flexible, open-source foundation for Kubernetes monitoring. It fits organizations that already have in-house expertise to manage scaling, retention, and federation with tools like Thanos or Mimir. This stack is ideal for teams that prioritize customization and cost control through self-hosting, though it demands engineering investment to maintain.
6. SigNoz
Known For
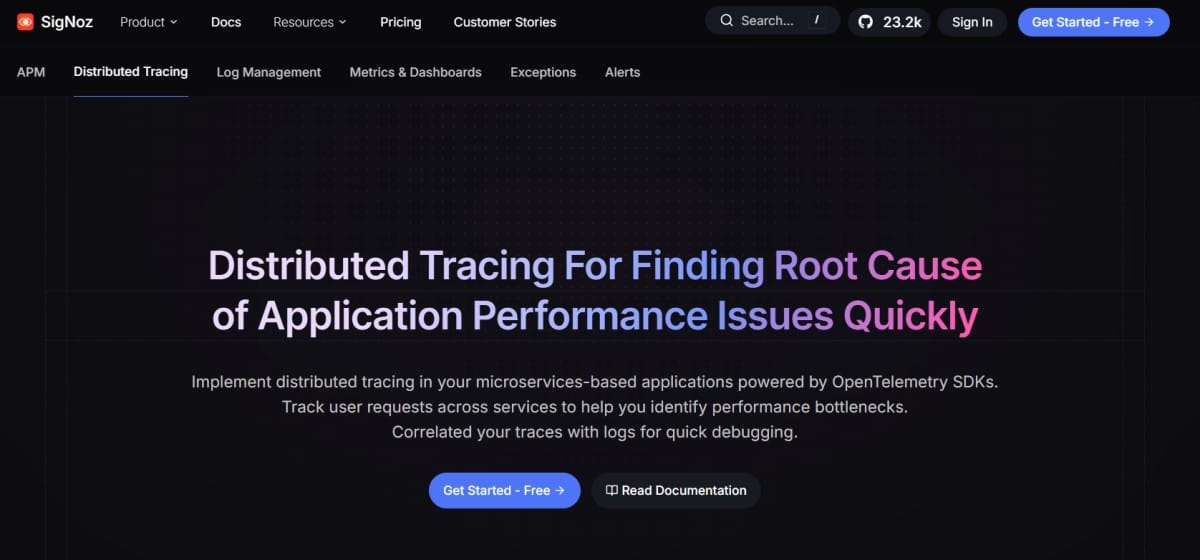
SigNoz is an open-source observability platform built on OpenTelemetry. It offers a unified view of metrics, logs, and traces with a self-hosted-first approach, making it a popular OSS alternative to SaaS APMs.
Why Use SigNoz for Kubernetes Monitoring (Key K8s Features)
- OTEL-native: Collects Kubernetes telemetry directly through OpenTelemetry collectors.
- Pre-built K8s Dashboards: Includes cluster, pod, and node monitoring out-of-the-box.
- Event monitoring: integrates Kubernetes events pipeline into observability.
Key Features
- OpenTelemetry-native ingestion for all signal types.
- Unified dashboard for logs, metrics, and traces.
- Self-hosted deployment with enterprise security.
- Active open-source community with growing adoption.
- Transparent, usage-based pricing model.
Pros
- Free and open-source, reducing licensing costs.
- Unified observability without needing separate tools.
- Good Kubernetes coverage with OTEL-native design.
- Self-hosting ensures data control for compliance-focused teams.
Cons
- Operational overhead requires infrastructure management and scaling efforts.
- Cost scales quickly as usage grows
- Steep learning curve
Pricing
- Free tier + base fee of $49/month. Charges beyond the base fee are based on data ingested:
- Traces: $0.30/GB.
- Logs: $0.30/GB.
- Metrics: $0.10/million samples.
SigNoz Kubernetes Monitoring Pricing At Scale
For a mid-sized SaaS company that ingests 25,000GB of data by APM hosts, 10,000GB of data by infrastructure hosts, 10,000GB of data by log hosts, and 45,000GB of observability data (charged by the cloud provider), the cost would be approximately $16,000.
Techfit
SigNoz is best for startups and mid-sized teams seeking an open-source alternative to commercial SaaS platforms. Its OTEL-native design and unified MELT capabilities make it appealing for teams that value self-hosting and data control. It’s a good fit for engineering teams that want enterprise-grade observability on top of OSS foundations but have the resources to manage their own clusters.
7. Elastic Observability (ELK)
Known For
Elastic Observability, built on the Elasticsearch, Logstash, and Kibana (ELK) stack, is known as a log-first platform that expanded into metrics and traces. It’s popular among organizations that already use Elasticsearch for search and want to extend it into Kubernetes observability.
Why Use Elastic for Kubernetes Monitoring (Key K8s Features)
- Kubernetes integration: Collects events, pod/container resource metrics, and API server health.
- Log-Centric Monitoring: Centralizes Kubernetes logs with deep search and filtering.
- Metrics & Dashboards: Collects infrastructure and application metrics, visualized in Kibana.
- Flexible Pipelines: Logstash and Beats support custom ingestion from Kubernetes clusters.
- Extended Ecosystem: Integrates with Elastic SIEM and security monitoring.
Key Features
- Powerful log analytics and full-text search.
- Kibana dashboards for visualization.
- APM support for distributed tracing.
- Scalable hot-warm-cold storage tiers.
- Integrations with Elastic SIEM and security tooling.
Pros
- Powerful search capabilities across large log datasets.
- Flexible ingestion pipelines to handle complex Kubernetes telemetry.
- Single ecosystem for observability and security.
- Strong visualization with Kibana dashboards.
Cons
- Expensive as usage grows.
- Retention costs increase rapidly with large volumes.
- Steep learning curve for setup and tuning.
Pricing
- Standard: $99/month
- Gold: $114/month
- Platinum: $131/month
- Enterprise: $184/month
Elastic Observability Kubernetes Monitoring Pricing At Scale
For a mid-sized SaaS company with 125 APM hosts, 20TB of event ingestion per month, and 45,000GB of observability data (charged by the cloud provider), the cost would be around $17,435.
Techfit
Elastic Observability is best for organizations that are already Elastic Stack users or those with a strong need for log-centric monitoring. Its ability to correlate logs, metrics, and traces within Kibana makes it attractive for teams managing large-scale log ingestion. It’s a strong fit for enterprises that want long-term storage tiers and security monitoring, though scaling can become expensive without careful retention planning.
8. Sematext
Known For
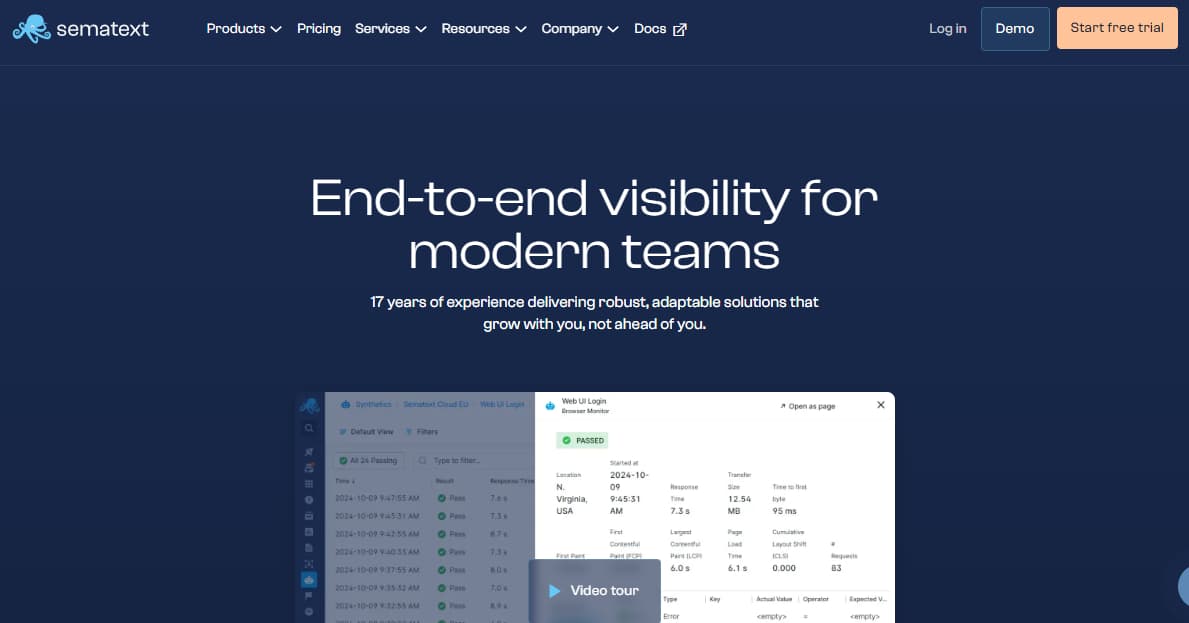
Sematext is known as a lightweight, budget-friendly observability platform that provides log management, metrics, and user experience monitoring. It’s often adopted by smaller teams looking for simpler SaaS-based Kubernetes monitoring without the complexity of larger vendors.
Why Use Sematext for Kubernetes Monitoring (Key K8s Features)
- Kubernetes Logs & Metrics: Collects container and pod-level telemetry with simple setup.
- Pre-Built Dashboards: Provides cluster, node, and pod health views out-of-the-box.
- Agent-based Kubernetes monitoring with cluster, node, and pod health metrics.
Key Features
- All-in-one SaaS for logs, metrics, traces, and RUM.
- Simple setup with lightweight agents.
- Prebuilt dashboards for cloud and apps.
- Alerting with flexible notification channels.
- Affordable entry pricing for smaller teams.
Pros
- Affordable entry point, lower base pricing than major incumbents.
- Easy to set up, designed for quick adoption.
- Covers logs, metrics, and monitoring in one simple platform.
- Good fit for smaller Kubernetes deployments.
Cons
- Costs scale quickly as usage grows.
- Steep learning curve for beginners.
- Overwhelming UI hinders usability.
Pricing
- Infrastructure Monitoring: $0.005/host/hour (≈$3.60/host/month).
- Logs: $0.10/GB ingested.
- APM/Traces: $89/month per agent.
- Synthetics: $2/test/month (40 runs per hour).
Sematext Kubernetes Monitoring Pricing At Scale
For a mid-sized company ingesting 10TB of logs per month (10,000 GB), the log cost alone comes to $1,000/month. Add 125 hosts ($180/month), 5 APM agents ($445/month), and 100 synthetic tests ($200/month). Altogether, the monthly spend would be around ~$5,800/month, before adding retention upgrades or premium support.
Techfit
Sematext is best for smaller teams and growing companies that want a lightweight SaaS solution without the overhead of managing infrastructure. It fits organizations that prioritize ease of setup and affordability while still needing Kubernetes metrics, logs, and alerts. This makes it a solid entry point for teams beginning their observability journey, though it may not provide the depth required at enterprise scale.
9. cAdvisor
Known For
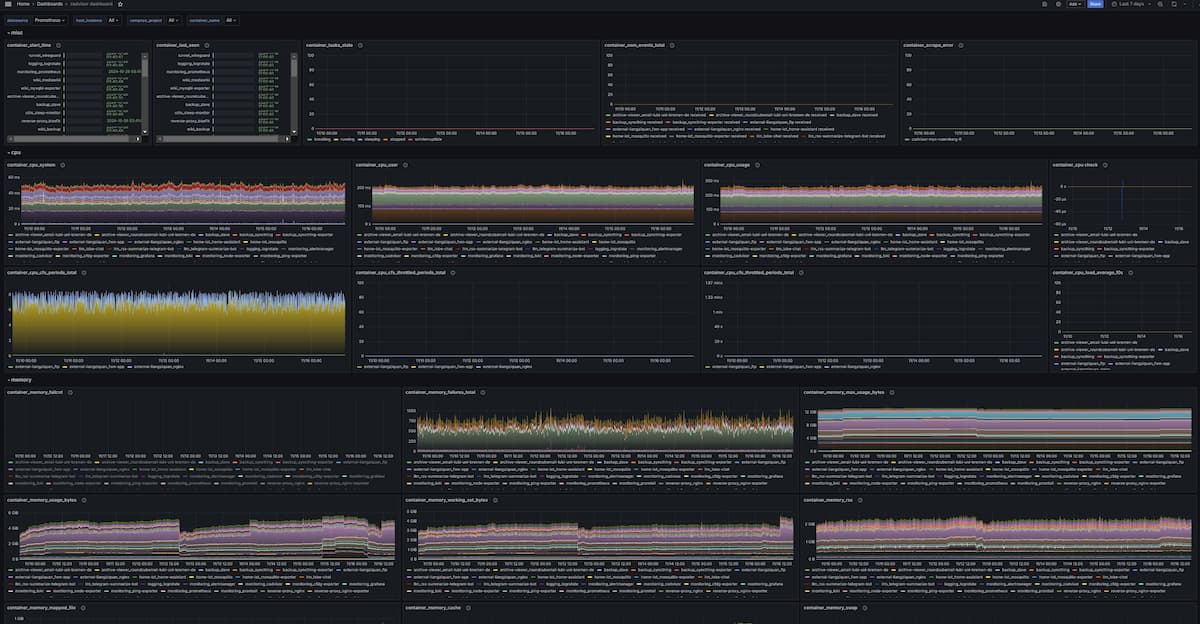
cAdvisor (Container Advisor), originally developed by Google, is a lightweight open-source tool built into the Kubernetes kubelet. It provides resource usage and performance metrics for containers and pods, making it a foundational piece for container-level monitoring.
Why Use cAdvisor for Kubernetes Monitoring (Key K8s Features)
- Container-Level Metrics: Tracks CPU, memory, filesystem, and network usage for pods and containers.
- Built-in with Kubelet: Runs by default on Kubernetes nodes, so no extra setup is needed.
- Integrates with Prometheus: Exposes metrics in a format Prometheus can scrape for dashboards and alerting.
- Low Overhead: Minimal performance impact on nodes and workloads.
- Foundation Tool: Acts as a core building block for higher-level monitoring stacks.
Key Features
- Open-source container metrics collector built into Kubelet.
- Real-time CPU, memory, disk, and network stats.
- Lightweight and resource-efficient.
- Scrape-ready for Prometheus and other backends.
- Foundation for container-level observability stacks.
Pros
- Free and open-source, bundled with Kubernetes.
- Zero setup if kubelet is running, as it exposes metrics by default.
- Lightweight with low resource consumption.
- Essential for pod/container-level telemetry.
Cons
- Complex initial setup that requires expertise
- Steep learning curve for new users
Pricing
- Free & Open Source: No costs associated, as it’s freely available under an open-source license, but operational costs apply when paired with Prometheus or long-term storage.
cAdvisor Kubernetes Monitoring Pricing At Scale
For a midsized company running 25 hosts with 500 pods and ingesting ~10TB of telemetry monthly, cAdvisor itself is free, but the real costs come from the supporting stack. To store and visualize cAdvisor metrics long-term, you’d typically pair it with Prometheus, Grafana, and a backend like Thanos or Mimir. At this scale, cloud storage for 10TB of high-cardinality time-series data can reach $2,000–$3,000/month.
Techfit
cAdvisor is best for developers and small teams who need lightweight, container-level metrics directly from Kubernetes nodes. It’s ideal as a foundational layer in observability pipelines, often paired with Prometheus and Grafana for long-term storage and visualization. While not a standalone enterprise solution, cAdvisor provides critical insights into container CPU, memory, and network usage for debugging and performance tuning.
Conclusion
Choosing the right Kubernetes monitoring tool is tough — most teams struggle with skyrocketing costs, complex multi-cluster setups, and the overhead of stitching together multiple platforms. While tools like Datadog, Dynatrace, and New Relic provide rich ecosystems, they quickly become expensive at scale. Open-source options, such as Prometheus or SigNoz, offer flexibility but require significant operational effort.
CubeAPM stands out as the only platform purpose-built for Kubernetes teams, combining OpenTelemetry-native pipelines, full MELT coverage, smart sampling, and 800+ integrations with predictable per-GB pricing. CubeAPM consistently delivers 60–80% lower costs at scale without compromising visibility.
If your team requires deep Kubernetes observability with cost predictability and deployment flexibility, CubeAPM is the ideal choice. Start with CubeAPM today and scale your Kubernetes monitoring without the cost headaches.
Disclaimer: The information in this article reflects the latest details available at the time of publication and may change as technologies and products evolve.
FAQs
1. What is the best Kubernetes monitoring tool in 2025?
CubeAPM is widely considered the best choice for Kubernetes-heavy teams thanks to its OTEL-native design, full MELT coverage, smart sampling, and predictable per-GB pricing. Other tools like Dynatrace, Datadog, and New Relic are also strong, but they often come with steep costs at scale.
2. Why choose CubeAPM over open-source Kubernetes monitoring solutions?
CubeAPM provides the flexibility of open-source tools like Prometheus and Grafana but adds enterprise features such as smart sampling, AI-assisted anomaly detection, and optional self-hosting. This helps teams avoid the operational overhead of managing OSS stacks while gaining better cost control and compliance readiness.
3. How much does Kubernetes monitoring with CubeAPM cost compared to others?
CubeAPM uses a transparent pricing model starting at around $0.15/GB of data ingested, which makes it 60–80% cheaper than Datadog or New Relic for teams ingesting 10TB per month. In comparison, traditional vendors often charge separate fees for hosts, logs, synthetics, and users, leading to monthly bills of $5,000–$10,000+.
4. Is CubeAPM easy to deploy for Kubernetes environments?
CubeAPM is designed for quick setup with drop-in compatibility for Prometheus, Datadog, and New Relic agents, plus prebuilt dashboards for Kubernetes clusters. This means teams can get started without re-instrumenting their applications, making CubeAPM one of the easiest tools to deploy for K8s monitoring.
5. Does CubeAPM support large-scale, multi-cluster Kubernetes monitoring?
CubeAPM was built for scale, with smart sampling, retention controls, and self-hosted or SaaS deployment options. This allows enterprises to monitor thousands of pods across multiple clusters while keeping costs predictable and ensuring compliance with data residency requirements.


