Synthetic monitoring simulates user flows, such as logins, checkouts, and API calls, from multiple locations to detect performance issues before they affect customers. Infact 98% of organisations report that an hour of downtime costs over $100,000, with e-commerce and financial firms often incurring millions of dollars in losses.
CubeAPM addresses the biggest gaps in traditional synthetic tools—fragile scripts, per-check pricing, and siloed alerts—with resilient synthetic scripting, global test coverage, multi-step transaction monitoring, and real-browser testing. Teams can run checks from global or private locations and validate SLAs and SLOs in real-time.
In this article, we’ll cover the top 10 synthetic monitoring tools—their features, pricing, and best use cases—so you can choose the right fit for your team.
Top 8 Synthetic Monitoring Tools
- CubeAPM
- Datadog
- New Relic
- Dynatrace
- Checkly
- Grafana
- Pingdom
- Site24x7 (by Zoho)
What is a Synthetic Monitoring Tool?
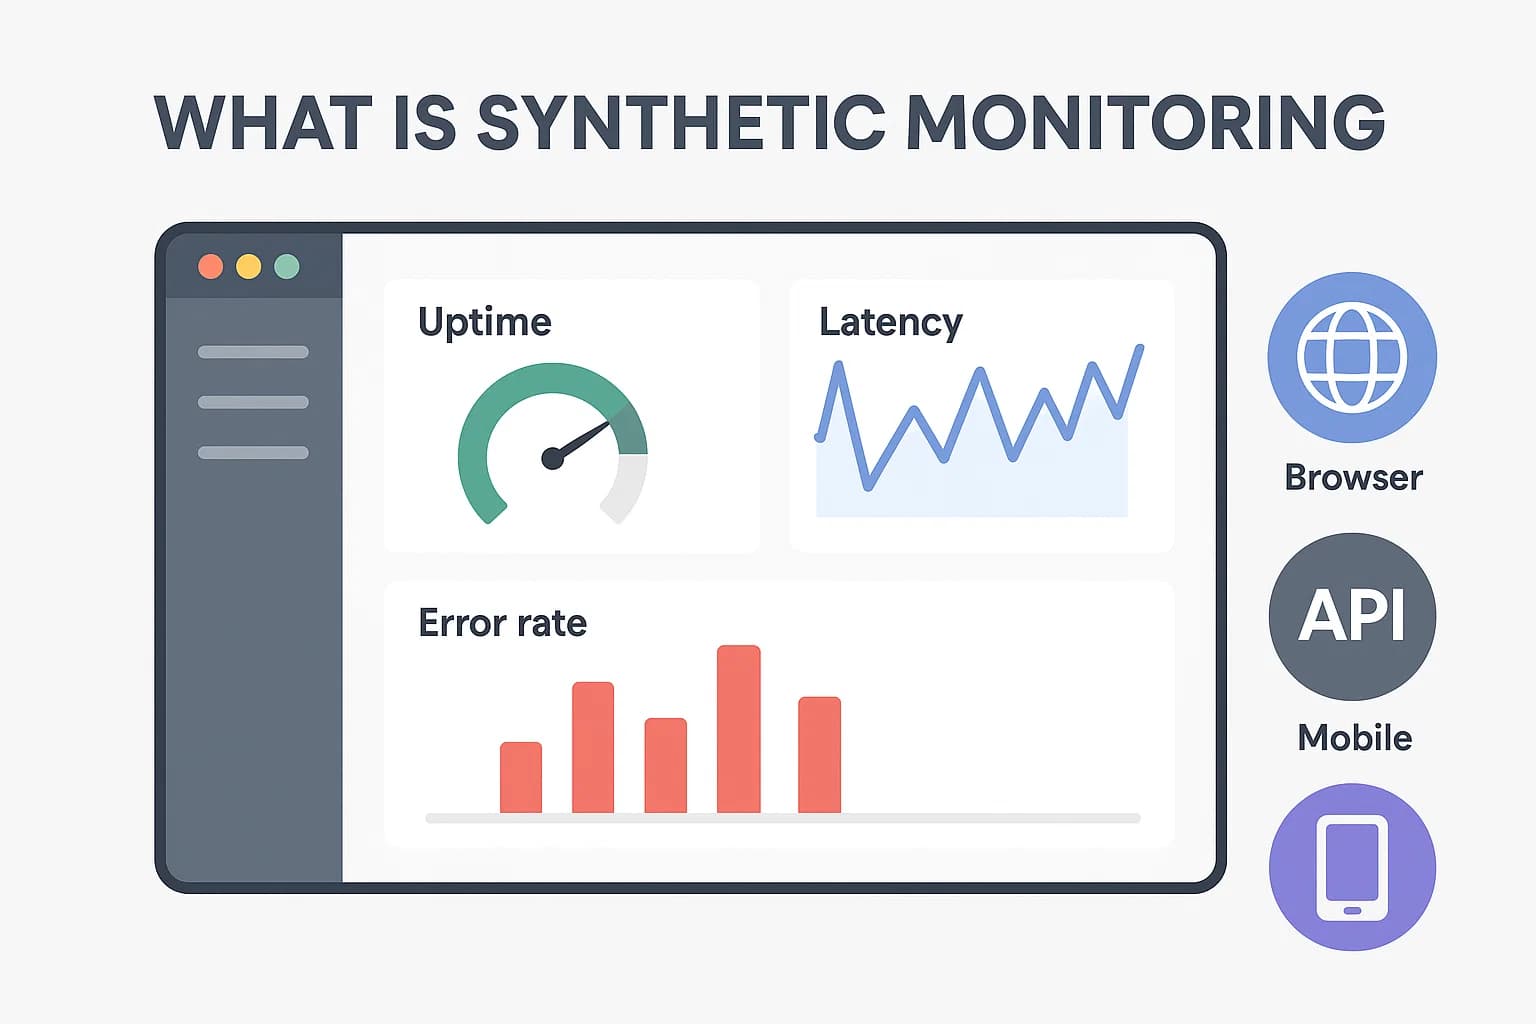
A synthetic monitoring tool actively simulates user interactions—like logging in, making an API call, or completing a checkout—to ensure applications and digital services perform reliably. Unlike passive monitoring, which waits for real user activity, synthetic monitoring runs automated tests from different geographies, devices, and browsers at defined intervals. This allows teams to proactively detect issues before they affect customers.
Synthetic monitoring tools typically include several core capabilities:
- Availability Monitoring: Continuously checks whether a website, API, or service is online by performing uptime, ping, and SSL certificate tests.
- Performance Monitoring: Uses real-browser scripts to measure load times, page responsiveness, and API latency across regions and devices.
- Transaction Monitoring: Validates multi-step workflows (like signup, login, or checkout) to ensure business-critical paths function correctly.
- API & Service Monitoring: Executes synthetic requests against APIs or microservices to confirm that endpoints return the correct responses.
- Alerting & Reporting: Sends real-time alerts when thresholds are breached, and provides detailed reports on SLA compliance and trends.
- CI/CD Integration: Many modern synthetic tools integrate with pipelines to catch regressions in staging before they reach production.
Key Features to Look for in a Synthetic Monitoring Tool
1. Global and Multi-Environment Coverage
Synthetic monitoring should run simulated user flows from multiple global nodes, browsers, and devices. This helps enterprises detect latency, CDN issues, or regional outages early, making it an essential part of enterprise monitoring strategies.
2. Full User Journey Simulation (Browser, API, Mobile)
Modern tools go beyond uptime checks to script complete user journeys like login, search, and checkout. They also simulate APIs and mobile apps, providing a full view of customer experiences that ties directly into broader observability tools.
3. CI/CD Integration & Automated Testing
The best platforms integrate into CI/CD pipelines, allowing teams to enforce performance budgets before deployment. This turns synthetic monitoring into a proactive quality gate rather than a reactive alert, a key capability for DevOps and observability-driven workflows.
4. SLA/SLO Tracking & Alerting
Strong SLA and SLO enforcement is critical for enterprises. Synthetic monitoring tools should provide real-time dashboards and automated alerts that validate uptime and latency targets, helping organizations maintain reliability commitments at scale.
5. Correlation with Logs, Metrics & Distributed Tracing
When synthetic checks fail, the tool should automatically correlate results with logs, metrics, and distributed tracing data. This integration accelerates root cause analysis and reduces downtime in complex distributed systems.
6. Resilient Scripting & Maintenance
User journeys change frequently, and fragile scripts often break. Tools with smart selectors, parameterization, and “synthetics as code” features help teams build stable tests that evolve with the application.
7. Pricing Transparency & Scalability
Per-check or per-step billing often leads to unpredictable costs. Predictable pricing models make it possible to scale synthetic monitoring to cover APIs, browsers, and mobile apps without overspending.
Example: How CubeAPM Handles Synthetic Monitoring
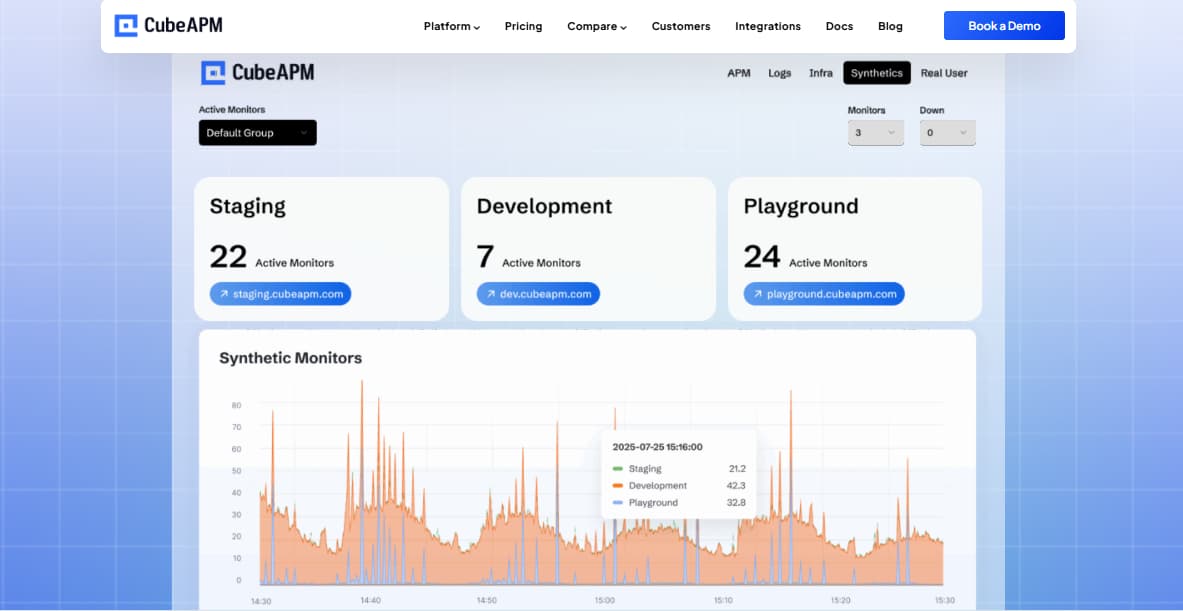
CubeAPM empowers teams to stay ahead of issues with proactive, scripted tests designed to mirror real user journeys. It allows you to simulate workflows such as signups, logins, and checkouts, enabling early detection of failures—even before real users encounter them.
Beyond just running checks, CubeAPM provides on-prem real user monitoring (RUM) that’s up to 4× faster than cloud-based alternatives, ensuring minimal latency in detecting performance bottlenecks.
Coupled with its intelligent error tracking capabilities—which include AI-based sampling and fully on-prem data processing—CubeAPM keeps telemetry internal, making it secure and cost-effective for enterprise environments. CubeAPM’s synthetic monitoring capabilities enable enterprises to:
- Prevent downtime with proactive, scripted tests simulating user journeys
- Accelerate detection with fast, on-prem real user monitoring (RUM)
- Cost-efficient operation through AI-based sampling and smart data filtering
- Ensure compliance and security by keeping all telemetry within your own infrastructure
Why Teams Choose Different Synthetic Monitoring Tools
1. Cost Pressure & Pricing Models
Per-run billing often drives costs up fast, especially for teams monitoring thousands of checks daily. When each browser test or API call is priced individually, costs can escalate during traffic spikes or seasonal surges. That’s why many enterprises now evaluate synthetic monitoring tools alongside their broader infrastructure monitoring strategy, looking for flat-rate or usage-based pricing models that remain predictable as workloads scale.
“That kind of monitoring on Datadog costs about $8,500 a month, with an annual contract.” (Reddit)
2. Complexity & Onboarding
Feature-rich tools can be intimidating, with steep learning curves and dashboards that take weeks to master, slowing down smaller teams. For organizations adopting observability tools broadly, synthetic monitoring must offer a balance: deep functionality like distributed tracing correlation, without overwhelming engineers during onboarding. Simpler setup and intuitive dashboards are often the deciding factor when teams compare platforms.
3. Alert Fatigue & Noise
Unreliable or excessive alerts erode trust in monitoring systems, making engineers hesitant to rely on them for critical incidents. If synthetic checks constantly fire false positives, SREs stop trusting the tool. Modern solutions now focus on smarter alert deduplication and tighter integration to reduce noise. The ability to tie failed synthetic checks to logs also helps teams validate whether an alert signals a true incident.
“Too many false/non-urgent alarms … you miss critical alerts.” (Reddit)
4. CI/CD Integration
Modern DevOps teams want monitoring that works like code—integrating into pipelines, gating releases, and catching regressions early. Synthetic monitoring in this context isn’t just about uptime checks, but also about validating performance budgets and dependencies as part of automated deployments.
6. Ecosystem Fit
Some teams stick with a vendor not because of features, but because they already use the wider ecosystem (APM, logs, infra monitoring). Switching costs can feel higher than the pain of staying, especially when observability stacks are deeply entrenched. This makes ecosystem compatibility a top factor: teams prefer synthetic monitoring that plugs smoothly into existing tools for enterprise monitoring rather than adding another siloed platform.
7. Flexibility & Test Coverage
Teams with diverse stacks—APIs, microservices, mobile apps—want flexible monitoring that supports custom scripting, private locations, and different test types.
“Cannot handle complex user journeys (OTP, document upload etc).” (Reddit)
Top 8 Synthetic Monitoring Tools
1. CubeAPM

Known for
An OpenTelemetry-native observability platform that unifies synthetics, RUM, logs, metrics, traces, and error tracking in a single stack, while offering unlimited synthetic monitoring at no extra cost.
Synthetic Monitoring Specific Features
- Unlimited synthetics included (no per-run fees)
- Multi-step transaction monitoring (login, checkout, payments)
- Real-browser testing across devices and regions
- Global and private test locations
- CI/CD pipeline integration for pre-deployment testing
- Error tracking for failed steps, JS errors, and API anomalies
Key Features
- Unified MELT observability (metrics, events, logs, traces).
- Smart sampling to reduce noise and storage overhead.
- Self-hosting and data localization for compliance-heavy industries.
- Compatibility with Datadog, New Relic, Prometheus, and OTEL agents for easy migration.
- Direct Slack/WhatsApp support with fast turnaround times.
Pros
- Predictable, flat pricing with no per-run fees.
- Full-stack coverage beyond synthetics.
- Strong compliance and localization options.
- Fast, human-first support model.
Cons
- Not suited for teams looking for off-prem solutions
- Strictly an observability platform and does not support cloud security management
Pricing
Flat Pricing of $0.15/GB
CubeAPM Synthetic Monitoring Pricing At Scale
*All pricing comparisons are calculated using standardized Small/Medium/Large team profiles defined in our internal benchmarking sheet, based on fixed log, metrics, trace, and retention assumptions. Actual pricing may vary by usage, region, and plan structure. Please confirm current pricing with each vendor.
For a mid-sized SaaS company ingesting 45TB(~45,000) total monthly data ingestion and 45,000TB of observability data outcharged by the cloud provider, the total cost will be about ~$7200/month.
Tech Fit
CubeAPM is best suited for organizations that want to integrate synthetic monitoring seamlessly into a broader observability stack. Its ability to correlate synthetic checks with logs, metrics, and distributed tracing makes it especially valuable for teams managing microservices or cloud-native architectures. With predictable pricing and enterprise-ready compliance options, it’s a strong fit for companies that need scalable synthetic monitoring as part of a wider enterprise monitoring strategy.
2. Datadog
Known for
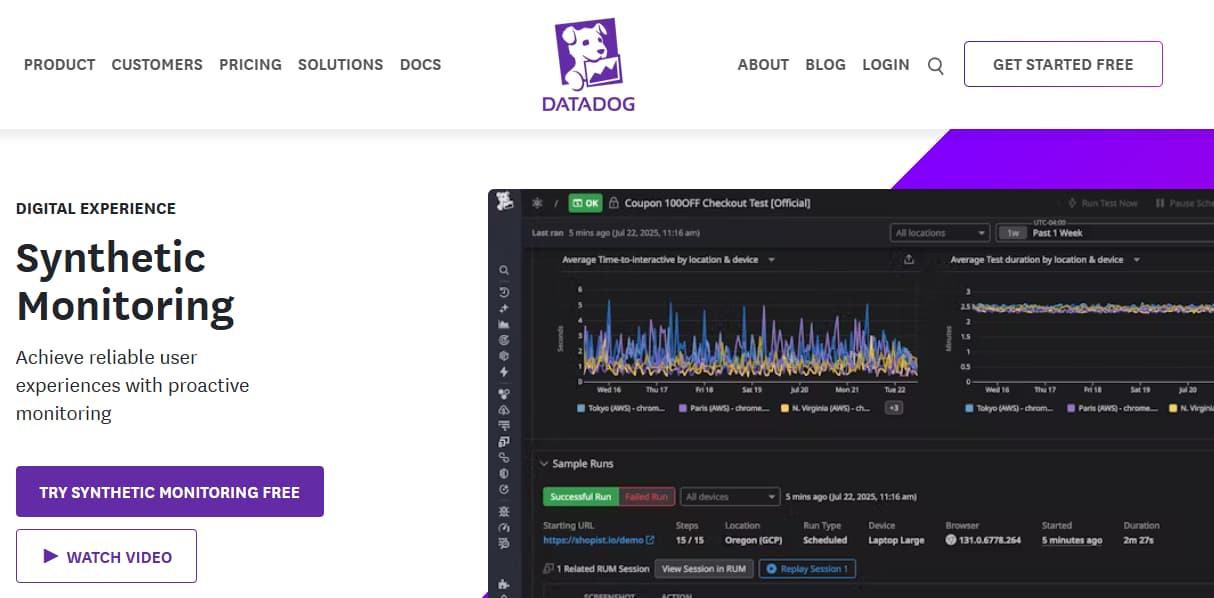
A leading observability platform that offers a wide range of monitoring products, including APM, logs, infrastructure monitoring, RUM, and synthetic monitoring with strong browser and API testing features.
Synthetic Monitoring Specific Features
- Multiple test types: API, multistep API, browser, and mobile tests
- Wide protocol support: HTTP, SSL, DNS, WebSocket, TCP, UDP, ICMP, gRPC
- Global and private test locations
- Rich test configuration: browser types, device emulation, variables, assertions, screenshots, and session replays
- CI/CD integration for deployment pipelines
- Granular performance metrics: DNS resolution, TCP connect, SSL handshake, first byte, download, Core Web Vitals (LCP, CLS)
Key Features
- Unified platform covering infrastructure, APM, logs, and synthetics.
- No-code browser test recorder for quick setup.
- Built-in dashboards, alerts, and integrations with 900+ services.
- Session replay and correlation with RUM for deeper visibility.
- AI-driven anomaly detection to reduce manual tuning.
Pros
- Rich feature set with deep integrations across observability.
- Easy-to-use browser test recorder for non-technical teams.
- Strong ecosystem and community adoption.
- Session replay ties user experience to test results.
Cons
- Pricing can become expensive at scale.
- Complex UI with a steep learning curve for new users.
- Users find the subscription cost high.
Pricing
- APM (Pro Plan): $35/host/month
- Infra (Pro Plan): $15/host/month
- Ingested Logs: $0.10 per ingested or scanned GB per month
Datadog Synthetic Monitoring Pricing At Scale
For a mid-sized SaaS company operating 125 APM hosts, 40 profiled hosts, 100 profiled container hosts, 500,000,000 indexed spans, 200 infra hosts, 1,500,000 container hours, 300,000 custom metrics, and ingesting around 10TB(~10,000 GB) of logs per month with 3500 indexed logs, the monthly cost would be around ~$27,475/month.
Tech Fit
Datadog is best for organizations that want synthetic monitoring tightly integrated with their observability stack. It correlates synthetic checks with logs, metrics, and distributed tracing, giving teams end-to-end visibility across APIs, browsers, and mobile apps.
3. New Relic
Known for
A developer-friendly observability platform with a usage-based pricing model, offering APM, logs, infrastructure, RUM, and synthetic monitoring bundled into its core plans.
Synthetic Monitoring Features
- Synthetics bundled into subscription plans (10k/1M/10M checks depending on tier).
- Browser and API monitors with scripting support.
- CI/CD integration for pre-deployment checks.
- Global test locations for simulating user experience.
- Step Monitors (no-code browser scripting)
- Ping, broken link, and SSL certificate monitors
- Global and private monitoring locations
Key Features
- Unified telemetry for logs, metrics, traces, and synthetics.
- Generous included quotas for synthetic checks depending on plan.
- Advanced dashboards and query language (NRQL) for flexible analytics.
- Native OpenTelemetry support for easier instrumentation.
- Wide integration ecosystem with cloud providers and CI/CD pipelines.
Pros
- Transparent usage-based pricing.
- Generous synthetic quotas included by default.
- Strong developer experience with NRQL and dashboards.
- Good OpenTelemetry alignment for modern teams.
Cons
- Costs can spike with high data volumes.
- Steep learning curve for new users
- Requires deep expertise to execute advanced queries.
Pricing
- Free Tier: 100GB/month ingested
- Pro plan: $0.40/GB ingested beyond the free 100GB limit
- Pro Plan: $349/user for full platform user
New Relic Synthetic Monitoring Pricing At Scale
A mid-sized SaaS company ingesting 45TB (~45,000 GB) of telemetry data per month and with 10 full users, the cost would come around ~$25,990/month.
Tech Fit
New Relic is a strong fit for engineering teams that need synthetic monitoring alongside distributed tracing and APM in a unified dashboard. Its flexible test creation and browser-based simulations work well for SaaS providers validating onboarding or multi-step user flows. While pricing and data retention may pose challenges for cost-sensitive teams, New Relic remains a good choice for enterprises focused on full-stack observability tools with integrated synthetics.
4. Dynatrace
Known for
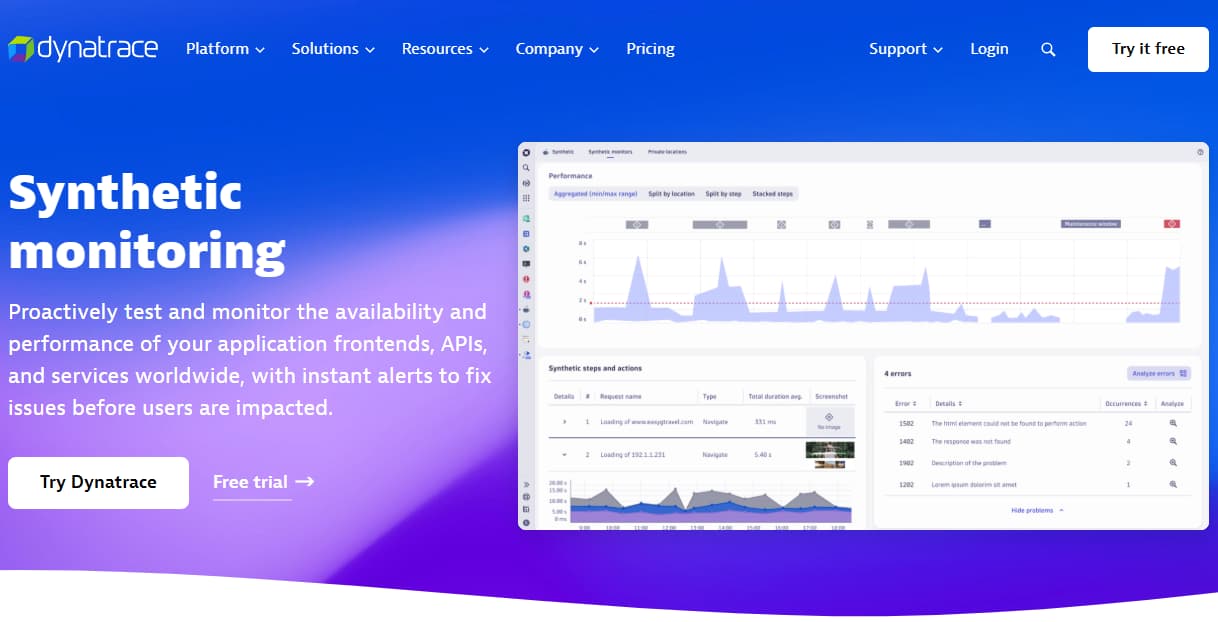
An AI-powered observability platform best known for its automatic discovery, topology mapping, and Davis AI engine, combining APM, infrastructure, security, and synthetic monitoring into one enterprise-focused solution.
Synthetic Monitoring Features
- Browser and API monitors with multi-step test scripting.
- Private synthetic locations for monitoring internal apps.
- Global public test locations to simulate user experience.
- CI/CD integration for deployment testing.
- Flexible scheduling with test frequency down to every minute.
Key Features
- Full-stack monitoring with auto-discovery of applications and dependencies.
- Davis AI for anomaly detection and root cause analysis.
- Strong Kubernetes and multi-cloud monitoring capabilities.
- Real user monitoring (RUM) and synthetics under one license.
- Advanced analytics and business-impact dashboards.
Pros
- Powerful automation with Davis AI reduces manual effort.
- Strong coverage across cloud-native and enterprise stacks.
- Unified monitoring across RUM + synthetics.
- Flexible deployment options for global teams.
Cons
- The pricing model is often criticized for its complexity.
- Higher cost as usage grows.
- Steep learning curve for smaller teams.
Pricing
- Infrastructure Monitoring: $29/mo/host
- Full-Stack Monitoring: $58/mo/8 GiB host
Dynatrace Synthetic Monitoring Pricing At Scale
A midsized SaaS company operating 125 APM hosts, 200 infra hosts, 10TB(~10,000 GB) of ingested logs, 300,000 custom metrics, 1,500,000 container hours, and 45,000GB of observability data out(charged by cloud provider), the cost would come around ~$21,850/month.
Tech Fit
Dynatrace is best suited for large enterprises with complex microservices and strict SLA requirements. Its AI-powered anomaly detection and deep synthetic monitoring tie in directly with distributed tracing and real-time dependency maps. For organizations managing multi-cloud deployments or hybrid infrastructure monitoring, Dynatrace provides reliable coverage, though its licensing model makes it less attractive for smaller teams.
5. Checkly
Known for
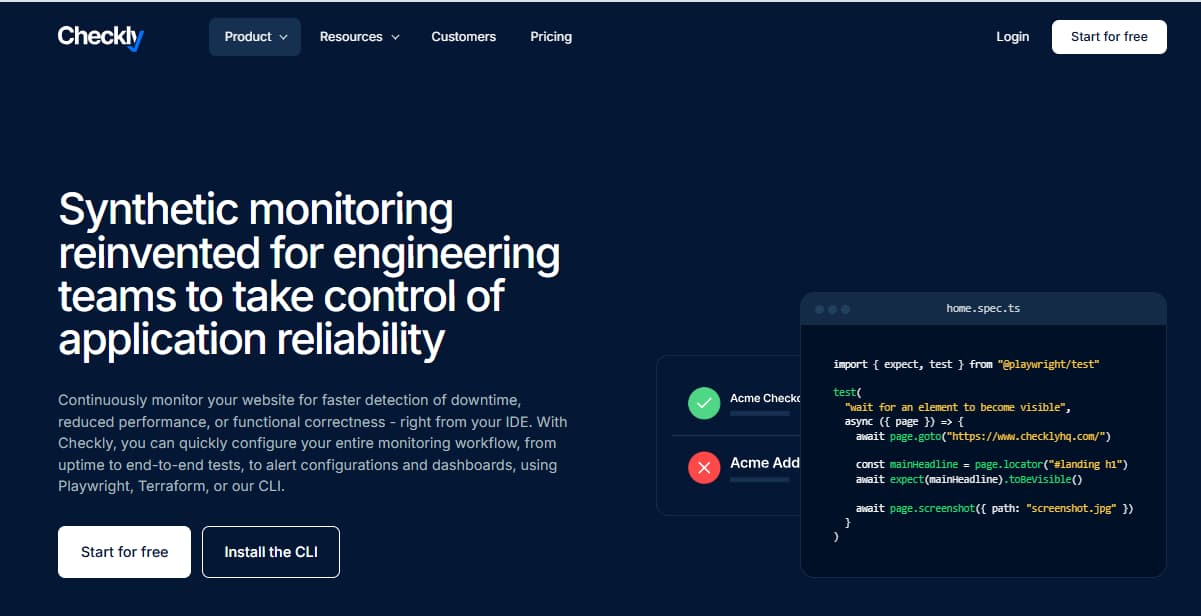
A developer-centric synthetic monitoring platform built around Playwright and JavaScript, designed for monitoring-as-code and seamless CI/CD integration.
Synthetic Monitoring Features
- Multi-step browser checks with Playwright.
- Private locations to run checks inside corporate networks.
- CI/CD integrations (GitHub Actions, GitLab, Jenkins).
- Multi-step transaction monitoring
- Private synthetic locations for internal apps
- SLA and SLO validation
- Davis AI anomaly detection on synthetic results
Key Features
- Monitoring-as-Code approach with Git-based workflows.
- Playwright-powered browser testing for advanced scripting.
- REST, GraphQL, and gRPC API testing.
- Real-time dashboards and alert integrations (Slack, PagerDuty, Opsgenie).
- Team collaboration with audit logs and role-based access control.
Pros
- Strong developer focus with scripting flexibility.
- Easy integration into DevOps pipelines.
- Transparent pricing and simple scaling.
- Private location support for internal apps.
Cons
- Less suited for non-technical teams (requires scripting knowledge).
- Smaller ecosystem compared to Datadog or Dynatrace.
- Limited beyond synthetics (no full-stack observability).
Pricing
- Hobby ($0/month): 1 User, 10 Uptime Monitors, Synthetic Monitoring: 1,000 Browser Checks, 10,000 API Checks, Max Frequency: 2 min
- Starter ($24/month): 3 Users, 20 Uptime Monitors, Synthetic Monitoring: 3,000 Browser Checks, 25,000 API Checks
- Team ($64/month) (Most Popular): 10 Users, 50 Uptime Monitors, Synthetic Monitoring: 12,000 Browser Checks, 100,000 API Checks
Checkly Synthetic Monitoring Pricing At Scale
For a mid-sized company running around 1M API checks and 120k browser checks per month, Checkly’s Team plan ($64/month) includes 100k API and 12k browser checks, with overages billed at $1.80 per 10k API checks and $18 per 1k browser checks. Once scaled to enterprise-level volumes, this works out to roughly ~$2,000/month, showing how Checkly’s costs grow linearly with synthetic run usage.
Tech Fit
Checkly is tailored for developers and DevOps teams that want synthetics tightly integrated with CI/CD. It supports JavaScript-based scripting for highly customizable checks, making it popular with teams monitoring APIs and modern web apps. With its “monitoring as code” approach, Checkly is a great fit for agile teams that value automation, distributed tracing alignment, and rapid iteration.
6. Grafana
Known for
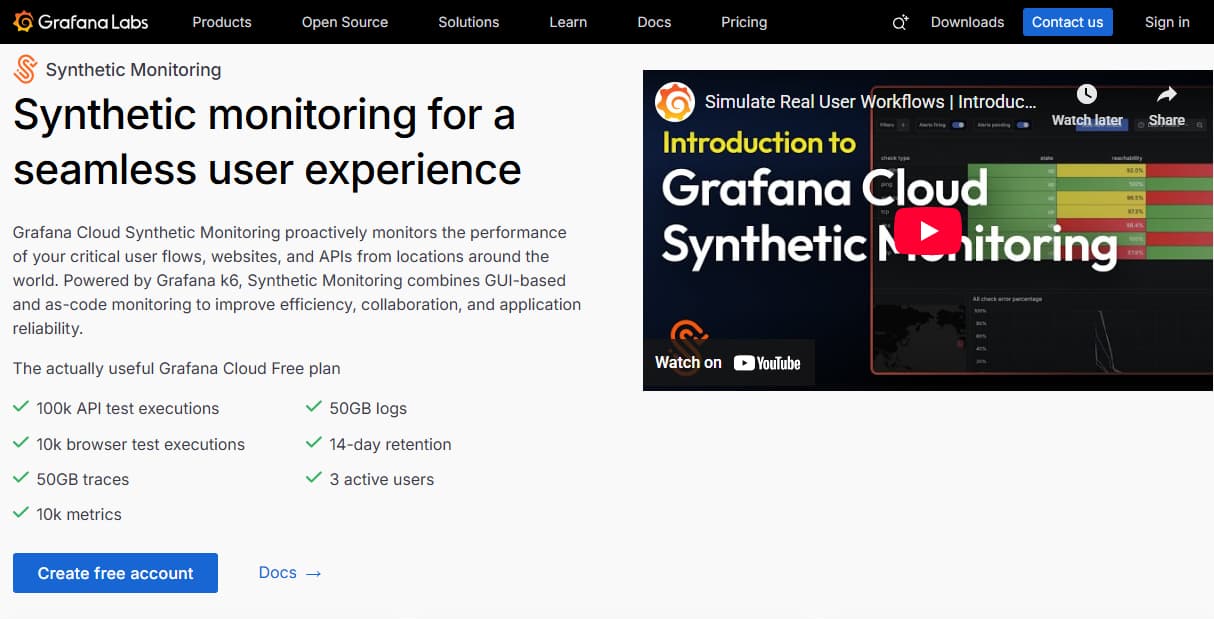
Part of the Grafana Cloud stack, powered by k6, designed for developer-friendly load testing and synthetic checks with a focus on monitoring-as-code.
Synthetic Monitoring Features
- Scripted checks with k6, using JavaScript for flexible scenarios.
- API and browser monitoring tied directly into Grafana Cloud dashboards.
- Multi-location checks across global points of presence.
- CI/CD ready, enabling performance tests as part of deployments.
- Execution-based pricing that scales with check volume.
Key Features
- Native integration with Grafana dashboards and alerting.
- k6-based scripting for browser and API checks.
- MultiHTTP, gRPC, and GraphQL test support.
- CI/CD pipeline integration via CLI and GitHub Actions.
- Scalable cloud execution with private location options.
Pros
- Developer-first with strong scripting and code reusability.
- Seamless integration with Grafana dashboards and alerting.
- Transparent execution-based pricing.
- Good fit for both performance testing and monitoring.
Cons
- Requires scripting knowledge (not no-code friendly).
- Costs grow quickly with high-frequency tests.
- Limited standalone features outside Grafana ecosystem.
Pricing
- Grafana OSS: Free
- Pro plan: $19/month
- Metrics: $6.50/ 1k series
- Logs: $0.50/GB ingested
- Traces: $0.50/GB ingested
Grafana Synthetic Monitoring Pricing At Scale
For a mid-sized company operating 125 APM hosts, 200 infra hosts, 10TB(~10,000 GB) of ingested logs, and 45,000GB of observability data out(charged by cloud provider), the cost would come around ~$11,875/month.
Tech Fit
Grafana is a strong fit for teams already invested in the Grafana ecosystem for dashboards, metrics, and alerts. Its synthetic monitoring is built on the k6 load testing engine, making it especially attractive for developers who want to combine performance testing with real-time observability. While it requires more configuration than plug-and-play tools, Grafana works best for engineering teams comfortable with open-source stacks and those who want to align synthetic monitoring with distributed tracing and infrastructure monitoring through Grafana Tempo and Loki.
7. Pingdom (by SolarWinds)
Known for
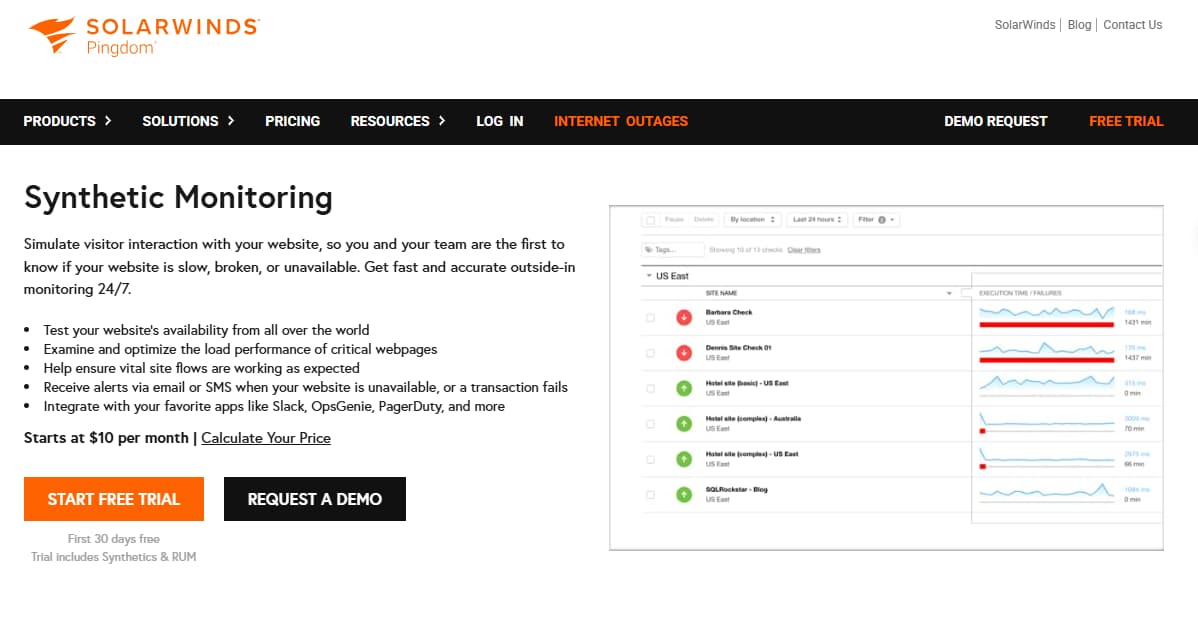
A website performance and uptime monitoring tool that SMBs widely use for simple synthetic checks and availability tracking.
Synthetic Monitoring Features
- Transaction monitoring to simulate user journeys.
- Page speed analysis from multiple regions.
- API monitoring for endpoints.
- Global locations for availability checks.
- Alert escalation and smart notifications.
Key Features
- Website uptime and performance monitoring.
- Page speed and load-time analysis.
- Transaction monitoring for logins, checkout, and forms.
- Real-time alerts via email, SMS, and integrations.
- Public status pages for transparency with users.
Pros
- Easy to set up and beginner-friendly.
- Affordable entry-level pricing.
- Public status pages built in.
- Strong brand recognition.
Cons
- Limited for complex or enterprise-scale monitoring.
- No full-stack observability.
- Pricing can rise with multiple checks.
Pricing
Synthetic Monitoring: starts at $10/month
- Includes 10 uptime checks, 1 advanced check, and 50 SMS alerts.
- Covers transaction monitoring, page speed, and uptime monitoring.
Pingdom Synthetic Monitoring Pricing At Scale
For a mid-sized company consuming around 50 million page views monthly and running 500 uptime checks with 50 advanced transaction monitors, Pingdom’s costs scale to approximately $7,000 per month. While its base pricing starts at just $10/month each for synthetic monitoring and real user monitoring (totaling $240/year at entry level), the jump in usage-based pricing shows how quickly expenses can rise once organizations move beyond the basic tier.
Tech Fit
Pingdom is best for organizations that prioritize simple uptime monitoring with easy-to-read reports. It’s widely used by SMBs and e-commerce companies that need to monitor global website availability and page speed without a complex setup. Its simplicity makes it ideal for lightweight infrastructure monitoring.
8. Site24x7 (by ManageEngine)
Known for
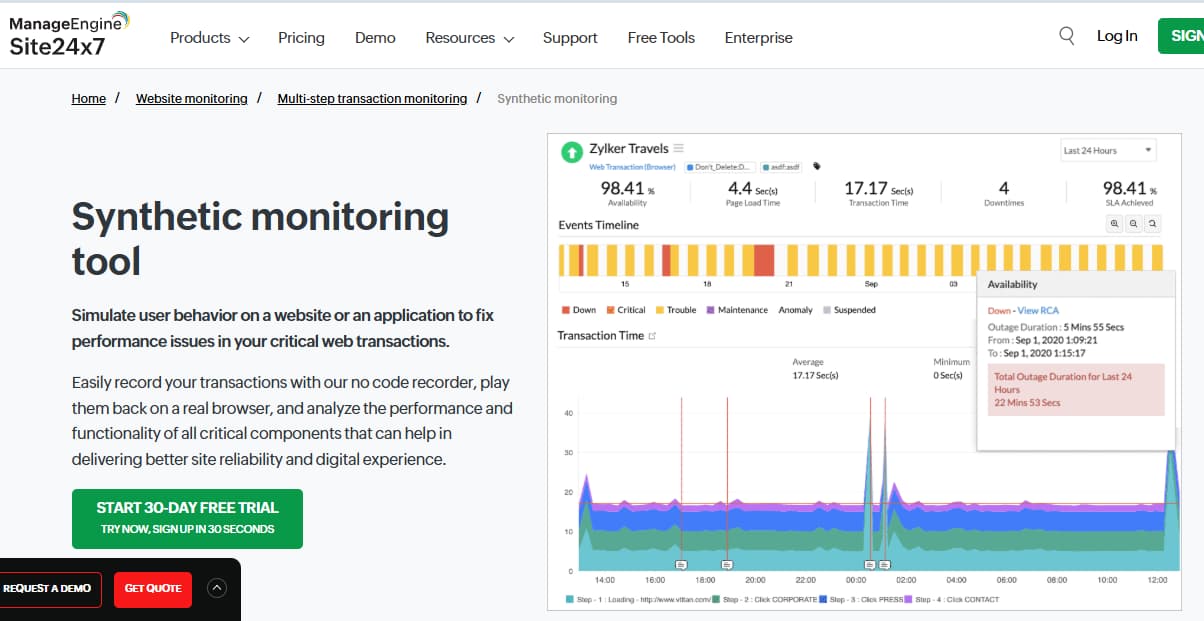
Site24x7 is a cloud-based monitoring suite that bundles uptime, synthetics, infrastructure, and application performance monitoring into a single SaaS platform.
Synthetic Monitoring Features
- Synthetic web transactions for login, search, and checkout paths.
- Global monitoring locations across major regions.
- Private monitoring within corporate networks.
- Multi-step scripts for advanced journeys.
- Detailed reporting on uptime SLA compliance.
Key Features
- Website uptime monitoring with 120+ global locations.
- Synthetic transaction monitoring for critical user flows.
- Server, cloud, and VM monitoring included.
- Log management and infrastructure visibility.
- Alerting with integrations into Slack, PagerDuty, and Microsoft Teams.
Pros
- Broad feature set beyond synthetics.
- Competitive pricing compared to enterprise tools.
- Flexible deployment across hybrid IT environments.
- Wide choice of monitoring locations.
Cons
- Interface less polished than leading incumbents.
- Can feel overwhelming for small teams.
- Retention periods are shorter on lower tiers.
Site24x7 Synthetic Monitoring Pricing At Scale
For a mid-sized company running one main website, approximately 50 servers, and handling 5 million monthly page views, Site24x7’s costs scale quickly. The Enterprise plan starts at $625/month. Adding 45 extra servers beyond the 5 included ($15 each = $675/month), scaling log analytics to 10TB/month instead of the included 4GB ($0.25/GB = $/month), and increasing RUM to 5M pageviews (50× the 100K included = $500/month) already pushes the spend higher. Adding synthetic transaction checks and APM across multiple apps adds another $800/month. Altogether, this amounts to a monthly spend of around $3,800–$4,000.
Tech Fit
Site24x7 is a versatile option for enterprises that need all-in-one monitoring, combining synthetic monitoring, infrastructure monitoring, and application performance insights. It’s well-suited for organizations with hybrid or multi-cloud environments that require a comprehensive observability toolkit in a single platform. Its strength lies in the breadth of its ecosystem rather than the depth of its specialized, distributed tracing.
Conclusion
Choosing the right synthetic monitoring tool depends on whether your priority is simple uptime checks, full user journey simulation, or flexible self-hosting. Many tools excel in one category but struggle with hidden costs, noisy alerts, or limited integrations at scale.
CubeAPM stands out by combining synthetic monitoring, RUM, logs, metrics, and traces into one OpenTelemetry-native platform. With unlimited synthetics, flat $0.15/GB pricing, and self-hosting options, it delivers enterprise-grade monitoring without the runaway bills.
If your team needs proactive visibility across availability, performance, and functionality—while keeping costs predictable—CubeAPM ticks all the boxes.
Disclaimer: The information in this article reflects the latest details available at the time of publication and may change as technologies and products evolve.
FAQs
1. What is synthetic monitoring?
Synthetic monitoring is a proactive testing method where scripts simulate user actions like logins, searches, or payments. Unlike uptime checks, it provides visibility into availability, performance, and functionality before real users are impacted.
2. How is synthetic monitoring different from real user monitoring (RUM)?
Synthetic monitoring is active—it runs automated tests on a schedule—while RUM is passive, relying on real user sessions. Synthetic monitoring helps detect issues before users are affected, whereas RUM shows actual user experiences in real time. The two are often used together for full coverage.
3. Why do teams use synthetic monitoring tools?
- Validate SLAs and uptime guarantees.
- Ensure smooth CI/CD deployments by catching regressions early.
- Meet compliance and audit requirements.
- Reduce false alerts and identify root causes faster.
4. What are the best synthetic monitoring tools in 2025?
Top tools include CubeAPM, Datadog, and Grafana Cloud. CubeAPM stands out with unlimited synthetics, OpenTelemetry support, and flat $0.15/GB pricing, making it cost-effective at scale.
5. How much does synthetic monitoring cost?
Costs vary widely. SaaS providers like Datadog or New Relic often charge per host, per request, or per GB ingested—leading to bills in the thousands per month for midsized companies. CubeAPM simplifies this with transparent $0.15/GB pricing and unlimited synthetics included, saving teams up to 70–80% in monitoring costs.


