










Kubernetes makes microservices easier to deploy and scale, but it also turns every user request into a maze of pod-to-pod calls, service meshes, and sidecar proxies. When latency spikes or errors cascade, logs and metrics alone cannot tell you which service in the call chain caused the problem. According to the CNCF Annual Survey 2023, 71% of organizations use distributed tracing in production to debug these issues. This guide compares 10 distributed tracing tools built for Kubernetes environments, evaluated on cost model, OpenTelemetry compatibility, and how deeply they understand Kubernetes-specific signals like HPA scaling events, pod evictions, and control plane health.
Quick comparison: 10 distributed tracing tools for Kubernetes
| Tool | Best For | Pricing | OTel Native? | Kubernetes-Specific Features |
|---|---|---|---|---|
| CubeAPM | Unified traces + logs + metrics on-prem | $0.2/GB all-in | ✓ Native | Pod-level visibility, service mesh integration, cross-service trace correlation |
| Jaeger | Open source tracing backend | Free (self-hosted) | ✓ Native | Kubernetes Operator, Helm chart, sidecar injection |
| Grafana Tempo | Trace-only backend for Grafana stack | Free (OSS) / Cloud usage-based | ✓ Native | Native Kubernetes storage backend, integrates with Loki logs |
| SigNoz | Open source full-stack observability | Free (OSS) / Cloud from $49/mo | ✓ Native | Kubernetes metrics dashboard, pod logs correlation |
| Datadog APM | Enterprise multi-cloud monitoring | $31/host/mo + ingest fees | Partial | Kubernetes tagging, cluster maps, pod resource correlation |
| New Relic | Full-stack APM platform | $0.40/GB beyond 100 GB free | Strong | Kubernetes cluster explorer, pod deployment tracking |
| Honeycomb | High-cardinality event analysis | Free tier / Pro from $130/mo | ✓ Native | BubbleUp for trace anomalies, Kubernetes attribute support |
| Dynatrace | AI-automated enterprise monitoring | $0.20/GiB logs + host fees | Strong | Davis AI for Kubernetes anomalies, full-stack entity model |
| Elastic APM | Trace backend for ELK stack | Free (OSS) / Cloud from $99/mo | Partial | Kubernetes metadata enrichment, APM data in Elasticsearch |
| Zipkin | Lightweight open source tracer | Free (self-hosted) | ✓ Native | Kubernetes service discovery, simple span collection |
Pricing estimates based on early 2026 public rate cards. Actual costs vary by data volume, retention, host count, and add-ons.
1. CubeAPM
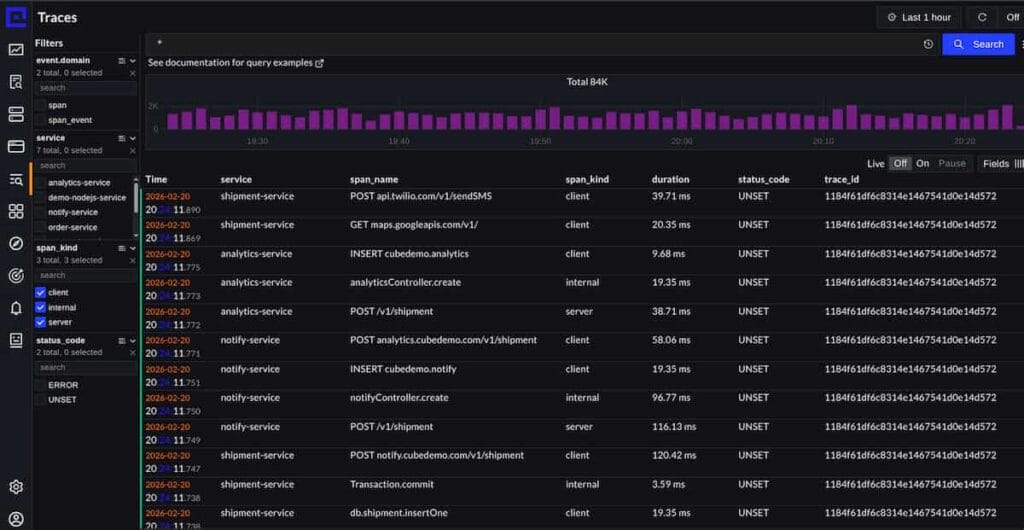
Website: cubeapm.com License: Commercial (self-hosted or vendor-managed) Deployment: Self-hosted inside your VPC or on-prem
CubeAPM is a unified observability platform that combines distributed tracing, logs, and infrastructure metrics in a single system. It runs inside your own cloud or data center, so trace data never leaves your infrastructure. Many enterprises use CubeAPM as their observability backbone, including engineering teams at Delhivery, Mamaearth, and redBus.
Key Features:
- Native OpenTelemetry ingestion via OTLP for all trace data
- Kubernetes-specific dashboards showing pod, node, and cluster-level traces
- Service mesh integration with Istio and Linkerd for automatic trace context propagation
- Trace-to-log correlation with one-click pivot from a slow span to related pod logs
- AI-powered anomaly detection across traces, logs, and metrics in one view
- Unlimited retention with flat $0.15/GB pricing and no per-host or per-user fees
Pricing: $0.20/GB ingested (traces, logs, metrics combined). No separate trace storage fee, no seat licenses. For a 50-node Kubernetes cluster ingesting 30 TB/month, estimated cost is $4,500/month all-in.
This estimate models a production Kubernetes cluster with moderate trace volume. Actual costs depend on ingestion rate, retention period, and feature usage.
Pros:
- Dramatically lower cost than SaaS tools – approximately 140x lower storage costs in typical workloads compared to Elasticsearch-based stacks
- Full data control with on-prem deployment keeps trace data compliant and private
- Unified platform eliminates need to run separate Jaeger, Prometheus, and Grafana deployments
- Rich Kubernetes context in every trace span includes pod name, namespace, node, deployment version
Cons:
- Requires infrastructure provisioning in your own cloud or data center
- Third-party integrations still growing compared to Datadog or New Relic
Best for: Teams running Kubernetes at scale who need unified observability with full data control and predictable costs.
2. Jaeger
Website: jaegertracing.io License: Apache 2.0 (open source) Deployment: Self-hosted
Jaeger is the industry-standard open source distributed tracing backend, originally developed by Uber and now a CNCF graduated project. It is widely adopted for Kubernetes tracing because of its mature ecosystem, stable release cadence, and first-class Kubernetes support through the Jaeger Operator.
Key Features:
- OpenTelemetry native with full OTLP support
- Kubernetes Operator for automated deployment, upgrades, and autoscaling
- Supports multiple storage backends including Cassandra, Elasticsearch, and Kafka
- Service dependency graphs and root cause analysis UI
- Adaptive sampling to reduce trace volume while retaining important traces
Pricing: Free (self-hosted). Infrastructure costs vary by storage backend and scale. A 50-node cluster with Cassandra storage costs approximately $800-1,200/month in cloud infrastructure.
Pros:
- Mature and widely adopted with strong community support
- Native Kubernetes deployment via Operator simplifies management
- Vendor-neutral and fully open source with no licensing costs
- Works with any OpenTelemetry instrumented application out of the box
Cons:
- Requires significant operational overhead to run and scale
- No built-in log or metric correlation — you must integrate with separate tools
- Query performance degrades at high trace volumes without careful tuning
Best for: Teams already on Kubernetes who want a proven open source tracing backend and have the engineering capacity to operate it.
3. Grafana Tempo
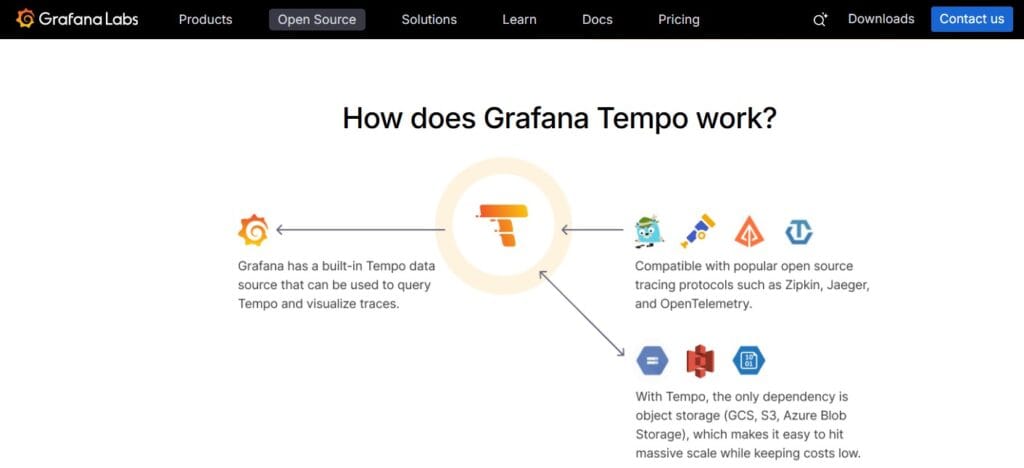
Website: grafana.com/oss/tempo License: AGPL-3.0 (open source) Deployment: Self-hosted or Grafana Cloud
Grafana Tempo is an open source trace storage backend designed to integrate deeply with the Grafana observability stack. It stores traces in object storage like S3 or GCS, making it cost efficient at scale compared to index-heavy backends.
Key Features:
- OpenTelemetry native with OTLP ingestion
- TraceQL query language for filtering and aggregating traces
- Native integration with Grafana for trace visualization and correlation
- Works with Loki for trace-to-log correlation and Prometheus for metrics
- Scales horizontally with no upfront indexing required
Pricing: Free (self-hosted). Grafana Cloud pricing starts at $0.50/GB for traces with 14-day retention. A 50-node cluster ingesting 10 TB/month of traces costs approximately $5,000/month on Grafana Cloud.
Pricing based on Grafana Cloud public rate card as of early 2026. Verify current rates at grafana.com/pricing.
Pros:
- Cost efficient trace storage with object storage backend
- Deep Grafana integration makes trace-log-metric correlation seamless
- No separate indexing step reduces operational complexity
- Strong Kubernetes support with exemplars linking metrics to traces
Cons:
- Query performance slower than indexed backends like Jaeger for high-cardinality queries
- Requires Grafana for visualization — not a standalone UI
- Limited community support compared to Jaeger
Best for: Teams already using Grafana, Loki, and Prometheus who want to add distributed tracing to their existing stack.
4. SigNoz
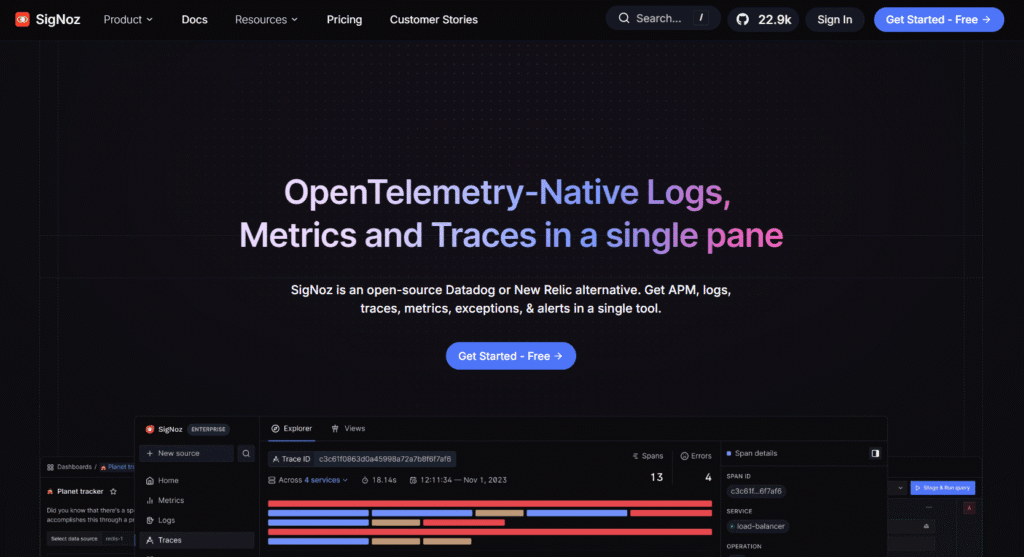
Website: signoz.io License: MIT (open source) Deployment: Self-hosted or SigNoz Cloud
SigNoz is an open source full-stack observability platform that combines APM, distributed tracing, logs, and metrics in one system. It is built on ClickHouse for fast query performance and offers both self-hosted and managed cloud options.
Key Features:
- OpenTelemetry native with OTLP ingestion for traces, logs, and metrics
- Unified dashboards showing traces, logs, and Kubernetes metrics together
- Service maps and dependency graphs for microservices running on Kubernetes
- Fast query performance with ClickHouse columnar storage
- Alerts on trace latency, error rate, and throughput
Pricing: Free (self-hosted). SigNoz Cloud starts at $49/month for 1 GB ingested with additional usage at $0.30/GB. A 50-node cluster ingesting 30 TB/month costs approximately $9,000/month on SigNoz Cloud.
Pricing based on SigNoz Cloud public rate card as of early 2026. Verify current rates at signoz.io/pricing.
Pros:
- Unified observability eliminates need for separate tracing, logging, and metrics tools
- Fast query performance on high-cardinality trace data
- Lower cost than commercial SaaS tools at scale
- Active development and responsive community support
Cons:
- Smaller ecosystem and fewer integrations than established tools
- Self-hosted deployment requires ClickHouse operational expertise
- Limited enterprise features like SSO and RBAC in open source version
Best for: Teams building cloud native applications who want a unified open source observability platform with strong Kubernetes support.
5. Datadog APM
Website: datadoghq.com/product/apm License: Commercial (SaaS only) Deployment: SaaS only
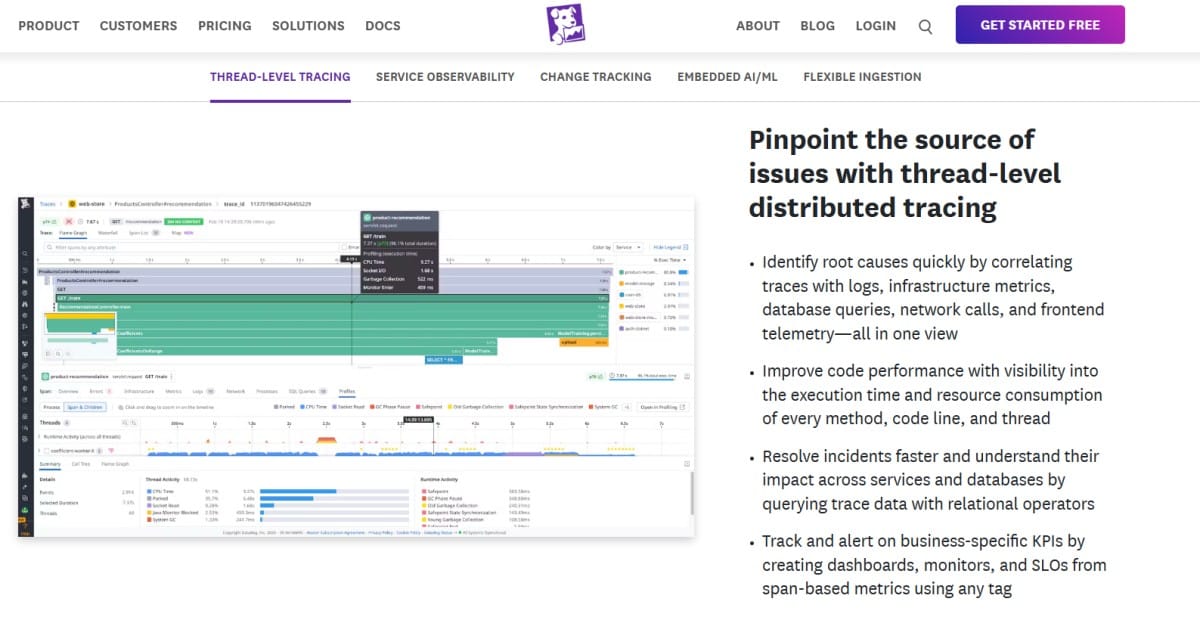
Datadog APM is part of the Datadog unified monitoring platform, offering distributed tracing alongside infrastructure monitoring, logs, and security. It is widely used in enterprise environments for its breadth of integrations and managed service model.
Key Features:
- Automatic trace instrumentation for popular languages and frameworks
- Kubernetes cluster maps showing service dependencies across pods and nodes
- Trace-to-log correlation with automatic context propagation
- Watchdog AI detects anomalies in trace latency and error rates
- Over 700 integrations with cloud providers, databases, and third-party services
Pricing: $31/host/month for APM Pro plus $0.10/GB ingestion for Indexed Spans beyond 1 million spans/host/month. A 50-node cluster ingesting 10 TB/month of traces costs approximately $9,500/month before logs or metrics. See Datadog pricing for current rates.
This estimate models APM Pro for infrastructure monitoring plus trace ingestion. Logs, metrics, and additional features cost extra.
Pros:
- Comprehensive feature set covering APM, logs, infrastructure, RUM, and security in one platform
- Managed service eliminates operational overhead
- Strong Kubernetes support with automatic pod tagging and service discovery
- Mature ecosystem with extensive integrations
Cons:
- Costs scale aggressively with data volume and host count
- Per-host pricing creates unpredictable bills during autoscaling events
- SaaS-only deployment rules it out for teams with data residency requirements
- Proprietary query language creates vendor lock-in
Best for: Large enterprises that prioritize breadth and managed service over cost predictability.
6. New Relic
Website: newrelic.com/platform/distributed-tracing License: Commercial (SaaS only) Deployment: SaaS only
New Relic is a full-stack observability platform that includes distributed tracing as part of its unified telemetry data model. It offers automatic instrumentation, anomaly detection, and business metrics alongside APM traces.
Key Features:
- Automatic trace instrumentation with language agents
- Kubernetes cluster explorer showing pod-level traces and resource usage
- Trace-to-log correlation with automatic context linking
- NRQL query language for custom trace analysis and dashboards
- Business metrics tied to trace performance for revenue impact analysis
Pricing: $0.40/GB ingested beyond 100 GB free tier. A 50-node cluster ingesting 30 TB/month costs approximately $12,000/month for traces alone. See New Relic pricing for current rates.
Pricing based on New Relic public rate card as of early 2026. Actual costs vary by user count, data retention, and add-on features.
Pros:
- Unified platform for APM, logs, infrastructure, and business metrics
- Kubernetes cluster explorer provides deep visibility into pod performance
- Strong automatic instrumentation reduces setup time
- Active development with frequent feature releases
Cons:
- Per-GB pricing becomes expensive at scale compared to self-hosted tools
- NRQL query language creates lock-in and makes migration difficult
- SaaS-only deployment rules it out for data-sovereign teams
- User-based licensing can add significant cost for larger teams
Best for: Teams that want a managed full-stack platform and are willing to pay for convenience.
7. Honeycomb
Website: honeycomb.io License: Commercial (SaaS only) Deployment: SaaS only
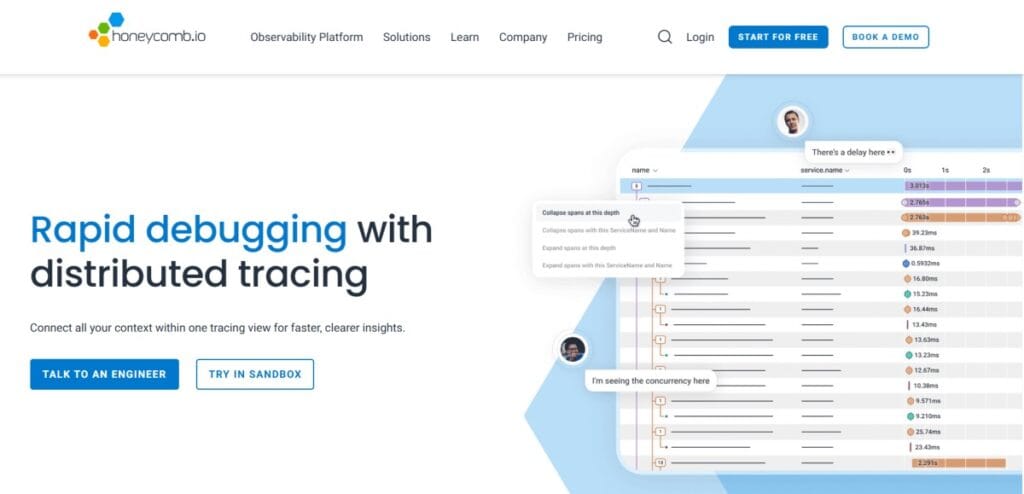
Honeycomb is a high-cardinality observability platform focused on event-driven debugging and distributed tracing. It excels at analyzing complex trace patterns in microservices architectures running on Kubernetes.
Key Features:
- OpenTelemetry native with OTLP ingestion
- BubbleUp automatically surfaces anomalies in high-cardinality trace attributes
- Kubernetes pod, namespace, and deployment attributes indexed for fast queries
- Trace waterfall views with microsecond precision
- Query language designed for exploring unknown unknowns in trace data
Pricing: Free tier for up to 20 million events/month. Pro plan starts at $130/month for 100 million events. A 50-node cluster generating 10 billion trace events/month costs approximately $1,300/month. See Honeycomb pricing for current rates.
Pricing based on event count rather than data volume. Trace spans with high cardinality increase costs.
Pros:
- Excels at high-cardinality trace analysis for complex debugging scenarios
- BubbleUp saves hours in root cause analysis by surfacing anomalous attributes
- Strong Kubernetes attribute support makes pod-level debugging fast
- Developer-friendly UI designed for exploring unknown issues
Cons:
- Event-based pricing can be unpredictable for teams with variable trace volume
- SaaS-only deployment rules it out for on-prem requirements
- Steeper learning curve than traditional APM tools
- Limited integrations compared to broader platforms like Datadog
Best for: Teams debugging complex distributed systems who need high-cardinality trace analysis.
8. Dynatrace
Website: dynatrace.com/platform/distributed-tracing License: Commercial (SaaS or managed on-prem) Deployment: SaaS or managed on-prem
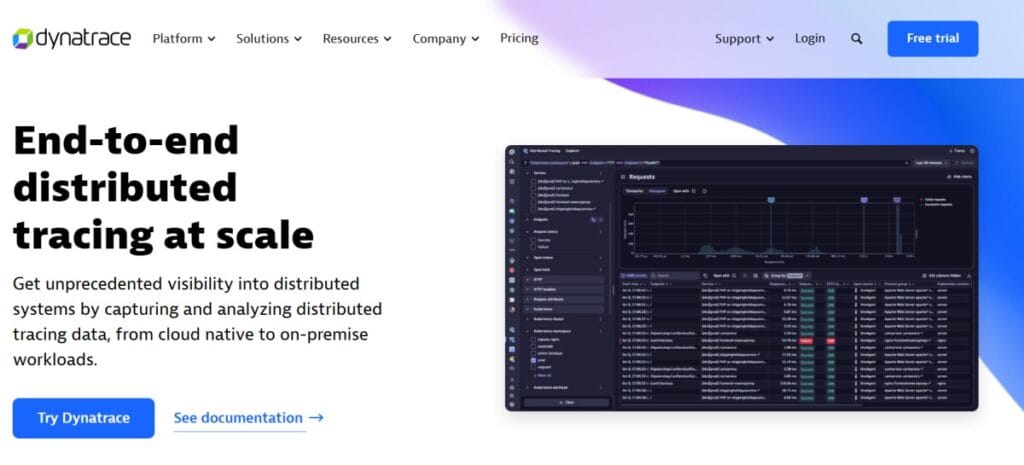
Dynatrace is an enterprise observability platform with AI-powered root cause analysis and full-stack monitoring. Its Davis AI engine automatically correlates traces with logs, metrics, and Kubernetes events to identify performance issues.
Key Features:
- OneAgent automatically instruments applications and Kubernetes pods
- Davis AI correlates traces with infrastructure events, pod restarts, and HPA scaling
- Full-stack entity model links traces to Kubernetes nodes, pods, and services
- Smartscape topology maps show real-time service dependencies
- Business analytics tied to trace performance
Pricing: Usage-based pricing starting at $0.20/GiB for logs plus host-based fees. A 50-node cluster costs approximately $7,000-10,000/month depending on feature usage. See Dynatrace pricing for current rates.
Pricing varies significantly by deployment model, feature set, and contract terms. Contact Dynatrace for custom quotes.
Pros:
- Davis AI automates root cause analysis across traces, logs, and infrastructure
- Automatic instrumentation reduces setup time
- Strong Kubernetes support with pod-level visibility and event correlation
- Managed on-prem option available for regulated industries
Cons:
- High cost compared to open source and leaner SaaS tools
- Complex licensing with multiple product SKUs
- Steep learning curve for teams new to Dynatrace
- Automatic instrumentation can add overhead to resource-constrained pods
Best for: Large enterprises that need AI-automated root cause analysis and have budget for premium tools.
9. Elastic APM
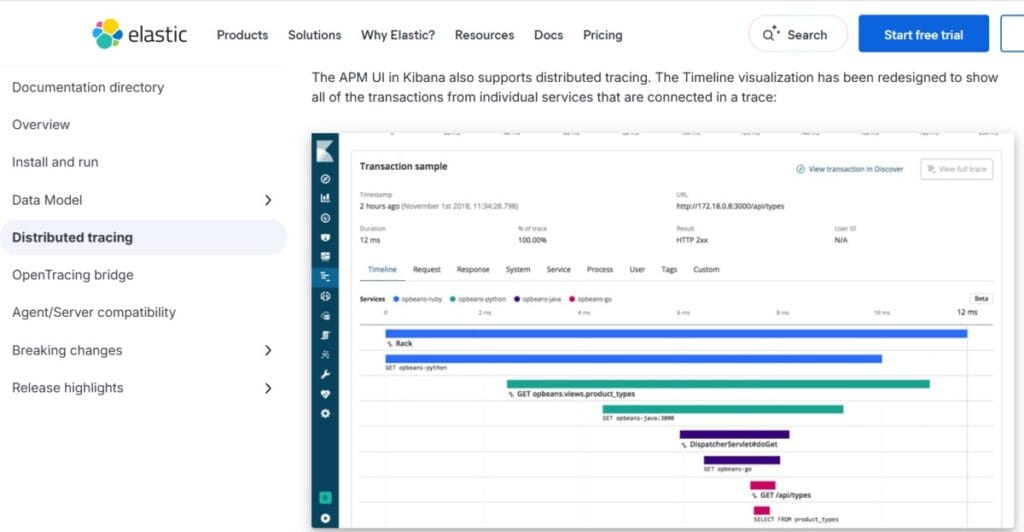
Website: elastic.co/observability/application-performance-monitoring License: Elastic License 2.0 (source available) or commercial Deployment: Self-hosted or Elastic Cloud
Elastic APM is the tracing component of the Elastic Observability stack. It stores traces in Elasticsearch alongside logs and metrics, making it a natural fit for teams already using the ELK stack.
Key Features:
- Trace data stored in Elasticsearch for unified querying with logs and metrics
- Kubernetes metadata automatically enriched in trace spans
- Service maps showing dependencies between microservices
- Machine learning for anomaly detection on trace latency
- APM agents for automatic instrumentation in popular languages
Pricing: Free (self-hosted). Elastic Cloud starts at $99/month for Standard plan with usage-based pricing beyond included capacity. A 50-node cluster ingesting 30 TB/month costs approximately $6,000-8,000/month on Elastic Cloud. See Elastic pricing for current rates.
Pricing varies by deployment model, retention, and indexing strategy. Verify with Elastic directly.
Pros:
- Natural fit for teams already using Elasticsearch, Logstash, and Kibana
- Unified storage for traces, logs, and metrics simplifies architecture
- Kubernetes metadata enrichment makes trace queries powerful
- Strong query language (KQL) for advanced trace analysis
Cons:
- Elasticsearch operational overhead increases with trace volume
- Query performance degrades without careful index management
- Less mature than dedicated tracing tools like Jaeger
- Limited OpenTelemetry support compared to native OTel tools
Best for: Teams already operating the ELK stack who want to add distributed tracing without adopting a new tool.
10. Zipkin
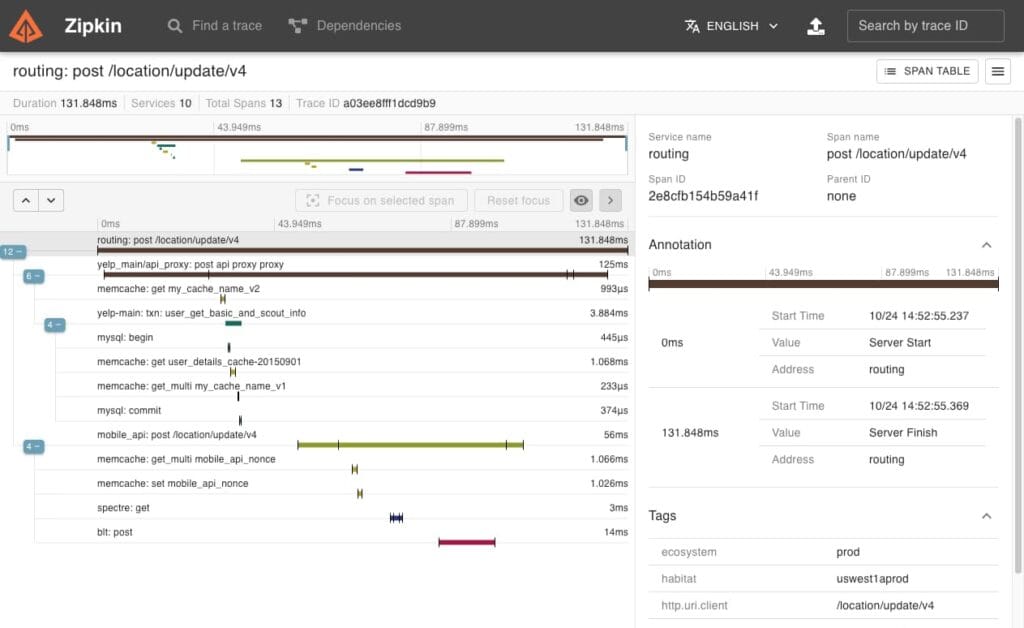
Website: zipkin.io License: Apache 2.0 (open source) Deployment: Self-hosted
Zipkin is a lightweight open source distributed tracing system originally created by Twitter. It is one of the oldest tracing tools and remains popular for teams that need a simple, proven solution without heavy operational overhead.
Key Features:
- OpenTelemetry compatible with OTLP support
- Kubernetes service discovery for automatic trace collection
- Simple span collection with minimal agent configuration
- Storage backends include Cassandra, Elasticsearch, and MySQL
- RESTful API for custom integrations
Pricing: Free (self-hosted). Infrastructure costs vary by storage backend. A 50-node cluster with MySQL storage costs approximately $400-600/month.
Pros:
- Extremely lightweight with minimal resource overhead
- Simple architecture makes it easy to understand and debug
- Proven track record with years of production use
- Vendor neutral and fully open source
Cons:
- Limited feature set compared to modern tracing tools
- No built-in log or metric correlation
- UI feels dated compared to newer tools
- Query performance limited on high-cardinality traces
Best for: Teams that need a simple, lightweight tracing backend and do not require advanced features.
How to Choose the Right Distributed Tracing Tool for Kubernetes
Selecting a distributed tracing tool for Kubernetes depends on five key factors: deployment model, cost structure, OpenTelemetry compatibility, Kubernetes-specific features, and existing observability stack.
Deployment model: If you need on-prem deployment for data residency or compliance, consider CubeAPM, Jaeger, Grafana Tempo, SigNoz, or Elastic APM. If you prefer SaaS, Datadog, New Relic, Honeycomb, or Dynatrace are strong options.
Cost structure: For predictable costs at scale, per-GB pricing (CubeAPM, SigNoz Cloud) or self-hosted tools (Jaeger, Tempo, Zipkin) avoid the per-host or per-event pricing traps of Datadog and Honeycomb.
OpenTelemetry compatibility: Native OTLP support (CubeAPM, Jaeger, Tempo, SigNoz, Honeycomb) eliminates vendor lock-in and works with any instrumented application. Partial support (Datadog, New Relic, Elastic) often requires proprietary agents.
Kubernetes-specific features: Look for tools that understand pod labels, namespaces, HPA events, and service mesh context. CubeAPM, Datadog, Dynatrace, and SigNoz excel here. Jaeger and Tempo require additional configuration for Kubernetes-specific enrichment.
Existing observability stack: If you already use Grafana, add Tempo. If you already use the ELK stack, add Elastic APM. If you already use Prometheus, consider top distributed tracing tools that integrate well with your current setup. If you are starting fresh, CubeAPM or SigNoz provide unified observability without stitching together multiple tools.
The final decision comes down to whether you prioritize cost predictability and data control (CubeAPM, Jaeger, Tempo) or breadth of features and managed service (Datadog, New Relic, Dynatrace).
Kubernetes adds latency at every layer: pod network, service mesh, ingress, and sidecar proxies. Distributed tracing is the only way to see exactly where that latency comes from. The tools in this guide all solve that problem, but they differ significantly in cost, deployment model, and how deeply they understand Kubernetes-specific signals. For teams running Kubernetes at scale, the choice between a $4,500/month unified platform like CubeAPM and a $12,000/month SaaS tool like New Relic depends on whether you value data control and cost predictability or managed service and breadth of integrations.
Disclaimer: The information in this article reflects the latest details available at the time of publication and may change as technologies and products evolve. Features, pricing, and plan limits can change over time. Always verify the latest information directly with the vendor before making purchasing or deployment decisions.
Frequently Asked Questions
What is distributed tracing in Kubernetes?
Distributed tracing in Kubernetes tracks a single user request as it flows across multiple pods, services, and microservices. Each step of the request generates a span with timing data, and all spans are grouped into a trace that shows the complete request path. This helps you identify which pod or service caused a latency spike or error.
What is the best monitoring tool for Kubernetes?
The best monitoring tool depends on your priorities. CubeAPM offers unified traces, logs, and metrics with on-prem deployment and predictable pricing. Datadog provides breadth across APM, logs, and infrastructure with managed service. Grafana Tempo integrates deeply with the Grafana stack for teams already using Prometheus and Loki.
Which tool is commonly used for distributed tracing in microservices?
Jaeger is the most commonly used open source distributed tracing tool for microservices because of its CNCF graduated status, strong Kubernetes support, and OpenTelemetry compatibility. For commercial tools, Datadog APM is widely adopted in enterprise environments, while top distributed tracing tools for microservices like CubeAPM are gaining traction for cost-conscious teams.
Does Grafana support distributed tracing?
Yes. Grafana integrates with distributed tracing backends like Tempo, Jaeger, and Zipkin. Grafana Tempo is specifically designed as a trace storage backend that works natively with Grafana for visualization and correlation with logs and metrics.
How do I instrument my Kubernetes application for distributed tracing?
Use OpenTelemetry SDKs to instrument your application code. Deploy the OpenTelemetry Collector as a DaemonSet or sidecar in your Kubernetes cluster to collect traces from instrumented pods. Configure the collector to export traces to your chosen backend like CubeAPM, Jaeger, or Tempo using OTLP.
What is the difference between APM and distributed tracing?
APM (Application Performance Monitoring) is a broader category that includes distributed tracing, error tracking, metrics, and Real User Monitoring. Distributed tracing is one specific signal type within APM that tracks request paths across services. Most modern APM tools include distributed tracing as a core feature.
Can I use distributed tracing without instrumenting my code?
Yes, with limitations. Service mesh tools like Istio and Linkerd can generate basic traces automatically by capturing network traffic between pods. However, these traces lack application-level context like database queries or function calls. For full visibility, you need to instrument your application code with OpenTelemetry or vendor-specific agents.