









Monitoring RabbitMQ, Kafka, and ActiveMQ is harder than basic uptime checks because each broker fails in a different way. Most messaging broker incidents build up before they become visible. By the time an alert fires, the issue may already be affecting producers, consumers, or downstream services.
The harder problem is that RabbitMQ, Kafka, and ActiveMQ have different architectures and different failure modes. A monitoring setup built for one does not transfer to the others. Queue depth is a critical signal in RabbitMQ. In Kafka, it tells you almost nothing, because consumers pull at their own pace and the broker has no opinion on whether they are keeping up.
This handbook breaks down the metrics, alerts, dashboards, and setup steps engineers need to monitor RabbitMQ, Kafka, and ActiveMQ in 2026.
Why Message Broker Monitoring Matters in 2026
Three changes in the last two years make existing monitoring setups worth revisiting.
Apache Kafka 4.0, released March 2025, removed ZooKeeper entirely. KRaft is now the only supported coordination mode. Any runbook referencing ZooKeeper connection counts or session errors is obsolete.
RabbitMQ also changed the metadata-store path. Khepri became fully supported in RabbitMQ 4.0 and became the default backend in RabbitMQ 4.2, while upgraded clusters may still run on Mnesia unless Khepri is enabled. That means teams need to know which metadata store their cluster is actually using before trusting old dashboards.
ActiveMQ is still widely used, but its PeerSpot user-engagement mindshare fell from 26.4% to 19.8% by May 2026. Many teams now run ActiveMQ alongside Artemis, Kafka, or other brokers during migrations, which creates separate JMX namespaces, different metrics, and more monitoring work.
Quick Reference: Architecture and Monitoring Interface by Broker
Each broker has a distinct failure profile. That profile determines which metrics are worth alerting on.
| Dimension | RabbitMQ 4.1 | Apache Kafka 4.1 | Apache ActiveMQ 5.x |
| Architecture | Exchange-and-queue broker | Partitioned distributed log | JMS message broker |
| Throughput profile | High for queues; higher with Streams | Very high with partitions/batching | Moderate; JVM and disk dependent |
| Latency profile | Low, but persistence adds overhead | Batching can add delay | Low to moderate |
| Main failure risks | Memory/disk alarms, blocked publishers | Consumer lag, under-replication | Heap pressure, blocked producers |
| Cluster coordination | Mnesia default; Khepri optional | KRaft only; no ZooKeeper | Shared file, JDBC, or broker network |
| Monitoring interface | HTTP API, UI, Prometheus plugin | JMX and metrics reporters | JMX, Jolokia, JMX exporter |
Monitoring RabbitMQ: The Complete 2026 Guide
RabbitMQ is a push-based broker. Producers send to exchanges, exchanges route into queues, and the broker pushes messages to consumers.
The failure mode that ends most RabbitMQ incidents is resource exhaustion. Once memory or disk thresholds are breached, RabbitMQ activates flow control and stops accepting new publishes across all connections. Producers are blocked before you know about it.
Effective RabbitMQ monitoring means watching resource levels and queue states well before they reach alarm territory.
Critical RabbitMQ Metrics
Queue Depth and Message States
Queue depth is the most actionable signal in RabbitMQ. Messages are in one of three states at any moment:
- Ready: waiting to be delivered to a consumer
- Unacknowledged: delivered but not yet acknowledged, meaning the consumer is still processing
- Total: the sum of both
The split between ready and unacknowledged messages is often more useful than the total queue depth. If unacknowledged messages keep rising while throughput stays flat, consumers may be stuck, slow, or failing to acknowledge messages. If ready messages keep building while unacknowledged stays at zero, the queue may have no active consumers, or consumers may not be receiving messages.
Memory and Disk Alarms
RabbitMQ blocks all publishing connections when memory hits 40% of total system RAM by default. The disk alarm fires when free disk falls below 50 MB. Both are configurable. Monitor via the HTTP Management API at /api/nodes or the Prometheus endpoint:
rabbitmq_process_resident_memory_bytes: raw memory consumptionrabbitmq_disk_space_available_bytes: free disk remainingrabbitmq_alarms_memory_used_watermark: 1 when the memory alarm is active. Page immediately.rabbitmq_alarms_free_disk_space_watermark: 1 when the disk alarm is active
Connection and Channel Churn
Every RabbitMQ connection consumes an Erlang process and an OS file descriptor. Applications that open connections per request rather than pooling them will eventually exhaust both.
- rabbitmq_connections: total open connections
- rabbitmq_channels: total open channels, should scale proportionally with connections
- rabbitmq_connection_created_total: rate of new connections. A sudden spike almost always indicates a reconnection storm from a brief network partition or broker restart
Consumer Utilisation
Consumer utilisation measures what fraction of its time a consumer is actually active. A value of 1.0 means always busy. A value of 0.3 means idle 70% of the time, which usually points to a low prefetch count or a slow processing function.
Available per-queue through the Management API. Track it on any queue where depth is growing despite consumers being present.
Message Rates
rabbitmq_queue_messages_published_total: messages published per queuerabbitmq_queue_messages_delivered_total: messages delivered to consumersrabbitmq_queue_messages_redelivered_total: redeliveries. A rising rate points to a consumer-side processing bug, not a capacity problem
Setting Up Prometheus and Grafana for RabbitMQ
RabbitMQ ships a native Prometheus plugin since version 3.8. One command enables it:
rabbitmq-plugins enable rabbitmq_prometheusMetrics are available at http://<node>:15692/metrics. Add a Prometheus scrape job and import Grafana Dashboard ID 10991 as a starting point.
The HTTP Management API
The Management API at port 15672 exposes full broker state in JSON. Most useful endpoints: /api/overview for a cluster summary, /api/queues for per-queue state and consumer details, /api/nodes for per-node memory and file descriptor usage.
Use the API for investigation. Use Prometheus scraping for alerting.
Alerting Thresholds
| Metric | When to warn | When to page |
| Memory alarm | No warning needed | Alarm is active |
| Disk alarm | No warning needed | Alarm is active |
| Ready messages | Above the queue’s normal range | Sustained growth or 2x baseline |
| Unacknowledged messages | Growing for 10 minutes | No meaningful drop for 30 minutes |
| Critical queue consumers | Below the redundancy target | 0 active consumers |
| File descriptors | Above 70% of OS limit | Above 90% of OS limit |
Security Monitoring for RabbitMQ
RabbitMQ’s native audit logs capture basic user actions but lack filtering and correlation. Supplement them:
- Enable
rabbitmq_auth_backend_ldapand alert on failed LDAP bind attempts - Track connection creation rate by source IP. A spike from a single IP on port 5672 is usually credential stuffing or a misconfigured reconnect loop
- RabbitMQ supports OAuth 2.0 natively. Monitor token expiry and forced disconnections; both look like ordinary consumer churn until you check the reason codes
- Alert on any new virtual host created in production. It is a rare event outside deployment pipelines
- Monitor TLS handshake failures. A spike usually means a client certificate misconfiguration or a port scanner
Monitoring Apache Kafka: Consumer Lag, Partition Health, and KRaft
Kafka has a different operating model from RabbitMQ. Producers write records to topic partitions, while consumers read those partitions at their own pace and track progress through offsets.
That makes consumer lag one of the first Kafka signals to watch. If a consumer group stops keeping up, the broker will continue accepting writes, but downstream services may start working with delayed data long before the issue is visible to users.
Critical Kafka Metrics
Consumer Lag
Consumer lag is the gap between the latest offset written to a partition and the offset a consumer group has committed.
Lag = Log End Offset - Current Committed OffsetSteady growth means consumer throughput is consistently below producer throughput. A spike that recovers is usually transient: a slow batch, a GC pause, a brief dependency blip.
Track per consumer group and per partition using:
- JMX: kafka.consumer:type=consumer-fetch-manager-metrics,client-id=*,topic=*,partition=*,name=records-lag
- Burrow (https://github.com/linkedin/Burrow): evaluates lag trends over time rather than absolute values, significantly reducing false positives from normal traffic variability
- kafka_exporter (https://github.com/danielqsj/kafka_exporter): exposes per-group per-partition lag as Prometheus metrics, which the JMX Exporter alone does not provide
Under-Replicated Partitions
Under-replicated partitions are the most urgent broker health signal in Kafka. A partition is under-replicated when one or more in-sync replicas has fallen behind the leader. The effective replication factor drops. A broker failure at that point risks data loss.
The main signal to monitor is:
- JMX: kafka.server:type=ReplicaManager,name=UnderReplicatedPartitions
- Target: 0 at all times
- Common causes: disk I/O pressure on a broker, a recently restarted broker still catching up, or a network partition between brokers
Active Controller Count
Exactly one broker should hold the controller role at any time. The controller manages partition leadership and handles broker failures.
Use this metric to confirm controller health:
- JMX: kafka.controller:type=KafkaController,name=ActiveControllerCount
- Value of 0: no controller elected. The cluster cannot reassign partition leadership
- Value greater than 1: split-brain condition requiring immediate intervention
Broker Throughput
The core throughput metrics are:
kafka.server:type=BrokerTopicMetrics,name=BytesInPerSec: incoming byte ratekafka.server:type=BrokerTopicMetrics,name=BytesOutPerSec: outgoing byte ratekafka.server:type=BrokerTopicMetrics,name=MessagesInPerSec: message ingestion rate
A drop in BytesInPerSec without a matching drop in producer activity signals a partition leadership problem. A spike in BytesOutPerSec without a corresponding business event usually means a consumer is replaying from an older offset.
Request Latency
Start with these request metrics:
kafka.network:type=RequestMetrics,name=TotalTimeMs,request=Produce: end-to-end produce latencykafka.network:type=RequestMetrics,name=TotalTimeMs,request=FetchConsumer: consumer fetch latency- For acks=all with three-way replication on healthy hardware, a realistic p99 baseline is 100 to 300 ms. Above 500 ms warrants investigation
KRaft-Specific Metrics (Kafka 4.0 and Later)
Useful KRaft-specific metrics include:
With ZooKeeper removed in Kafka 4.0, these replace the old ZooKeeper health checks:
kafka.controller:type=MetadataManager,name=LastAppliedRecordOffset: how far each controller has applied the metadata log. A growing gap indicates a stressed controller quorumkafka.controller:type=ControllerMetrics,name=EventQueueTimeMs: how long events wait before the controller processes them. Elevated values mean the controller is overloaded
Setting Up JMX to Prometheus for Kafka
Kafka exposes broker metrics through JMX, so the usual setup is to run the Prometheus JMX Exporter as a Java agent with each broker JVM. The exporter opens an HTTP endpoint that Prometheus can scrape. Use a Kafka-specific rules file instead of exposing every MBean, otherwise the metric set can become noisy and hard to manage.
Consumer lag needs separate treatment. The JMX Exporter can expose broker and JVM metrics, but group-level lag is usually easier to monitor with kafka_exporter or Burrow. These tools read consumer group offsets and expose lag in a form that works better for Prometheus alerts and Grafana dashboards.
For Amazon MSK, CloudWatch already includes broker and consumer-lag metrics, but the level of detail depends on the monitoring tier. DEFAULT gives basic cluster metrics, while PER_BROKER, PER_TOPIC_PER_BROKER, and PER_TOPIC_PER_PARTITION add more granular broker, topic, and partition-level visibility.
Alerting Thresholds
| Metric | Warning | Critical |
| UnderReplicatedPartitions | >0 for more than 5 minutes | >0 outside maintenance; page immediately |
| ActiveControllerCount | Not equal to 1 | 0 or >1; page immediately |
| Consumer lag per group | Growing for 10 minutes | Exceeds SLA processing window |
| OfflinePartitionsCount | >0 | >0; page immediately |
| JVM heap used | >70% | >85% |
| Disk used per broker | >60% | >80% |
Security Monitoring for Kafka
Kafka supports SSL/TLS for encryption and SASL for authentication. Key signals:
- Failed authentication attempts via RequestMetrics for Authenticate requests. A spike usually means rotated or expired client credentials
- For SASL/OAUTHBEARER: token refresh failures. A consumer that cannot refresh stops consuming. The resulting lag looks identical to a slow consumer unless you are also tracking auth errors
- Connections per authenticated principal. An unfamiliar principal or a known one from an unexpected IP warrants a look
- AWS MSK Audit Logging and Confluent Platform both provide principal-level event tracking. Enable it and route logs to your SIEM
Monitoring Apache ActiveMQ: JVM Health, Blocked Producers, and Store Usage
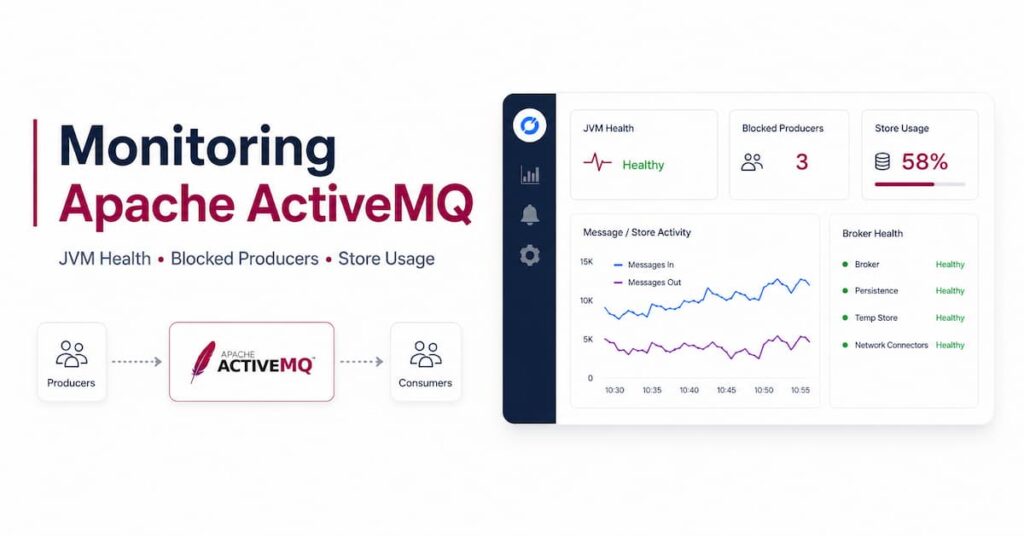
ActiveMQ is a JMS-centric broker running on the JVM. Its failure modes are JVM heap exhaustion, KahaDB index corruption, and producers blocked by destination memory limits.
ActiveMQ Classic exposes everything through JMX. There is no native Prometheus endpoint without a third-party exporter.
Critical ActiveMQ Metrics
BlockedProducerWaitTime is the most important ActiveMQ metric to watch. When a queue or topic hits its memory limit, ActiveMQ blocks the producer thread until space opens. A non-zero value means producers are stalled right now.
Monitor this at the destination level:
- JMX MBean: org.apache.activemq:type=Broker,brokerName=*,destinationType=Queue,destinationName=*
- Attribute: BlockedProducerWaitTime
- Target: 0. Any non-zero reading is an immediate investigation
ActiveMQ runs on the JVM, so heap pressure can quickly become broker pressure. Messages may sit in memory before being paged to disk, and when garbage collection cannot keep up, the broker can pause, slow down, or block producers.
Start with the standard JVM memory metric:
- JMX: java.lang:type=Memory, HeapMemoryUsage (used vs max)
- Warning above 70%; critical above 85%
- Enable GC logging and correlate pause duration with throughput drops. Long pauses are usually the root cause of intermittent blocking
When a queue has zero consumers, messages accumulate indefinitely. ActiveMQ does not reroute automatically. A queue with no consumers is a silent failure.
Track this on every critical queue:
- JMX attribute: ConsumerCount on the destination MBean
- Alert when ConsumerCount on any critical queue drops to zero
Queue depth matters more when it is viewed together with enqueue and dequeue rates. A queue can be large but healthy if it is draining normally; it becomes risky when messages arrive faster than they leave.
Use these destination-level counters together:
- QueueSize: current depth. Growing depth with healthy consumers signals a volume spike
- EnqueueCount: cumulative messages written since last restart
- DequeueCount: cumulative messages acknowledged
Track the rate of EnqueueCount minus the rate of DequeueCount. Sustained positive divergence means the queue is growing faster than it drains.
KahaDB writes messages sequentially and maintains a separate index. Under heavy writes the index becomes a contention point. After an unclean shutdown, index recovery can take minutes.
Monitor both broker store usage and filesystem usage:
- StorePercentUsage: percentage of the configured store limit in use. Alert above 70%
- JMX: org.apache.activemq:type=Broker,brokerName=*,service=PersistenceAdapter,instanceName=*
- File system usage of the KahaDB data directory. When disk fills, the broker stalls entirely
These two metrics show how close ActiveMQ is to its configured memory and temporary storage limits. They usually rise before producers are fully blocked, so they are useful early-warning signals.
Track:
- MemoryPercentUsage: how much of the broker memory limit is in use
- TempPercentUsage: how much temporary storage is being used for non-persistent messages
Treat either metric above 90% as urgent. At that point, the broker is close to producer flow control, even if BlockedProducerWaitTime has not started climbing yet.
Setting Up Prometheus Monitoring for ActiveMQ
ActiveMQ Classic does not expose Prometheus metrics by default, so most teams use the Prometheus JMX Exporter.
A basic setup looks like this:
- Run the JMX Exporter as a Java agent with the ActiveMQ JVM.
- Use an ActiveMQ-specific rules file so you only collect the broker, destination, store, and JVM metrics you need.
- Configure Prometheus to scrape the exporter endpoint.
- Build alerts for memory usage, temp usage, store usage, queue depth, consumer count, and blocked producers.
The ActiveMQ Web Console at http://<host>:8161/admin is helpful during troubleshooting. It should not replace automated alerts, dashboards, or long-term metric storage.
ActiveMQ Classic vs Artemis: Monitoring Differences
Monitoring is one of the areas teams often underestimate during an ActiveMQ Classic to Artemis migration. Both brokers support JMX, but their metric names and management paths are different.
The main differences are:
- Classic uses the
org.apache.activemqMBean namespace. - Artemis uses the
org.apache.activemq.artemisnamespace. - Classic advisory topics such as
ActiveMQ.Advisory.*do not have a direct one-to-one replacement in Artemis. - Dashboards, alert rules, and runbooks built for Classic usually need to be rebuilt for Artemis.
This does not mean Artemis is harder to monitor. It just means Classic monitoring should not be copied over unchanged.
Unified Observability: Monitoring All Three Brokers Together
Most production environments run more than one broker. Analytics on Kafka. Task queues on RabbitMQ. Legacy integrations on ActiveMQ.
The observability stack needs to cover all of them without creating separate silos that no one crosses during an incident.
6.1 Prometheus and Grafana
The standard open-source setup for 2026:
- RabbitMQ: enable the
rabbitmq_prometheusplugin and scrapehttp://<node>:15692/metrics - Kafka: deploy the JMX Exporter as a Java agent on each broker, and run
kafka_exporterseparately for consumer group lag - ActiveMQ: deploy the JMX Exporter with an ActiveMQ-specific MBean rules file
Grafana Dashboard ID 10991 covers RabbitMQ. The Confluent community maintains Kafka dashboards. For ActiveMQ environments, meshIQ’s Infrared360 provides a unified console covering both Classic and Artemis.
OpenTelemetry for Distributed Tracing
Prometheus shows the broker-side symptoms. OpenTelemetry helps connect those symptoms to the producer, consumer, or downstream service involved.
Instrument producers and consumers with OpenTelemetry, then propagate trace context through message headers. This allows a trace to follow the path from message publish to broker interaction to consumer processing, instead of treating each service as a separate incident. OpenTelemetry’s messaging conventions are designed for this kind of producer-consumer workflow.
On the consumer side, one of the most useful signals is the time between message publication and processing start. It shows how long the message waited before a consumer picked it up, which is often the missing link between broker metrics and user-facing delay.
CubeAPM for Broker Monitoring
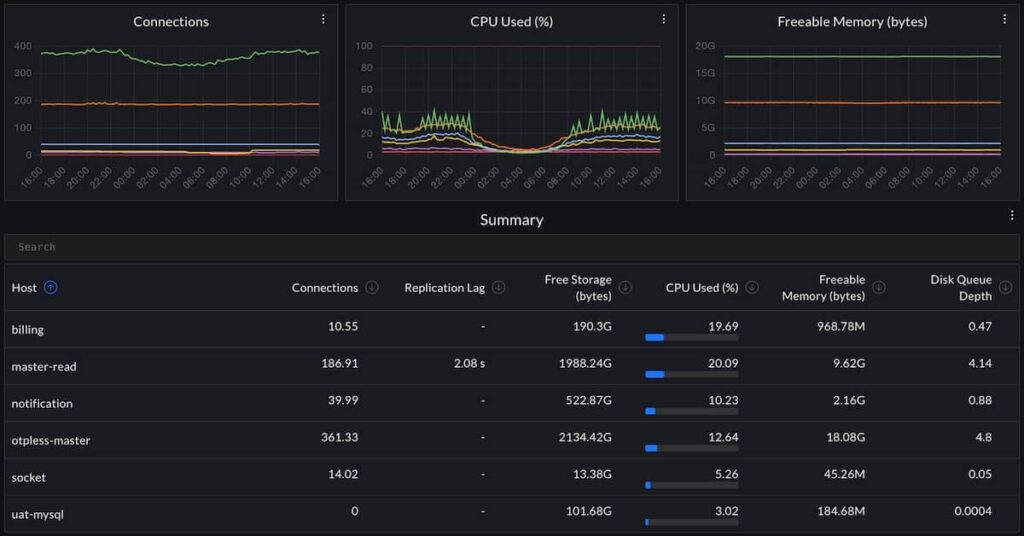
CubeAPM integrates with the Prometheus pipeline for all three brokers and adds:
- Correlated alerting: surface a consumer lag spike alongside the upstream service error rate that caused it
- Baseline-relative anomaly detection: alert when queue depth deviates from historical patterns rather than fixed thresholds, reducing false positives during expected traffic spikes
- Unified broker view: RabbitMQ, Kafka, and ActiveMQ side-by-side in one dashboard
- Trace-to-metric correlation: link OpenTelemetry spans to broker metric events without switching tools
Monitoring Tools Comparison for 2026
| Tool | RabbitMQ | Kafka | ActiveMQ | Best suited for |
| Prometheus + Grafana | Prometheus plugin | JMX Exporter + kafka_exporter | JMX Exporter | Open-source monitoring stacks |
| Datadog | Agent integration | Agent/JMX integration | Agent/JMX integration | Teams already using Datadog |
| Confluent Control Center | No | Yes | No | Confluent Platform users |
| meshIQ Infrared360 | Yes | Yes | Yes | Enterprise messaging estates |
| CubeAPM | Via Prometheus | Via Prometheus | Via JMX Exporter | APM plus broker monitoring |
| Burrow | No | Consumer lag only | No | Kafka lag trend analysis |
| AWS CloudWatch | Amazon MQ RabbitMQ | Amazon MSK | Amazon MQ ActiveMQ | AWS-managed brokers |
Alerting Best Practices
Alerting on raw metrics without context is how teams learn to ignore alerts. A RabbitMQ queue at 50,000 messages may be normal for one workload and critical for another. Alert on baseline changes, growth rate, and business impact, not only fixed thresholds. In Prometheus, functions like predict_linear() and deriv() can help catch queues, lag, or disk usage trending toward failure.
Before adding an alert, define the first action the on-call engineer should take. “Check the dashboard” is not enough.
- RabbitMQ: memory alarm, disk alarm, zero consumers, unacknowledged messages not dropping
- Kafka: under-replicated partitions, controller count not equal to 1, consumer lag growing
- ActiveMQ: blocked producers, heap above 85%, zero consumers, store usage above safe limits
Each alert should point to the likely cause, the dashboard to open, and the command or service owner needed for the next step.
Not every broker alert needs the same urgency. A payment queue falling behind can affect revenue immediately and should page the on-call engineer. A Kafka broker trending high on CPU may be a capacity issue unless it is already affecting throughput, latency, or consumer lag.
Keep customer-impacting alerts separate from infrastructure trend alerts. When both go into the same channel, real incidents get buried in noise.
A growing DLQ usually points to a consumer-side processing bug and deserves its own alert.
- RabbitMQ: monitor the dead-letter queue behind the configured dead-letter exchange.
- Kafka: use a dedicated DLQ topic and alert when failed messages are not being reviewed or drained.
- ActiveMQ: monitor
ActiveMQ.DLQdepth through JMX.
In production, even a small DLQ count is worth checking.
In regulated environments, monitoring should prove that delivery guarantees, access controls, and audit trails are working. Native broker metrics help, but they are not enough on their own.
Track delivery assurance signals:
- Kafka: producer error rate, idempotency issues, and transaction coordinator errors
- RabbitMQ: publish rate versus confirm rate
- ActiveMQ: JMS transaction rollback trends
Centralize broker logs in a SIEM or log platform with the right retention policy. Use read-only monitoring credentials, and avoid giving observability tools permission to produce or consume messages unless there is a strong operational reason.
Conclusion
RabbitMQ, Kafka, and ActiveMQ each fail in their own way and surface that failure through different signals. Getting monitoring right means understanding those differences rather than applying the same checklist to all three.
The tooling is mature. The Prometheus pipeline covers all three through the exporter ecosystem. Platforms like CubeAPM add application-level correlation that turns broker metrics into something actionable during an incident rather than another dashboard to scroll through.
Start with the checklist in Section 10. Get the critical alerts firing first, then build toward unified observability across your full messaging stack.
Disclaimer: Monitoring recommendations and alert thresholds can vary by broker version, workload, deployment model, and traffic pattern. Treat the examples in this article as a starting point, and tune them against your own RabbitMQ, Kafka, or ActiveMQ environment before using them in production.
FAQs
1. What is the most important metric when monitoring RabbitMQ?
Memory and disk alarms are the most dangerous because they block all producers the moment they fire. After alarms, unacknowledged message count is the most useful day-to-day signal. A climbing unacknowledged count with no rise in throughput tells you consumers are hung, often well before queue depth triggers a threshold alert.
2. How do I monitor Kafka consumer lag?
Kafka provides no built-in consumer lag alerting. kafka_exporter exposes per-group per-partition lag as Prometheus metrics you can alert on in Grafana. Burrow evaluates lag trends over time and reduces false positives from normal traffic variability. For AWS MSK, consumer lag is available natively in CloudWatch under enhanced monitoring.
3. How is monitoring ActiveMQ different from monitoring Artemis?
The interface is the same (JMX) but the MBean namespaces differ entirely. ActiveMQ uses org.apache.activemq; Artemis uses org.apache.activemq.artemis. Advisory messages, a common foundation for ActiveMQ monitoring tooling, have no direct equivalent in Artemis. Dashboards and alert rules built for Classic are not portable to Artemis.
4. What changed in Kafka monitoring after the move to KRaft?
ZooKeeper-specific monitoring is obsolete: connection counts, session errors, ZK latency. Replace those with KRaft metrics: metadata log offset lag between controller nodes, controller event queue time, and active controller count. The controller count alert still applies; KRaft manages it internally now.
5. Do I need a paid tool to monitor all three brokers?
No. The Prometheus and Grafana stack handles all three with open-source components. RabbitMQ ships its own plugin. Kafka uses the JMX Exporter and kafka_exporter. ActiveMQ uses the JMX Exporter. Commercial tools like Datadog, Confluent Control Center, meshIQ Infrared360, and CubeAPM reduce setup overhead and add cross-broker correlation, but they are not a prerequisite.