ManageEngine Site24x7 is a cloud-based IT monitoring platform that offers a comprehensive suite covering infrastructure monitoring, synthetic checks, real user monitoring (RUM), APM, and log analytics. However, users have expressed their concerns about Site24x7’s pricing being high, a learning curve for beginners, and some alert issues.
CubeAPM is the best ManageEngine Site24x7 alternative with a cost-efficient full-stack observability solution. It supports full self-hosting on your own-premise or cloud infrastructure. It also cuts down costs with context-based smart sampling. In this article, we’ll cover the top Site24x7 alternatives based on features, pricing, and more.
7 Best Alternatives to ManageEngine Site24x7
- CubeAPM
- Dynatrace
- New Relic
- Datadog
- Splunk AppDynamics
- Zabbix
- LogicMonitor
Why People Are Looking for ManageEngine Site24×7 Alternatives
Pricing Complexity & Cost Overruns
ManageEngine Site24x7 employs a tiered pricing model, where its all-in-one pricing ranges from $9/month to $625/month. While the base plans may appear affordable, costs rise quickly with scale, especially for businesses ingesting high log volumes or requiring extensive synthetic monitoring. If users need more than what’s included in their chosen plan, it leads to additional costs via add-ons. Also, add-ons are priced differently for different tiers.
For example, in the Lite plan, the basic monitor add-on costs $10 for 10 monitors, l$12 for 10 GB logs with 30-day retention. Pricing also changes based on data retention duration. Similarly, there are add-ons available for host monitors, advanced monitors, network components, and RUM views. Multiple user reviews cite billing surprises and the overall pricing being expensive.
Steep Learning Curve & Interface Complexity
While Site24x7 offers an extensive suite of observability tools, user feedback often points to its interface being overwhelming, especially for new users. Some users report that navigating nested dashboards and managing multiple settings or monitors can feel clunky or unintuitive, slowing down onboarding and multi-tenant administration.
Limited Self‑Hosting
Site24x7 is primarily a SaaS/cloud-hosted monitoring platform, meaning the core product runs in Site24x7’s cloud infrastructure rather than being installed on your own servers. However, Site24x7 does provide an On-Premise Poller that you can install on your own Windows or Linux machines. This poller lets Site24x7 monitor internal resources behind firewalls or within private networks by sending data back to the cloud service, but it does not make the full Site24x7 platform self-hosted.
Criteria for Suggesting ManageEngine Site24x7 Alternatives
1. Native OpenTelemetry (OTEL) Support
We prioritized platforms that support OpenTelemetry out-of-the-box, enabling teams to collect, export, and analyze telemetry across diverse environments without vendor lock-in. OTEL-native tools future-proof observability as modern stacks evolve.
2. Full MELT Observability
Alternatives must offer integrated visibility into Metrics, Events, Logs, and Traces to enable faster root cause analysis and eliminate context switching. Partial MELT support limits insight across the full application lifecycle.
3. Transparent, Scalable Pricing
We selected tools with usage-based or flat, predictable pricing models, without charging per monitor, plugin, or feature. Tools with smart sampling or built-in retention controls were given priority for cost-efficiency at scale.
4. Deployment Flexibility (SaaS or Self-Hosted)
The best alternatives offer flexible deployment options: public cloud, private cloud, on-premise, or air-gapped. This is essential for enterprises with strict data residency, latency, or regulatory compliance requirements.
5. Sampling & Storage Optimization
To avoid data overload and bloated bills, platforms that support intelligent sampling—based on latency, errors, or traffic spikes—are favored. These help retain relevant data while reducing ingestion and storage costs.
6. Developer-Friendly Experience & Support
Alternatives must offer intuitive UIs, fast onboarding, and responsive support (chat, Slack, etc.). Tools that reduce time-to-debug and offer collaborative features earn higher marks for engineering efficiency.
ManageEngine Site24x7 Overview
Known for
ManageEngine Site24x7 is known as a cloud-based, all-in-one observability and IT monitoring platform built for DevOps, SREs, and MSPs. It offers unified visibility across servers, networks, applications, cloud resources, logs, and digital experience metrics. With support for over 60 plugin integrations and a mobile-friendly dashboard, Site24x7 simplifies infrastructure monitoring across hybrid and cloud-native environments.
Standout Features
- All-in-One Monitoring Suite: Combines APM, RUM, synthetic monitoring, server, log, network, and cloud monitoring in one tool.
- Global Synthetic Probes: Run availability and performance checks from 110+ global locations to measure digital experience across geographies.
- AIOps-Powered Anomaly Detection: Uses machine learning to detect anomalies in telemetry and reduce alert noise.
- IT Automation Workflows: Automatically trigger remediation tasks based on thresholds, reducing manual intervention.
Key Features
- APM & Distributed Tracing: Tracks application performance across code, database, and third-party dependencies for Java, .NET, PHP, Node.js, and more.
- Real User & Synthetic Monitoring: Offers browser-based RUM and synthetic checks with SLA reports and device/geo-level insights.
- Log Management (AppLogs): Provides agent-based log collection, indexing, and alerting with basic correlation across metrics and events.
- Cloud & Infra Monitoring: Supports AWS, Azure, GCP, and on-prem monitoring for servers, VMs, containers, and network devices.
- Custom Dashboards & Reports: Drag-and-drop dashboards, SLA tracking, custom reports for business and technical stakeholders.
- Multi-Tenant MSP Console: Built-in multi-customer account handling for managed service providers with role-based access.
Pros
- Broad feature set covering IT operations, synthetics, infra, logs, and RUM in a single tool
- Mobile app, easy onboarding, and prebuilt dashboards for hybrid and cloud-native environments
- Good fit for MSPs with multi-customer isolation and rebranding support
Cons
- UI may feel complex and cluttered, especially in multi-tenant setups or nested admin menus
- Expensive with various add-ons, as the monitoring scope scales
Best for
Ideal for mid-sized businesses, IT teams, and MSPs looking for a plug-and-play, SaaS-based observability platform to monitor infrastructure, applications, and digital experience. Best suited for those who value breadth of monitoring features over deep customization or OTEL-native pipelines.
Pricing & Customer Reviews
- Lite: $9/month
- Professional: $42/month
- Enterprise: $625/month
- G2 rating: 4.6/5 (330+ reviews)
- Praised for: full-stack observability, great support, and plenty of useful features
- Criticized for: Learning curve, expensive at scale
Top 7 ManageEngine Site24x7 Alternatives
1. CubeAPM

Known for
An OpenTelemetry-native observability platform designed to give modern engineering teams deep MELT coverage, blazing-fast onboarding, and cost-efficient, high-fidelity telemetry. CubeAPMstands out for its ability to offer full-stack observability with smart sampling and flexible deployment options – on-prem or BYOC (Bring Your Own Cloud).
Standout Features
- Context-Aware Smart Sampling: Retains valuable traces based on latency, error rate, and custom logic, cutting costs by up to 60% without losing anomaly visibility.
- Agent Interoperability: Drop-in compatibility with Datadog, New Relic, Prometheus, and OTEL agents ensures seamless migration.
- Rapid Setup: Deploying and collecting data within 60 minutes—no complex SDKs or manual config required.
- Slack-First Engineering Support: Direct Slack and WhatsApp channels with devs enable sub-5-minute response times and faster incident resolution.
Key Features
- Full MELT Observability: Unified monitoring of metrics, logs, traces, synthetics, RUM, and error tracking—all from a single console.
- Built for OpenTelemetry: Accepts OTLP data across all signal types, supporting a vendor-neutral pipeline.
- Transparent Usage-Based Billing: No seat-based or module-based pricing—starts at $0.15/GB with bundled infrastructure, logs, and traces.
- Flexible Deployment Modes: Supports on-premise and BYOD deployments with compliance-ready architecture.
- Built-In Dashboards & Alerting: Auto-generated visualizations for Kubernetes, databases, and infra with customizable alerts to Slack, PagerDuty, and webhooks.
- Enterprise Controls: Offers SSO, RBAC, audit logs, and multi-tenancy support for secure and collaborative usage at scale.
Pros
- Fully OTEL-native with no vendor lock-in
- Over 800 integrations and agent compatibility
- Zero egress fees or hidden charges
- Slack-native support with real engineer access
- Predictable pricing with usage transparency
- Smart sampling reduces telemetry bloat significantly
- Supports highly regulated industries with self-hosting
Cons
- Not suited for teams looking for off-prem solutions
- Strictly an observability platform, and does not support cloud security management
Best for
CubeAPM is ideal for SREs, platform teams, and DevOps engineers running containerized, microservices-heavy architectures on Kubernetes. It’s a perfect fit for companies that need granular observability, real-time support, cost control, and compliance flexibility—all without sacrificing performance.
Pricing & Customer Reviews
- Pricing: Starts at $0.15/GB, which includes metrics, traces, logs, RUM, error tracking, infra monitoring, and synthetics.
- G2 Score: 4.7/5
- Praised for: ultra-fast onboarding, low total cost of ownership, transparent billing, and best-in-class Slack-based support experience.
CubeAPM vs ManageEngine Site24x7
While Site24x7 provides a wide monitoring capabilities, CubeAPM excels in observability depth with cost-efficiency. It delivers complete self-hosting on your cloud or on-premise infrastructure to support compliance requirements.
2. Dynatrace
Known for
Dynatrace is a high-end observability and application security platform favoured by large enterprises for its ability to unify MELT telemetry with AI-powered automation. Its strength lies in its real-time topology mapping and Davis AI engine, which automatically analyzes vast telemetry streams to pinpoint performance bottlenecks, system anomalies, or security threats without manual tagging or configuration.
Standout Features
- Dynamic Topology Visualization: Continuously maps relationships between infrastructure, services, APIs, and databases, offering full system context during incident investigations.
- AI-Powered Root Cause Analysis (Davis AI): Automatically filters noise, correlates anomalies across telemetry types, and surfaces the true root cause of issues in seconds.
- Built-in Application Security: Includes real-time runtime application self-protection (RASP) to detect vulnerabilities, misconfigurations, or exploits during runtime.
- Integrated RUM & Synthetic Monitoring: Combines synthetic scripts with live user session data to trace frontend experience back to backend performance events.
Key Features
- Unified MELT Observability: Offers deep monitoring for logs, metrics, traces, RUM, events, and synthetic checks—all stored with contextual metadata.
- Effortless Auto-Instrumentation: Its OneAgent automatically detects services and dependencies without the need for manual setup or code changes.
- Full-Service Correlation: Enables tracing of frontend slowdowns to specific backend functions, network layers, or cloud resources.
- Cloud-Native & Kubernetes Visibility: Provides pod-level, container-level, and cluster-level insights along with deployment health metrics.
- Application Vulnerability Insights: Adds observability into code-level security risks as part of the APM pipeline.
- Enterprise-Grade Scaling: Built for massive infrastructures with support for multi-cloud, hybrid deployment, and centralized governance.
Pros
- Davis AI offers unmatched root cause detection capabilities
- Seamless auto-instrumentation saves engineering effort
- Combines performance monitoring with in-app security
- Real-time topology mapping makes issue scoping intuitive
- Fully integrated MELT coverage with a single agent model
Cons
- High pricing
- Learning curve
Best for
Dynatrace is ideal for global enterprises and platform teams that manage large-scale, distributed applications across hybrid or multi-cloud environments. It’s especially beneficial for teams that demand automation, zero-configuration instrumentation, real-time AI triage, and performance + security visibility—all within a single, centralized platform.
Pricing & Customer Reviews
- Full-Stack Monitoring: $0.08 per hour per 8 GiB host
- Infrastructure Monitoring: $0.04/hour per host
- Kubernetes Monitoring: $0.002/hour per pod
- RUM: $0.00225 per session
- Synthetic Monitoring: $0.001 per HTTP test
- Application Security Module: $0.018/hour per 8 GiB host
- G2 rating: 4.5/5 (based on 1,300+ reviews)
- Praised for: powerful AI-driven analytics, full-stack automation, and unmatched scale across hybrid infra
- Criticized for: High pricing
Dynatrace vs ManageEngine Site24x7
While Site24x7 targets breadth across monitoring types, Dynatrace excels in depth and automation. Its AI-powered root cause engine, full MELT stack, built-in security, and real-time topology views offer enterprise-grade capabilities.
3. Datadog
Known for
Datadog is a widely adopted cloud-native observability and security platform used by DevOps and SecOps teams to monitor applications, infrastructure, and user experience in real time. Its popularity comes from its vast integration ecosystem and its ability to deliver telemetry across multicloud environments, containers, and serverless workloads in a unified platform.
Standout Features
- 900+ Prebuilt Integrations: Datadog connects seamlessly with cloud providers, databases, messaging queues, runtimes, and DevOps tools—accelerating time to value with minimal setup.
- Session Replay for Frontend Debugging: Combines RUM with video-like replays to capture exact user sessions and assist in resolving frontend issues.
- DevSecOps in One UI: Merges security features such as runtime protection, vulnerability scanning, and compliance checks into the same interface as performance metrics.
- Collaborative Notebooks: Allows teams to annotate, share, and debug telemetry data side-by-side for faster root cause analysis and cross-functional communication.
Key Features
- Unified MELT Monitoring: Captures and correlates metrics, logs, traces, synthetics, RUM, and events under one schema for consistent analysis.
- Agent-Based Auto-Instrumentation: Supports automatic telemetry collection across core languages like Python, Java, Node.js, .NET, and Go.
- Cloud-Native Compatibility: Built-in support for AWS Lambda, Azure Functions, Kubernetes, ECS, and GCP workloads with deep service-level metrics.
- Security Telemetry Integration: Offers container security, posture management, and threat detection alongside performance data.
- CI/CD Deployment Insights: Real-time visibility into release performance by connecting build versions with telemetry anomalies.
- Custom Dashboards: Drag-and-drop widget builder for live system views, alerts, and health indicators across different teams.
Pros
- Vast integration catalog reduces custom engineering effort
- Observability and runtime security in a single dashboard
- Notebook-based RCA simplifies collaboration during incidents
- Strong Kubernetes and serverless monitoring capabilities
- Anomaly detection features reduce false positives in alerting
Cons
- High pricing for smaller teams
- No on-premise or self-hosting deployment
Best for
Datadog is best suited for high-velocity engineering teams operating complex, cloud-native architectures using Kubernetes, serverless, and multicloud services. It’s a strong option for organizations seeking tightly integrated security and observability in a single pane of glass, though the pricing model may require careful forecasting and governance.
Pricing & Customer Reviews
- Infrastructure Monitoring: $15–$34 per host/month
- APM: $31–$40 per host/month (annual), $36 on-demand
- Logs: $0.10/GB ingested
- Serverless Monitoring: $10 per million invocations
- Security Modules: $15–$40 per user/month
- G2 rating: 4.4/5 (based on 630+ reviews)
- Praised for: deep ecosystem of integrations, flexible dashboards, and real-time visibility into cloud-native environments
- Criticized for: High pricing
Datadog vs ManageEngine Site24x7
Both tools offer extensive observability coverage, but Datadog outpaces Site24x7 in terms of ecosystem breadth, frontend debugging, and security integrations.
4. New Relic
Known for
New Relic is a SaaS-based observability platform built for engineering and DevOps teams that need detailed visibility into microservices, deployments, and user experience. It provides full-stack MELT coverage with rich visualization capabilities and powerful querying through its proprietary NRQL engine, making it ideal for rapid debugging and executive reporting in fast-paced environments.
Standout Features
- Explorer View for Architecture Mapping: Automatically detects and visualizes infrastructure and service relationships, simplifying investigation across distributed systems.
- NRQL-Based Telemetry Exploration: Lets users write custom queries to analyze metrics, logs, and traces in real time, generating dynamic charts and dashboards.
- Anomaly Detection: Machine learning detects statistically unusual behavior in throughput, latency, and error patterns, filtering out alert noise.
- Flexible Dashboards & Layouts: Offers reusable widgets and layout control, allowing teams to build custom views tailored to developers, ops, or leadership.
Key Features
- Unified MELT Observability: Aggregates metrics, traces, logs, synthetics, events, and real user data into a cohesive analysis pipeline.
- Agent-Based Instrumentation: Installs agents across popular backend frameworks—Java, Go, Node.js, Python, .NET—for quick telemetry capture.
- Native Cloud & DevOps Integrations: Integrates with AWS, Azure, Kubernetes, GitHub, Jenkins, and more to connect infra, deploys, and telemetry.
- Real User Monitoring & Synthetic Checks: Measures frontend performance using real sessions and synthetic transaction scripts.
- Baseline Learning via AI Models: Adapts alert thresholds over time using system behavior patterns to minimize false positives.
- Fast Cloud Onboarding: Enables real-time dashboards and alerts within minutes of agent installation—no heavy infra tuning required.
Pros
- NRQL enables precise and interactive data slicing
- Highly customizable dashboards for different teams
- SaaS onboarding is fast with minimal setup complexity
- Auto-discovery maps make navigating complex stacks easier
- Strong CI/CD and cloud-native integrations support release observability
Cons
- No on-premise deployment option
- Complex pricing model with ingestion, user licenses, and feature tiers
Best for
New Relic is a great fit for SaaS-first organizations and DevOps teams who want quick access to telemetry, real-time anomaly detection, and dashboarding tied to CI/CD workflows. It’s especially useful for those who value powerful querying (via NRQL), fast time-to-value, and frontend + backend visibility—but are comfortable with a cloud-only platform and consumption-based pricing.
Pricing & Customer Reviews
- Free Tier: 100 GB/month ingestion, 1 core user
- Ingestion Cost: $0.40/GB depending on retention
- Core User License: $49/user/month
- Full Platform User: $349/user/month, depending on access
- G2 rating: 4.4/5 (500+ reviews)
- Praised for: highly flexible dashboards, fast onboarding, and strong querying engine
- Criticized for: no self-hosting, limited OTEL-native integration, and unpredictable pricing as teams scale
New Relic vs ManageEngine Site24x7
New Relic offers more flexibility for querying and custom visualization compared to Site24x7. While Site24x7 excels in broad out-of-the-box monitoring, New Relic’s precision querying, cloud-native support, and real-time anomaly detection give it the edge for modern application teams.
5. Splunk AppDynamics
Known for
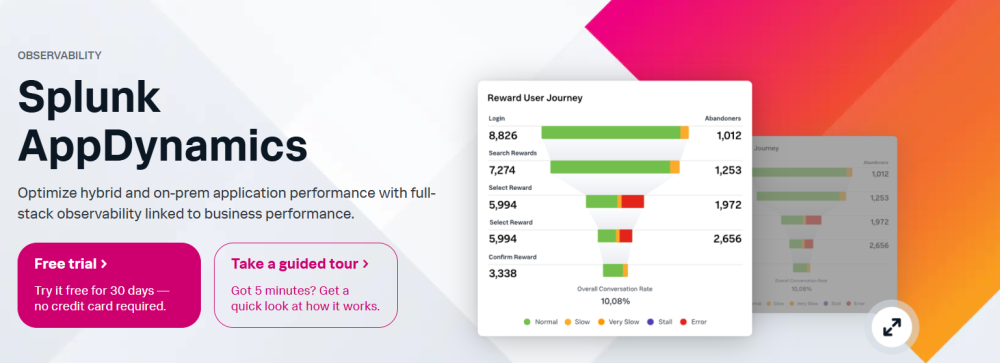
Splunk AppDynamics, part of Cisco’s observability suite, is an enterprise-grade application performance monitoring solution designed for in-depth transaction tracing. It’s especially well-regarded for linking backend performance with business KPIs, making it a go-to choice for enterprises running critical applications across hybrid infrastructure and needing real-time SLA compliance tracking.
Standout Features
- Transaction-Level Tracing: Tracks user interactions through every backend component, including APIs, services, and databases, to surface bottlenecks that directly affect user flows or business outcomes.
- Real-Time Flow Visualization: Provides live maps of service calls, nodes, and data dependencies, helping teams isolate issues during live incidents.
- Deep Code Diagnostics: Enables method-level tracing in supported languages, allowing devs to pinpoint slow functions or exceptions within specific code paths.
- Behavioral Baseline Detection: Automatically learns performance baselines and raises alerts only when meaningful deviations occur, minimizing alert fatigue.
Key Features
- Language Agent Support: Monitors apps written in Java, .NET, Python, Node.js, and PHP with advanced profiling and service dependency tracking.
- Business Transaction Monitoring: Allows tagging of high-value transactions to ensure visibility over critical user journeys or revenue-generating workflows.
- RUM & Synthetic Monitoring: Offers both real user monitoring and synthetic probes to measure experience and availability globally.
- Hybrid Cloud Support: Works across legacy datacenters, VMs, public cloud, and containerized environments—suited for enterprises in cloud transition.
- Integrated Application Security: Via Cisco Secure App, AppDynamics adds runtime security analysis without requiring extra tooling.
- CI/CD Pipeline Integration: Tracks deployment events and helps identify performance regressions tied to recent code pushes.
- Dynamic Component Discovery: Continuously scans and updates monitoring coverage as services, APIs, or nodes change in real-time.
Pros
- Extensive transaction-level tracing for high-SLA applications
- Strong support for hybrid and legacy infrastructure visibility
- Method-level diagnostics help developers fix root causes fast
- Security observability with Cisco Secure App integration
- Baseline-aware alerting improves signal-to-noise ratio
Cons
- Slower update cycle
- Alert performance issues
Best for
Splunk AppDynamics is best suited for large enterprises operating complex, SLA-bound workloads that span legacy servers and cloud-native deployments. It’s particularly effective for teams that need transaction tagging, deep diagnostics, and hybrid flexibility.
Pricing & Customer Reviews
- Infrastructure Monitoring: $6 per vCPU/month
- APM Premium: $33 per vCPU/month
- Enterprise Plan: $50 per vCPU/month (adds SLA and BI modules)
- RUM: Starts at $0.06 per 1,000 tokens/month
- Synthetic Monitoring: starts$12/location/month
- G2 rating: 4.3/5 (based on 375+ reviews)
- Praised for: advanced transaction tracing, robust hybrid infra coverage, and in-depth diagnostics
- Criticized for: complex pricing, non-OTEL instrumentation, and variable support responsiveness
Splunk AppDynamics vs ManageEngine Site24x7
While Site24x7 covers a broad spectrum of monitoring needs, AppDynamics excels at tracing individual transactions with precision and correlating backend metrics with real business impact. It provides more granular control and deeper visibility into method-level performance. However, Site24x7 offers simpler pricing and faster onboarding, whereas AppDynamics may introduce complexity in cost and deployment, especially for teams not already embedded in Cisco’s ecosystem.
6. Zabbix
Known for
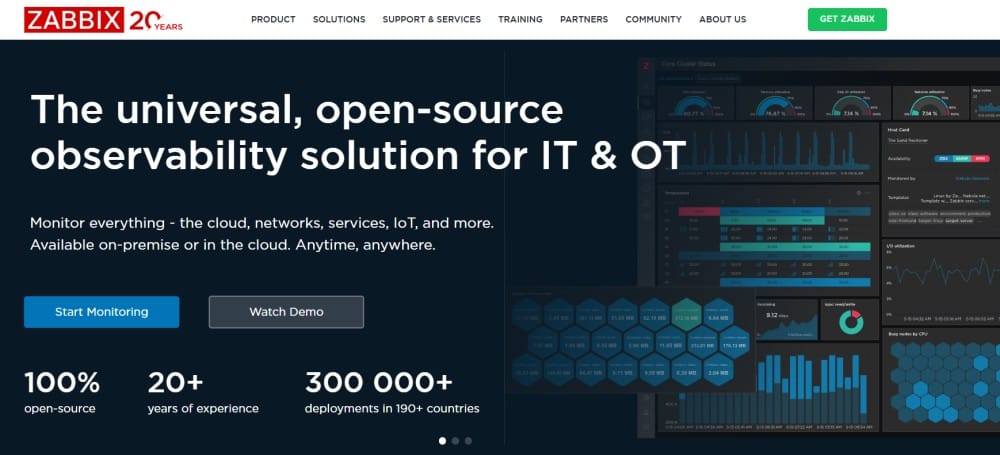
Zabbix is a long-established, open-source monitoring solution focused on traditional IT infrastructure, including servers, networks, databases, and hardware-level metrics. It supports both agent-based and agentless monitoring, offering powerful control through SNMP, IPMI, and custom triggers, making it a strong fit for organizations that prioritize self-hosting, data ownership, and protocol-level visibility.
Standout Features
- Flexible Configuration Engine: Offers powerful customization using templates, triggers, macros, and pre-defined checks—ideal for complex enterprise environments.
- Agentless Monitoring Capabilities: Monitors systems using standard protocols like SNMP, HTTP, SSH, and ICMP, eliminating the need for agents in some use cases.
- Granular Alerting & Escalation: Allows tailored incident workflows and escalation logic through custom actions and user roles.
- Automated Network Discovery: Scans predefined IP ranges or cloud environments to auto-detect new hosts, reducing manual setup in dynamic infrastructures.
Key Features
- Time-Series Data Storage: Collects and stores telemetry data over time, enabling trend analysis and long-term performance forecasting.
- Built-in Visual Monitoring: Supports custom dashboards, heatmaps, topology maps, and graphs for real-time infrastructure visibility.
- Webhook & API Integration: Offers JSON-RPC APIs and webhook support for connecting with external systems and automation tools.
- Low-Level Discovery (LLD): Dynamically identifies interfaces, filesystems, and services without manual input.
- Threshold Macros & Logic: Enables the use of complex conditions and reusable macros to fine-tune alerting logic.
- Role-Based Access Control: Designed to support large teams with user groups, granular permissions, and multi-tenant isolation.
Pros
- Free to use under a fully open-source license
- Excellent protocol-level monitoring (SNMP, IPMI, etc.)
- Supports agentless monitoring across diverse endpoints
- Highly configurable for infrastructure-heavy teams
- On-prem deployment allows full control over data and architecture
Cons
- Steep learning curve
- Technical setup complexity
- No support for OTEL yet
Best for
Zabbix is ideal for infrastructure-focused teams with strong system administration experience who need granular control over monitoring logic and deployment. It’s particularly suited for compliance-restricted or air-gapped environments, where open-source tooling, agentless monitoring, and full data sovereignty are top priorities.
Pricing & Customer Reviews
- Free: Fully open-source and free to use under the GPL license
- Zabbix Cloud: Starts from $50/month
- G2 rating: 4.3/5
- Praised for: high customization, extensive protocol support, and zero licensing cost
- Criticized for: Lack of OTEL support, setup complexity
Zabbix vs ManageEngine Site24x7
While both tools offer infrastructure monitoring, Zabbix emphasizes control, customization, and protocol-level access in a self-hosted environment. Site24x7, on the other hand, delivers more out-of-the-box observability, easier onboarding, and cloud-native integrations. For enterprises needing a no-cost, on-prem, SNMP-heavy solution with deep customization, Zabbix is a powerful alternative to Site24x7.
7. LogicMonitor
Known for
LogicMonitor is a hybrid SaaS observability platform known for its strong infrastructure monitoring capabilities, automated asset discovery, and real-time anomaly detection powered by AI. It’s widely adopted by mid-to-large enterprises and MSPs that require full-stack visibility across data centers, public cloud, containers, and on-prem environments—all unified within a single interface.
Standout Features
- Automated Hybrid Asset Discovery: Uses lightweight collectors to automatically detect devices, cloud services, and network endpoints across hybrid setups without manual input.
- AI-Powered Correlation Engine: LogicMonitor’s AI system groups related alerts, suppresses noise, and identifies root causes using pattern-based correlation models.
- Unified Observability Dashboards: Telemetry from infrastructure, applications, cloud, and network sources is brought into one customizable visual layer.
- Modular Monitoring Approach: Allows teams to pick specific modules—like logs, apps, or databases—based on their operational scope and needs.
Key Features
- End-to-End MELT Support: Brings together metrics, events, logs, traces, RUM, and synthetic tests with shared metadata and alert pipelines.
- Real-Time Dashboards & Performance Baselines: Offers dynamic data visualizations and automatic baseline generation to detect deviations early.
- Predictive Intelligence: Employs machine learning to forecast anomalies, detect performance drift, and reduce false alarms.
- RBAC & Role-Based Dashboards: Supports team-specific dashboards, access layers, and reporting tied to organizational roles.
- Extensive Integration Ecosystem: Offers 3,000+ integrations with public cloud, hardware vendors, and middleware providers for broad compatibility.
Pros
- Strong marks for ease of setup and multicloud visibility
- AI-backed alerting significantly reduces operational noise
- Modular licensing supports tailored observability coverage
- Well-suited for hybrid environments with legacy and modern workloads
- Broad integration catalog simplifies vendor interoperability
Cons
- UI issues
- Setup complexity
Best for
LogicMonitor is an excellent fit for platform and operations teams in mid-to-large enterprises or MSPs that manage mixed workloads across on-prem and multicloud environments. It’s especially useful for organizations looking for automated discovery, intelligent alerting, and flexible telemetry options.
Pricing & Customer Reviews
- Infrastructure & Network Monitoring: $12/host/month
- Application Monitoring: $27.50/app/month
- Log Ingestion: $5/GB/month
- Database Monitoring: $70 per DB instance/month
- Synthetic Checks: $10 per 10 tests/month
- G2 rating: 4.5/5 (500+ reviews)
- Praised for: Unified hybrid monitoring, AI-enhanced alerting, and flexibility through modular licensing
- Criticized for: Price scaling issues, complex onboarding, and variable support responsiveness
LogicMonitor vs ManageEngine Site24x7
While Site24x7 offers a plug-and-play approach to IT monitoring with a simpler cost structure, LogicMonitor delivers more powerful capabilities in hybrid observability, AI-driven alerting, and modular deployment. LogicMonitor is more suitable for enterprises needing automation at scale, while Site24x7 remains easier to manage for smaller teams seeking uptime and availability metrics.
Conclusion: The Best Alternatives to ManageEngine Site24x7
ManageEngine Site24x7 offers broad monitoring capabilities, but it comes with certain limitations, such as a learning curve, expensive pricing, and deployment flexibility.
CubeAPM addresses these challenges with fully self-hosted or on-premise deployments and cost-effective pricing of just $0.15/GB of ingested data. It enables organizations in regulated industries to meet data residency and compliance needs. With Slack-native support, zero egress fees, and an intuitive interface, CubeAPM is an excellent observability solution.
Book a free demo to explore CubeAPM.
Disclaimer: The information in this article reflects the latest details available at the time of publication and may change as technologies and products evolve.
FAQs
1. What are the best alternatives to ManageEngine Site24x7?
Some of the top Site24x7 alternatives include CubeAPM, Datadog, Dynatrace, New Relic, Splunk AppDynamics, Zabbix, and LogicMonitor.
2. Why are teams moving away from Site24x7?
Many teams are switching from Site24x7 due to billing complexity, SaaS-only deployment, and a learning curve.
3. Is there a self-hosted alternative to ManageEngine Site24x7?
Yes, tools like CubeAPM offer self-hosting options. CubeAPM, in particular, provides deployment flexibility in customers’ on-premise or cloud environments, making it ideal for regulated industries or teams with strict data residency needs.
4. Which Site24x7 alternative offers the best cost-efficiency?
CubeAPM is the most cost-efficient alternative, offering usage-based pricing starting at $0.15/GB for full MELT telemetry, including infra, logs, RUM, synthetics, and trace, without per-host or per-plugin add-ons.
5. Does CubeAPM support all the features provided by Site24x7?
CubeAPM covers all core Site24x7 features like infrastructure monitoring, synthetics, RUM, and alerting, along with smart trace sampling, real-time dashboards, and Slack-native support.


