Redis Monitoring tools are essential today as applications demand real-time responsiveness and zero downtime. Redis ranks as the #1 key-value store on DB-Engines, so tracking latency, cache hit ratio, and memory usage is now mission-critical.
Yet choosing the right Redis monitoring tools is challenging. Teams face issues like unpredictable costs, limited metric granularity, replication lag visibility, and compliance gaps. Over 70% of Redis deployment failures stem from weak monitoring or alerting gaps.
CubeAPM is the best Redis Monitoring tool provider, offering real-time dashboards, anomaly detection, OpenTelemetry integration, and compliance-ready deployments. Its transparent pricing ensures predictable costs without vendor lock-in. In this article, we’ll explore the top Redis monitoring tools to help you choose the right one for your needs.
Top 8 Redis Monitoring Tools
- CubeAPM
- Datadog
- New Relic
- Dynatrace
- SolarWinds Observability SaaS
- Site24x7
- OpsDash
- Prometheus + redis_exporter (with Grafana)
What is a Redis Monitoring Tool?
A Redis monitoring tool is software that tracks the health, performance, and reliability of Redis instances by collecting metrics, logs, and traces in real time. It gives engineers visibility into latency, memory usage, replication lag, cache hit ratio, and error rates—ensuring Redis can handle mission-critical workloads without hidden bottlenecks.
For modern businesses, this visibility translates directly into fewer outages, better customer experiences, and lower infrastructure costs. Redis monitoring tools are critical because they:
- Detect performance issues early: Spot latency spikes, slow commands, or growing memory pressure before they affect users.
- Optimize infrastructure spend: Identify underutilized resources and prevent costly over-provisioning.
- Improve reliability and SLAs: Monitor replication lag and failover readiness to maintain uptime.
- Support compliance and governance: Track data residency, access patterns, and audit logs for GDPR, HIPAA, or DPDP compliance.
- Enable faster troubleshooting: Correlate Redis metrics with application traces, infrastructure signals, and logs for root-cause analysis.
By combining deep Redis-specific insights with full-stack observability, these tools help businesses build resilient, high-performing systems at scale.
Example: Monitoring Redis Latency with CubeAPM
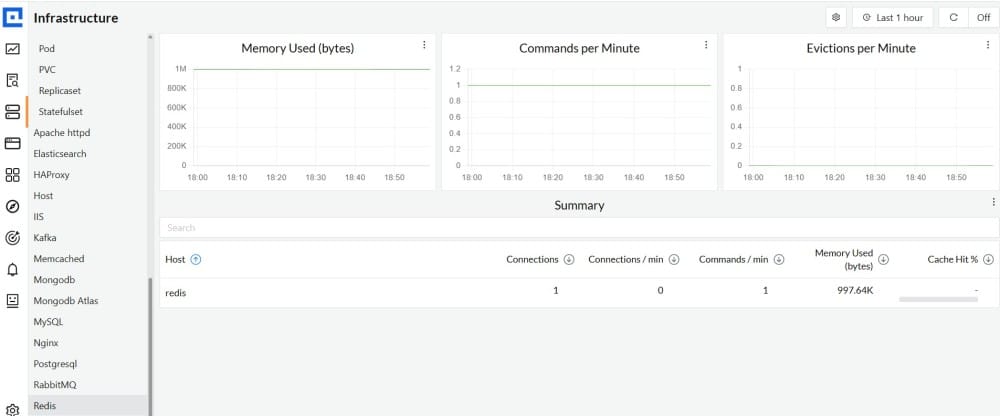
With CubeAPM, teams can monitor Redis latency across clusters in real time. Using OpenTelemetry-native agents and smart sampling, CubeAPM captures request traces whenever latency or error thresholds are crossed. These traces are correlated with Redis logs and infrastructure metrics to highlight whether the slowdown originates from memory fragmentation, network I/O, or application code.
Engineers can then drill down into dashboards on the CubeAPM Playground to visualize patterns, set proactive alert rules, and resolve issues before they escalate into downtime.
Why teams choose different Redis Monitoring tools
Cost predictability at Redis scale
Redis clusters scale fast, and ingestion-based or host-based pricing quickly becomes unpredictable. Many teams report bill shock when monitoring large keyspaces, traffic spikes, or multi-region replicas, especially when hidden charges for logs or data transfer are involved.
OpenTelemetry-first instrumentation
Modern teams prefer Redis monitoring tools that natively support OpenTelemetry semantic conventions for commands, namespaces, and peer details. This avoids lock-in, reduces agent overhead, and ensures Redis traces can be exported to any backend without costly re-instrumentation.
Strong Redis–app–infra correlation
Problems often hide across layers: Redis may look healthy, yet latency spikes from slowlog events, replication lag, or memory fragmentation affect apps. The best tools tie Redis metrics with service traces and infrastructure signals to pinpoint root causes quickly.
Deployment models & compliance needs
Some organizations must monitor Redis in multi-cloud, on-prem, or BYOC setups while keeping observability data in-region for GDPR, HIPAA, or India DPDP. Tools that allow flexible hosting and data residency controls are preferred by regulated industries.
Redis-aware alerting & noise reduction
Generic host alerts don’t cut it. Teams want Redis-specific rules like P99 latency by command, eviction rates, replication backlog, and consumer lag. Tools that baseline these metrics and cut false positives improve reliability without overwhelming engineers.
Top 9 Redis Monitoring Tools
1. CubeAPM
Overview
CubeAPM has quickly established itself as a leading observability platform for Redis and other critical workloads. Known for its OpenTelemetry-native design and transparent pricing, it’s gaining traction among engineering teams who want full-stack monitoring without unpredictable vendor bills. Its strength lies in correlating Redis performance with infrastructure, logs, and traces, making it a trusted choice for enterprises scaling complex Redis deployments.
Key Advantage
Deep Redis observability with real-time correlation across latency, memory, and replication metrics.
Key Features
- Redis Latency Tracking: Monitors command response times and slowlog events for early bottleneck detection.
- Memory Utilization & Fragmentation: Tracks usage trends and fragmentation ratios to prevent out-of-memory risks.
- Replication & Failover Health: Keeps visibility on replication lag and failover readiness in clustered Redis setups.
- Cache Hit Ratio & Keyspace Growth: Identifies patterns in hits/misses and monitors keyspace changes over time.
- Integrated Alerts: Redis-aware alert rules like eviction spikes, blocked clients, and command timeouts.
Pros
- Simple and transparent pricing
- OpenTelemetry-first architecture
- Strong support for compliance and data residency
- Direct and responsive support channels
Cons
- Not ideal for teams that require fully off-prem monitoring
- Focused on observability only, lacks broader cloud security features
CubeAPM Pricing at Scale
CubeAPM uses a transparent pricing model of $0.15 per GB ingested. For a mid-sized business generating 45 TB (~45,000 GB) of data per month, the monthly cost would be ~$7,200/month.
*All pricing comparisons are calculated using standardized Small/Medium/Large team profiles defined in our internal benchmarking sheet, based on fixed log, metrics, trace, and retention assumptions. Actual pricing may vary by usage, region, and plan structure. Please confirm current pricing with each vendor.
Tech Fit
CubeAPM is well-suited for Redis deployments on Kubernetes, cloud VMs, or on-prem servers. It supports major languages and frameworks like Java, Python, Node.js, Go, and .NET, making it flexible for modern microservice environments.
2. Datadog
Overview
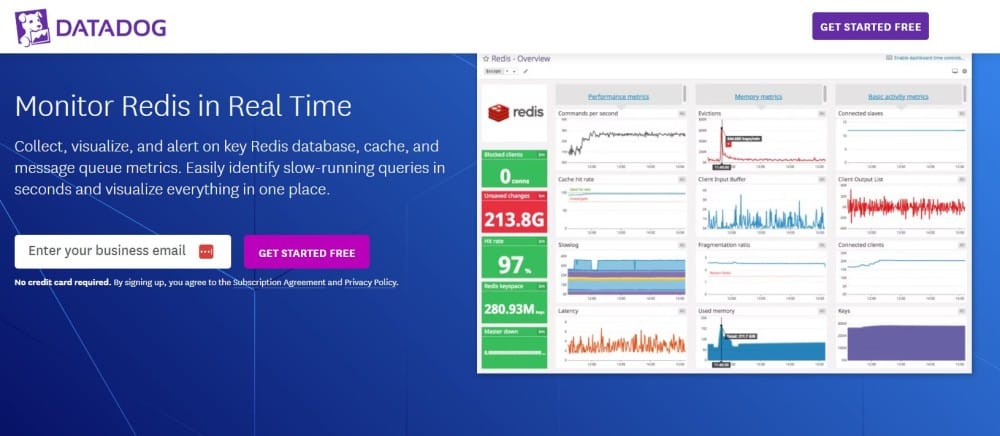
Datadog is a well-known enterprise observability platform with mature Redis integrations, ready-made dashboards, and support for Redis Enterprise and Redis Cloud. Teams pick it for broad correlation—Redis metrics, logs, and APM traces in one place—plus out-of-the-box views for latency, memory, and replication health across clusters and ElastiCache.
Key Advantage
Unified Redis monitoring with first-party dashboards and agents that correlate Redis metrics, logs, and traces across your stack.
Key Features
- Latency & SLOWLOG visibility: Track command latency, blocked clients, and slowlog events to catch hotspots early.
- Memory & fragmentation tracking: Monitor used memory, fragmentation ratio, evictions, and expirations to avoid OOM churn.
- Replication & persistence health: Watch replica lag, connection counts, AOF/RDB behavior, and disk I/O signals.
- Managed Redis coverage: Prebuilt dashboards for Redis Enterprise and AWS ElastiCache Redis.
- Correlation with APM & logs: Tie Redis anomalies to service traces and application logs for faster root cause analysis.
Pros
- Broad ecosystem with 850+ integrations and mature Redis dashboards
- Good support for Redis Enterprise and Redis Cloud pipelines
- Strong correlation across infra, APM, logs, and synthetics
- Enterprise features and role-based access controls
Cons
- Pricing complexity across hosts, logs, spans, and database monitoring SKUs
- SaaS-only; no self-hosting
Datadog Pricing at Scale
Datadog charges differently for different capabilities. APM starts at $31/month; infra starts at $15/month; logs start at $0.10/GB, and so on. For a mid-sized business ingesting around 45 TB (~45,000 GB) of data per month, the cost would come around $27,475/month.
Tech Fit
Strong fit for Kubernetes and cloud VM fleets running Redis (OSS, Redis Enterprise, or ElastiCache) and services in Java, .NET, Node.js, Python, Go—where correlating Redis metrics with distributed traces and logs matters most.
3. New Relic

Overview
New Relic offers mature Redis monitoring through native host integrations, Prometheus/OpenTelemetry quickstarts, and dedicated coverage for Redis Enterprise and cloud variants. Teams choose it for the unified view of Redis health alongside app traces, logs, infrastructure, and cloud services—plus prebuilt dashboards and starter alerts that shorten time to value.
Key Advantage
Comprehensive Redis coverage with quickstarts and integrations that surface latency, memory, and replication issues in one place.
Key Features
- Native Redis integration: Collects INFO metrics, inventory, key length samples, blocked clients, and command activity for dashboards and alerts.
- Redis Enterprise & managed Redis: First-party integrations for Redis Enterprise, Redis Cloud, and Azure/AWS managed services with purpose-built dashboards.
- Prometheus & OpenTelemetry paths: Supports Redis exporters and OTel telemetry so you can standardize pipelines without agent sprawl.
- Latency & SLOWLOG insight: Tracks command-level latency, slowlog events, and connection spikes to find hotspots quickly.
- Replication & persistence monitoring: Watches replica lag, AOF/RDB behavior, and disk I/O signals to prevent data loss or failover surprises.
Pros
- Wide ecosystem with strong Redis quickstarts and starter alerts
- Good correlation across APM, logs, infra, and synthetics
- Multiple ingestion paths: agent, Prometheus, OpenTelemetry
- Enterprise-grade RBAC and governance features
Cons
- Data ingest pricing can grow quickly at high volumes
- SaaS-first model; no on-prem/self-hosting option
New Relic Pricing at Scale
New Relic’s billing is based on data ingested, user licenses, and optional add-ons. The free tier offers 100 GB of ingest per month, then it costs $0.40 per GB after that. For a business ingesting 45 TB of logs per month, the cost would come around $25,990/month.
Tech Fit
Well-suited for teams running Redis on Kubernetes, cloud VMs, Redis Enterprise/Cloud, or ElastiCache, and services in Java, .NET, Node.js, Python, and Go—especially where pairing Redis signals with distributed traces and logs is essential.
4. Dynatrace
Overview
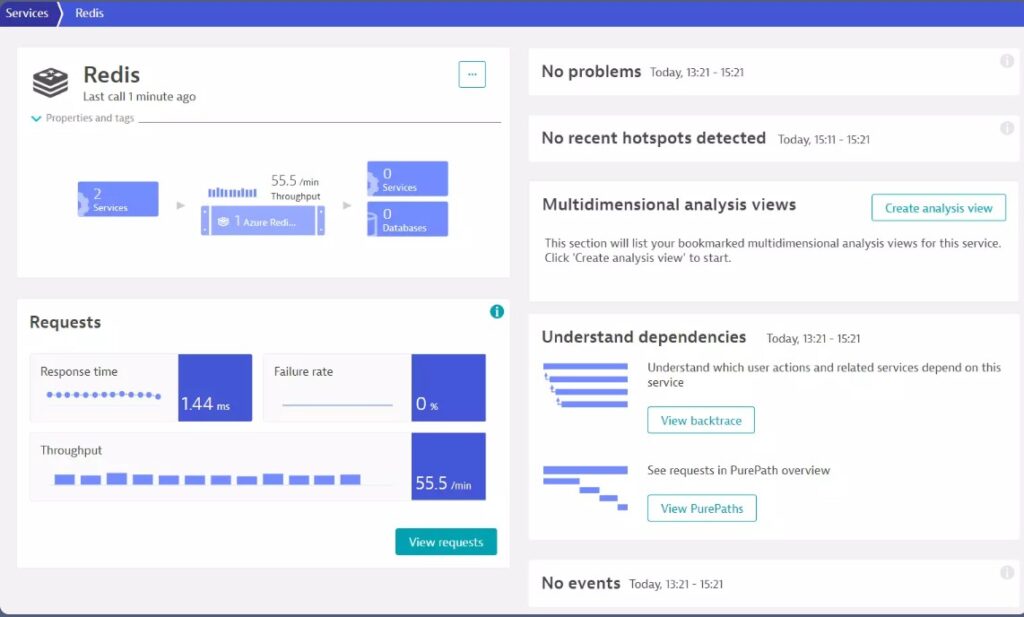
Dynatrace provides deep Redis visibility via native extensions and cloud integrations, tying Redis health to service traces, infrastructure signals, and logs. It automatically maps app-to-Redis dependencies and surfaces issues like latency spikes, memory fragmentation, and replication lag with AI-assisted analysis—useful in large, distributed environments.
Key Advantage
Automatic end-to-end tracing and Redis-aware metrics in one place, including command-level insights and managed-service coverage.
Key Features
- Command-level visibility: Traces down to individual Redis commands to pinpoint slow paths and blocked clients.
- Core Redis metrics: Monitors response time, cache hit ratio, memory fragmentation, connections, hits/misses, and more.
- Redis Enterprise & Redis Cloud: Integrates via Prometheus remote write with vendor-designed dashboards for enterprise/managed clusters.
- Cloud cache coverage: Ingests Azure Cache for Redis metrics for unified dashboards and alerting.
- AI-assisted anomaly detection: Correlates Redis symptoms with service and infra changes to accelerate root cause.
Pros
- Strong auto-discovery and topology mapping for complex estates
- Command-level tracing plus rich Redis metrics
- Works across OSS Redis, Redis Enterprise, Redis Cloud, and Azure Cache
- Mature analytics and governance for large teams
Cons
- Pricing spans multiple dimensions (ingest, retention, query), and can be hard to predict
- Steep learning curve
Dynatrace Pricing at Scale
- Full stack: $0.01/8 GiB hour/month or $58/month/8GiB host
- Log Ingest & process: $0.20 per GiB
For a similar 45 TB (~45,000 GB/month) volume, the cost would be $21,850/month.
Tech Fit
Best for enterprises running Redis across Kubernetes, VMs, and managed offerings (Redis Enterprise, Redis Cloud, Azure Cache) that need AI-assisted correlation and command-level tracing alongside standard Redis KPIs.
5. SolarWinds Observability (SaaS)
Overview
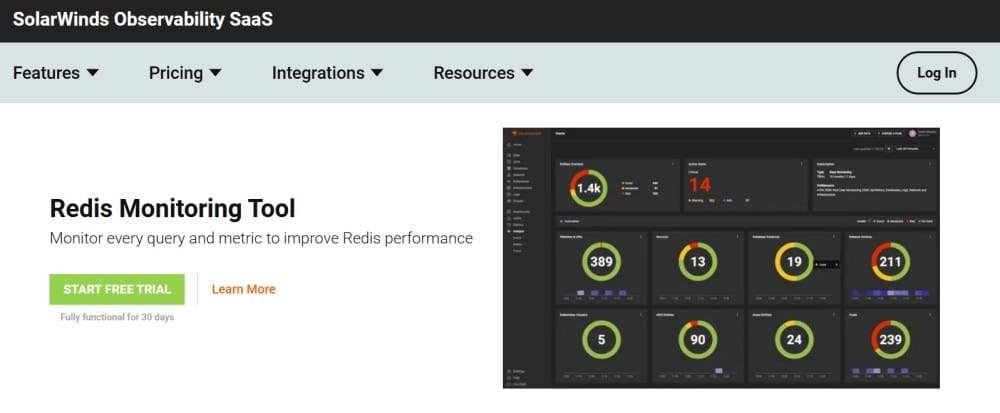
SolarWinds Observability provides Redis visibility through two paths: a Redis integration collected by the Observability Agent, and Database Observability for Redis (instance-level monitoring). Teams use it to watch latency, memory, connections, and keyspace trends, and to bring managed cloud signals (like ElastiCache or Azure Cache for Redis) alongside host metrics for a unified view.
Key Advantage
Modular platform that combines infrastructure, logs, and database observability—so Redis metrics, dashboards, and alerts can live in one place.
Key Features
- Redis agent integration: Configure the Redis integration on a host with the Observability Agent to collect core metrics and populate dashboards.
- Database Observability for Redis: Add Redis as a “database instance” for deeper instance-level analysis and troubleshooting.
- Managed Redis coverage: Pull ElastiCache/Azure Cache metrics via cloud integrations for cross-service dashboards and alerting.
- Prebuilt widgets & explorers: Redis metrics show up as widgets in prebuilt/custom dashboards and the Metrics Explorer.
- Alerting: Create alerts when Redis entity metrics move out of expected ranges (e.g., connections, CPU, memory).
Pros
- Unified SaaS with separate modules for infra, logs, DB, and synthetics
- Straightforward setup flow for Redis via agent or database instance
- Cloud integrations bring ElastiCache/Azure metrics into the same UI
- Pricing page lists module starting rates clearly
Cons
- Logs are priced per GB and can be expensive for log-heavy estates
- Learning curve
- Integration issues
SolarWinds Observability Pricing at Scale
SolarWinds Observability charges $5 per GB of logs, $12 per host per month for infra, $27.5 per service for APM, and $70 for database observability. For a mid-sized company, the cost for APM and infra would be:
APM: $27.5 x 125 (hosts) = $3,437.5
Infra: $12 x 200 (hosts) = $2,400
Database Observability: 4 × $70 = $280
So, the total is above $5,000/month.
Tech Fit
A good fit for teams standardizing on SolarWinds who need Redis alongside network, host, and application views—particularly self-hosted Redis on VMs or Kubernetes, with managed variants (ElastiCache/Azure Cache) observed via cloud metrics.
6. Site24x7

Overview
Site24x7 offers Redis monitoring via a lightweight Server Monitoring plugin that collects core Redis KPIs and visualizes them in dashboards, with alerts on breaching metrics. Teams use it to keep tabs on latency, memory, keyspace changes, and connections, and to fold Redis signals into broader infra/app visibility.
Key Advantage
Quick, plugin-based Redis visibility bundled with Site24x7 Server Monitoring—easy to roll out across many hosts.
Key Features
- Core Redis KPIs: Track used memory, connected clients, total commands, keyspace hits/misses, and evictions for health baselining.
- Latency & SLOWLOG signals: Surface performance regressions through command activity and error/blocked client indicators.
- Replication visibility: Monitor role, replica lag clues, and persistence indicators (AOF/RDB) to avoid failover surprises.
- Dashboards & alerts: Out-of-the-box charts, custom thresholds, and notifications for Redis plugin metrics.
- Simple setup: Install the Site24x7 agent, enable the Redis plugin, and start streaming metrics to the dashboard.
Pros
- Plugin included with Server Monitoring
- Straightforward rollout across many hosts
- Good coverage of must-watch Redis metrics
- Fits neatly into Site24x7’s broader SaaS stack
Cons
- Alert issues
- Learning curve
Site24x7 Pricing at Scale
Site24x7’s Professional plan ($42/month, paid annually) may suit mid-sized companies, but may quickly outgrow the base bundle once they need dozens of APIs, private endpoints, or extra ingestion. Also, the Enterprise tier costs $625/month (annually), which could be high for many teams.
Tech Fit
Best for teams already standardizing on Site24x7 who want plugin-based Redis metrics alongside website, server, and network monitoring—especially VM or Kubernetes estates where a SaaS agent model is preferred.
7. OpsDash
Overview
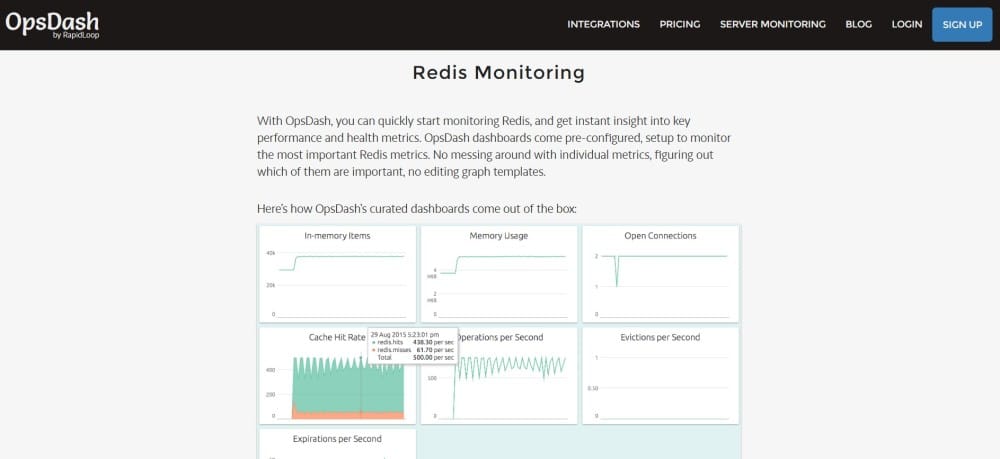
OpsDash is a lightweight, self-hosted monitoring platform with a prebuilt Redis integration and “smart agent” that ships Redis dashboards and alerts out of the box. Teams like it for simple setup, low overhead, and a clean focus on core Redis health—latency, memory, keyspace, and command activity—without a sprawling SaaS footprint.
Key Advantage
Straightforward, self-hosted Redis monitoring with preconfigured dashboards and spam-free alerting that you can roll out quickly.
Key Features
- Agent-based Redis integration: Configure the OpsDash Smart Agent to discover Redis and start sending metrics to built-in dashboards.
- Command & client visibility: Track commands processed, blocked/connected clients, and error conditions for early performance signals.
- Keyspace & cache efficacy: Monitor keyspace size, hits/misses, and evictions to validate cache behavior and capacity.
- Alerting & notifications: Set warning/critical thresholds and notify via Slack, PagerDuty, OpsGenie, and webhooks.
Pros
- Simple, fast deployment with minimal overhead
- Opinionated, ready dashboards for Redis
- Self-hosted model for tighter control
- Integrations for common on-call tools
Cons
- Limited deep analytics and correlation versus full-stack observability suites
OpsDash Pricing at Scale
OpsDash licenses the self-hosted edition per server (Standard plan) rather than per-GB ingest. For example, monitoring 20 servers would be $20/month in license fees. However, if your organization ingests 45 TB/month of telemetry (metrics/logs/traces), you’ll need separate infrastructure for high-volume log/trace storage and search; these costs aren’t included in OpsDash and vary widely by stack.
Tech Fit
A good match for Linux VMs or Kubernetes, where teams prefer self-hosting and want a focused Redis metrics+alerts setup; pairs well with external systems for logs/traces if you later need deeper correlation.
8. Prometheus + redis_exporter (with Grafana)
Overview
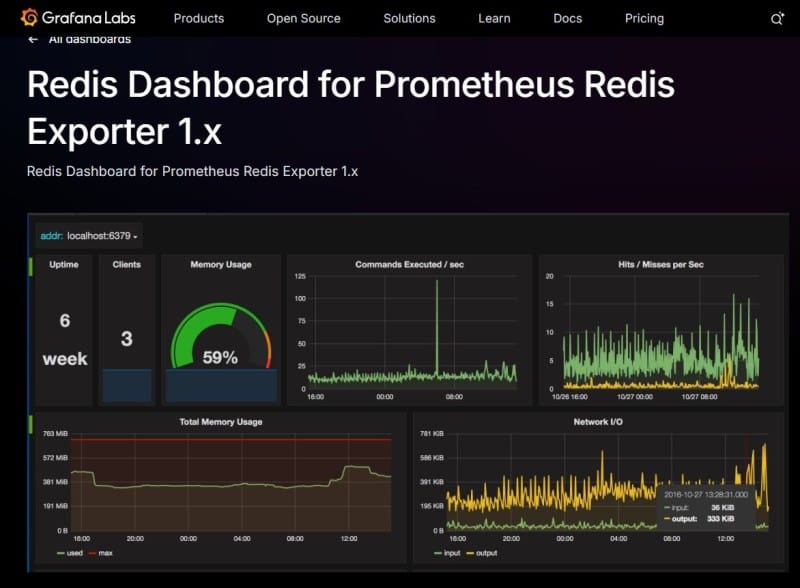
Prometheus plus the redis_exporter is the de facto open-source stack for Redis metrics: the exporter exposes most INFO fields (latency, ops/sec, memory, keyspace, replication, persistence), Prometheus scrapes them, and Grafana renders production-ready dashboards with alert rules. Teams like it for control, transparency, and a huge community ecosystem.
Key Advantage
Vendor-neutral Redis monitoring that you can run anywhere—with mature, community-maintained dashboards and alerting.
Key Features
- Redis command & latency panels: Track ops/sec, P95/P99 latency, blocked clients, and SLOWLOG-driven hotspots for early detection.
- Memory & fragmentation: Visualize used memory, maxmemory, eviction/expiration rates, and fragmentation ratios to prevent OOM churn.
- Replication & persistence: Monitor replica lag, sync/backlog, AOF/RDB activity, and fork stalls to protect durability.
- Dashboards & rules library: Import battle-tested Grafana dashboards and recording/alerting rules in minutes.
- Agent & cloud paths: Run exporter locally or via Grafana Agent; optionally ship to Grafana Cloud for hosted storage/query.
Pros
- Open source, vendor-neutral, highly customizable
- Large ecosystem of Redis dashboards and rules
- Works on any Linux/Kubernetes/VM setup
- Easy to pair with the existing Prometheus stack
Cons
- You operate and scale Prometheus, storage, and alerting yourself
- Tuning cardinality and alert thresholds takes SRE expertise
- Grafana Cloud usage can add cost for high-volume ingest
Grafana Cloud Pricing at Scale
If you self-host Prometheus/Grafana, there’s no license—your costs are infra and ops time. If you choose Grafana Cloud, pricing is transparent and usage-based (Pro plan adds a $19/month platform fee). Key list prices: Metrics at $6.50 per 1k active series, Logs/Traces/Profiles at $0.50 per GB ingested; Kubernetes Monitoring beyond the included free usage is $0.015 per host hour and $0.001 per container hour. The free tier includes helpful allowances (e.g., 10k series, 50 GB logs/traces/profiles, 2,232 host hours, 37,944 container hours).
For the mid-sized scenario of 45 TB data ingestion, teams may have to pay $11,875/month.
Tech Fit
Ideal for teams comfortable running Prometheus/Grafana who want maximum control and OSS flexibility, or those standardizing on Grafana Cloud and needing proven Redis dashboards and rules. Works across Kubernetes, VMs, and managed Redis footprints.
How to choose the right Redis Monitoring Tools
Match tool capabilities to your Redis workload
If you use Redis primarily as a cache vs. a primary datastore, your monitoring priorities differ. Caching requires close tracking of hit/miss rates, eviction counts, and TTL behavior, while persistence-heavy deployments demand visibility into AOF/RDB lag, replication health, and data durability.
Scalability & performance of monitoring itself
Redis deployments can span many shards and replicas, with traffic surges that generate thousands of operations per second. A good tool must handle these spikes without adding overhead or introducing monitoring latency that distorts results.
Integration with the existing observability stack
The right Redis monitoring solution should connect seamlessly with your logging, metrics, and tracing pipelines. Correlating Redis command latency with application traces and infrastructure signals helps identify whether issues stem from Redis itself, the network, or the client side.
Alerting & baseline behavior that’s Redis-aware
Generic CPU or host alerts are not enough. Teams need Redis-aware rules such as latency percentiles by command type, replication backlog thresholds, eviction spikes, and memory fragmentation ratios. Baseline learning reduces false positives and ensures alerts reflect real service impact.
Ease of setup, operability & visibility
Tools that provide pre-built dashboards, Redis INFO integration, and slowlog visualization save engineers time. Simple configuration, clear data presentation, and automated correlation of metrics, logs, and traces are decisive for enterprise adoption.
Data residency, deployment model & compliance
Enterprises often run Redis in multi-cloud, on-prem, or regulated environments. The chosen monitoring tool should support flexible deployment, enforce access controls, and ensure observability data can stay within required regions to meet GDPR, HIPAA, or DPDP standards.
Conclusion
Choosing the right Redis monitoring tool is often harder than it looks. Teams struggle with unpredictable pricing, noisy or generic alerts, a lack of deep Redis-specific visibility, and tools that don’t scale smoothly across cloud and on-prem setups. These pain points lead to wasted spend and blind spots that can cause costly downtime.
CubeAPM solves these challenges with transparent $0.15/GB pricing, Redis-aware dashboards, and smart sampling that ensures critical metrics and traces are always retained. It integrates seamlessly with Kubernetes, VMs, and managed Redis services, while keeping compliance and data residency needs in check.
If you’re looking for a reliable, cost-effective way to monitor Redis, CubeAPM is your best choice. Book a free demo today and see how top teams gain clarity, control, and cost savings with CubeAPM.
Disclaimer: The information in this article reflects the latest details available at the time of publication and may change as technologies and products evolve.
FAQs
1. What should I look for in a Redis monitoring tool beyond basic metrics?
Beyond CPU and memory, look for latency per command, replication lag, eviction/expiration rates, blocked clients, and persistence health (AOF/RDB). These Redis-specific KPIs help prevent outages.
2. Are open-source Redis monitoring tools enough for production use?
Open-source tools like Prometheus with redis_exporter provide great visibility, but at scale, you’ll also need alert management, long-term retention, and log/trace correlation. That’s where platforms like CubeAPM become essential.
3. How do Redis monitoring tools handle cloud-managed services like AWS ElastiCache or Azure Cache?
Most monitoring tools can ingest metrics from managed Redis using APIs or exporters. Enterprise platforms such as CubeAPM and Dynatrace extend this with correlation to app traces and infrastructure for deeper insights.
4. Can Redis monitoring tools help with compliance requirements?
Yes, tools that support complinace regulations, and those that offer self-hosting options, such as. CubeAPM (BYOC/on-prem deployments), ensuring Redis telemetry stays within required regions.
5. How do I reduce noise from Redis monitoring alerts?
Choose tools that support Redis-aware alert rules (e.g., P95 latency by command, replication backlog, eviction spikes) and baseline learning. This cuts false positives and ensures alerts map to real business impact.


