Apache Kafka is the backbone of real-time data pipelines, but monitoring it is notoriously difficult. Teams battle consumer lag spikes and ISR/URP churn that can stall data flows. Add in KRaft migrations, MSK/Confluent quirks, and the rising cost of high-cardinality metrics, and most monitoring stacks fall short.
CubeAPM for Kafka monitoring provides dashboards that surface broker, topic, and consumer group health, including throughput and lag metrics. Combined with smart sampling and flat $0.15/GB ingestion pricing, CubeAPM delivers deep Kafka visibility at a predictable cost.
This guide ranks the top Kafka monitoring tools by depth of Kafka coverage, tracing, managed-Kafka fit, alert packs, deployment options, and real-world cost.
Top 9 Kafka Monitoring Tools
- CubeAPM
- Datadog
- New Relic
- Dynatrace
- Grafana Cloud
- Confluent Control Center
- Sematext
- Elastic Observability
- Lenses
What is Kafka Monitoring?
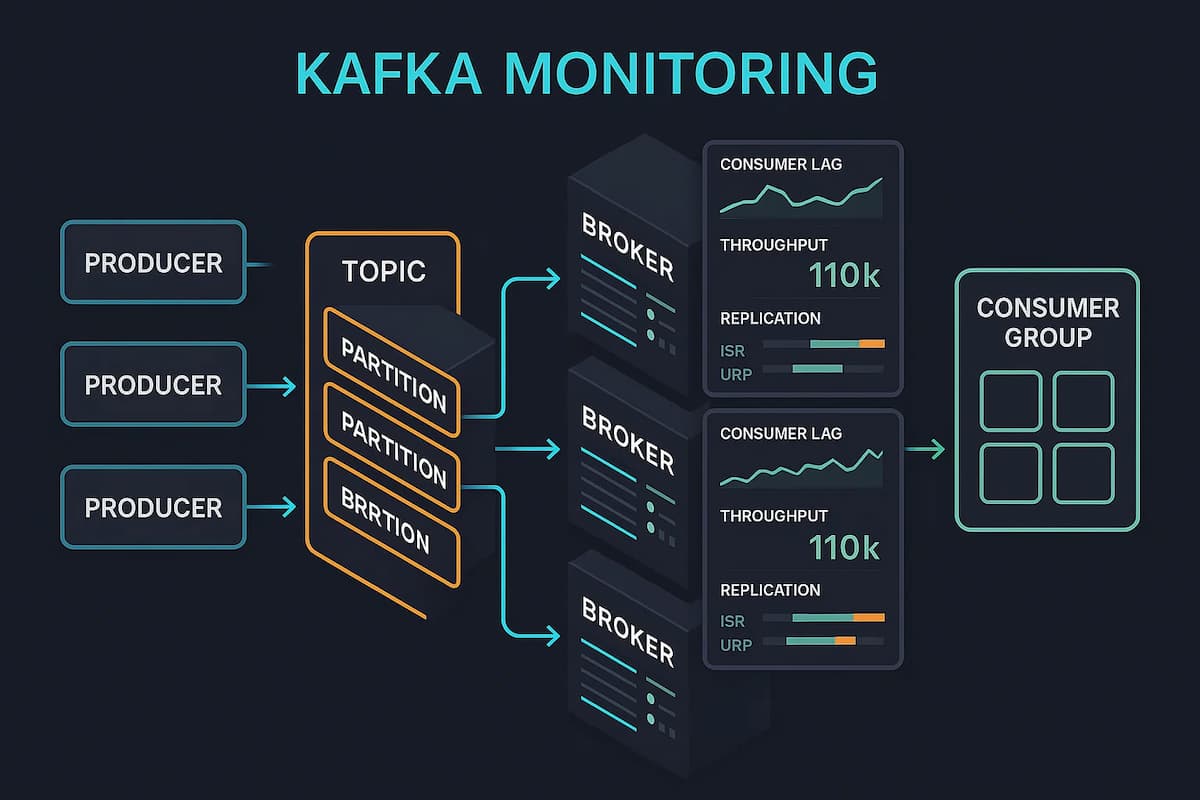
Kafka monitoring is the continuous collection, analysis, and alerting of broker, topic/partition, and client health and performance signals to keep event streams reliable and on budget. It goes beyond checking “is the cluster up?”—it verifies data delivery guarantees (replication and ISR), throughput and latency across topics, consumer-lag truth, and the health of the ecosystem services that surround Kafka.
At their core, Kafka monitoring tools help organizations:
- Verify replication safety by tracking in-sync replicas (ISR), under-replicated partitions (URPs), and unclean leader elections that threaten durability.
- Stay ahead of backlog risk with consumer lag measurement that works correctly during rebalances and provides backlog burn-down estimates.
- Uncover hidden bottlenecks by measuring producer retries, broker request latencies, partition skew, and controller election frequency.
- Correlate data end-to-end by linking Kafka metrics with application traces and client logs, so a lag spike can be tied to the exact service or deployment.
- Operate at scale without runaway cost through metric filtering, label hygiene, and trace sampling to control the high cardinality typical of Kafka estates.
- Adapt to new architectures like KRaft (ZooKeeper-less mode) by surfacing controller quorum health, epoch changes, and election latency.
Example: How CubeAPM Handles Kafka Monitoring
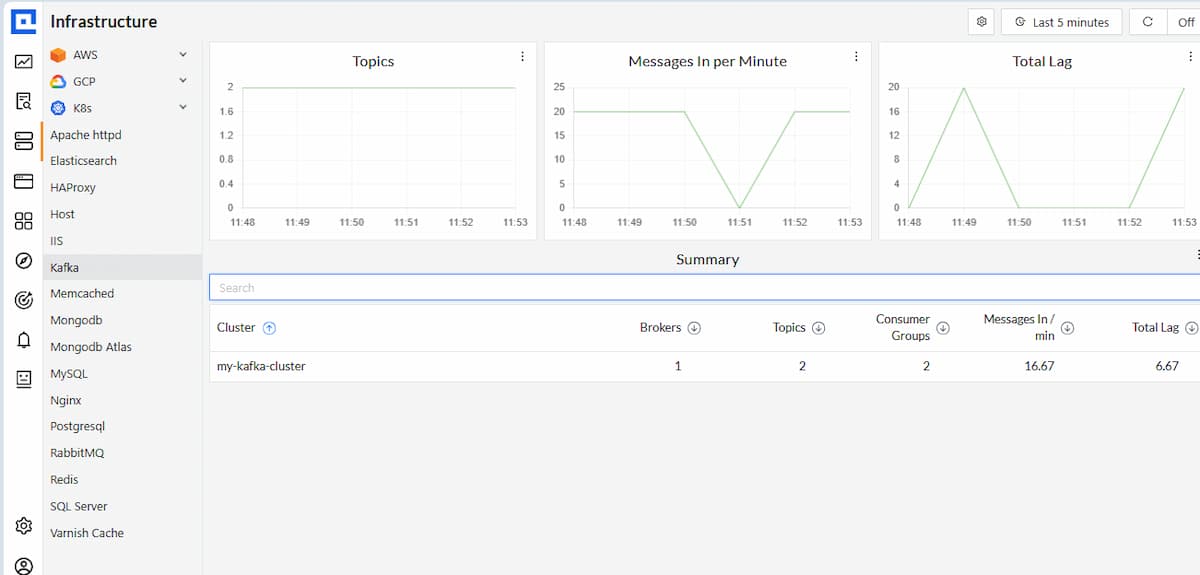
Unified Kafka overview. CubeAPM infrastructure monitoring presents real-time Kafka health in one place: topics and throughput (messages/bytes in), aggregate and per-group consumer lag, and a concise cluster summary (brokers, topics, consumer groups, ingest rate, total lag). From there, operators drill down to partition hotspots, leadership/ISR changes, and broker performance, then pivot into traces or logs to pinpoint the cause.
Signals CubeAPM collects and correlates (MELT).
- Cluster/Brokers: ISR/URP, offline partitions, unclean leader elections, active controller count, request latency percentiles, JVM/GC, and disk I/O.
- KRaft (ZooKeeper-less): controller quorum health, leader/epoch changes, election and commit latency, snapshot age/size.
- Topics/Partitions: messages/bytes in–out, partition skew and leader balance, compaction and segment health.
- Consumers/Producers: per-group/per-partition lag and offsets, lag trend and burn-down time, commit latency, rebalance count/duration, fetch/request latency, errors/retries, throttling.
- Ecosystem: Kafka Connect task state and failures, Schema Registry compatibility/mode changes, ksqlDB query status and latency.
- Correlation: OpenTelemetry distributed traces from producer → Kafka → consumer plus logs-in-context, so a spike in lag, ISR shrink, or request latency can be tied to an exact service and deployment.
Why teams look for better Kafka monitoring in 2025
1. “Lag truth” is hard
Consumer lag is often misstated during rebalances or offset races. Teams need windowed, threshold-less evaluation and burn-down time estimates rather than fixed thresholds.
2. Partial coverage beyond brokers
Many stacks watch broker JMX but miss Kafka Connect, Schema Registry, and ksqlDB. Engineering wants ready dashboards and alerts that cover the whole ecosystem.
3. KRaft changes what you watch
With ZooKeeper gone, controller quorum and election/commit latencies matter. Monitoring must surface leader/epoch changes and KRaft controller health.
4. End-to-end visibility, not just metrics
Root cause is faster when traces link producer → Kafka → consumer and align with logs and metrics using consistent conventions. This approach also supports enterprise monitoring, bringing Kafka into the same observability layer as core systems like databases, Kubernetes, and cloud services — so SREs and platform teams can troubleshoot holistically instead of juggling siloed tools.
5. Managed Kafka’s MSK/Confluent
Cloud platforms expose metrics with caveats that break naïve alerts. Tools must understand these quirks and ship sensible defaults.
Top 9 Kafka Monitoring Tools
1. CubeAPM
Known for
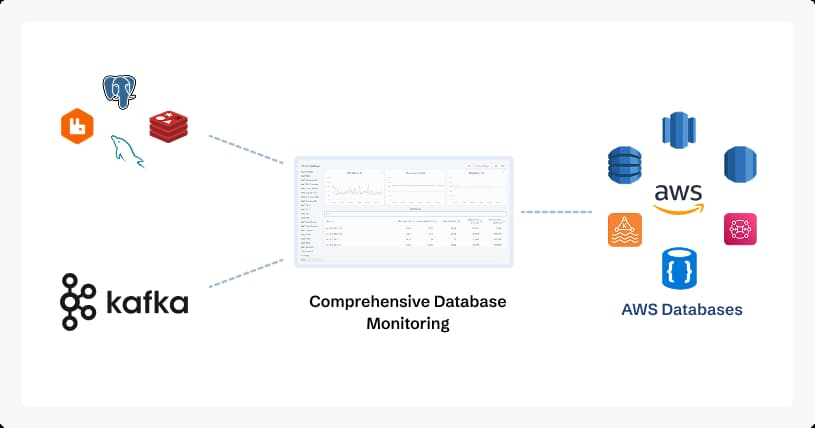
CubeAPM is known for being an OpenTelemetry-native observability platform built with Kafka-heavy pipelines in mind. With a self-host option and transparent $0.15/GB pricing, it’s designed for teams who need Kafka monitoring at scale without vendor lock-in or unpredictable billing.
Kafka Monitoring Features
- Brokers, topics/partitions, consumer groups/lag, ISR/URPs, leadership events, and KRaft controller health.
- Trend-aware lag with burn-down time.
- Coverage for Kafka Connect, Schema Registry, and ksqlDB.
Key Features
- Unified metrics, traces, logs, and errors with clean cross-signal pivots.
- Ready Kafka dashboards and alert packs; clear runbooks.
- MSK/Confluent-friendly onboarding; Kubernetes/Helm patterns; OTEL Collector pipelines.
Pros
- Deep Kafka + ecosystem coverage out of the box.
- End-to-end tracing producer → Kafka → consumer (OTEL).
- Self-host option for data residency/air-gapped.
- Smart sampling to keep trace cost predictable.
- Good cost guardrails (metric filters, label hygiene).
- Short, actionable runbooks attached to common Kafka alerts.
Cons
- Not suited for teams looking for off-prem solutions
- Strictly an observability platform and does not support cloud security management
Pricing
Ingestion-based pricing of $0.15/GB
CubeAPM Kafka Monitoring Pricing At Scale
*All pricing comparisons are calculated using standardized Small/Medium/Large team profiles defined in our internal benchmarking sheet, based on fixed log, metrics, trace, and retention assumptions. Actual pricing may vary by usage, region, and plan structure. Please confirm current pricing with each vendor.
For a mid-sized SaaS company ingesting 45TB(~45,000) total monthly data ingestion and 45,000TB of observability data outcharged by the cloud provider, the total cost will be about ~$7200/month.
Tech Fit
CubeAPM integrates seamlessly into Kafka estates running on AWS MSK, Confluent, or Strimzi/Kubernetes. It works across Java, Go, Node.js, and Python producers/consumers via OTel SDKs and agents. Its deployment flexibility (SaaS or self-hosted) makes it suitable for startups chasing cost control as well as enterprises with data residency or compliance mandates.
2. Datadog
Known for
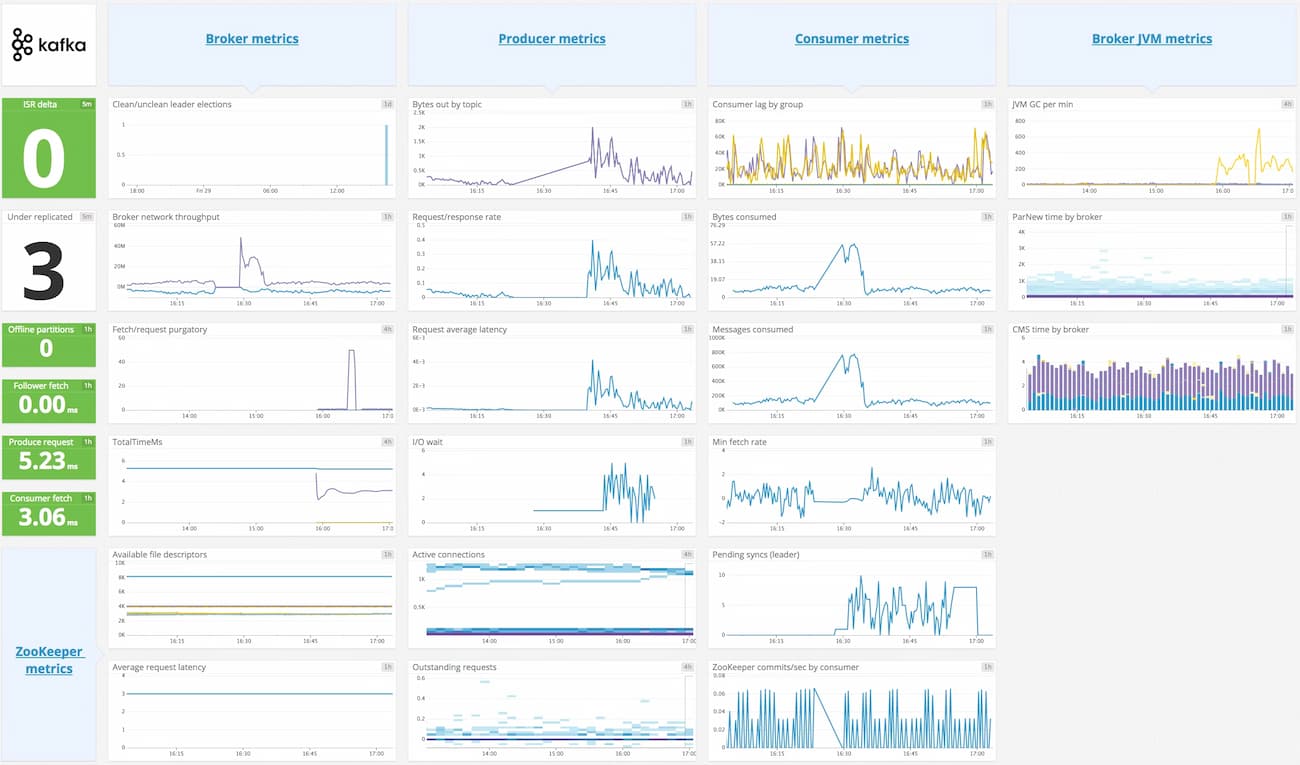
Datadog is widely recognized as a cloud-first observability platform with a vast ecosystem of 900+ integrations. For Kafka, it provides built-in checks for brokers, consumers, and lag, combined with Data Streams to visualize service-to-topic-to-service flows.
Kafka Monitoring Features
- Lag views tied to consumer groups, templates for ISR/URP/offline partitions.
- Service-to-topic mapping to pinpoint producer/consumer bottlenecks.
- JMX-based metrics with autodiscovery in containers.
Key Features
- Kafka broker and consumer checks, curated panels for offsets/lag.
- Data Streams visualizes service → topic → service flows.
- Native MSK integration; strong Kubernetes support and RBAC.
Pros
- Large integration ecosystem, fast time-to-value.
- Data Streams helps correlate lag with specific services.
- Powerful dashboards, alerting, org governance, and SLO tooling.
- Good posture for hybrid estates (infra + APM + logs).
Cons
- Costs can rise with high metric cardinality and log volume.
- Compex initial setup
- Overwhelming UI for new users
Pricing
- APM (Pro Plan): $35/host/month
- Infra (Pro Plan): $15/host/month
- Ingested Logs: $0.10 per ingested or scanned GB per month
Datadog Kafka Monitoring Pricing At Scale
For a mid-sized SaaS company operating 125 APM hosts, 40 profiled hosts, 100 profiled container hosts, 500,000,000 indexed spans, 200 infra hosts, 1,500,000 container hours, 300,000 custom metrics, and ingesting around 10TB(~10,000 GB) of logs per month with 3500 indexed logs, the monthly cost would be around ~$27,475/month.
Tech Fit
Datadog fits best in cloud-native and hybrid environments that are already invested in its monitoring stack. It pairs well with AWS MSK, Kubernetes clusters, and multi-service architectures where Kafka is just one piece of the puzzle. Its org-level RBAC, compliance packs, and enterprise features make it a solid fit for regulated companies, but costs must be watched closely in high-ingest Kafka scenarios.
3. New Relic
Known for
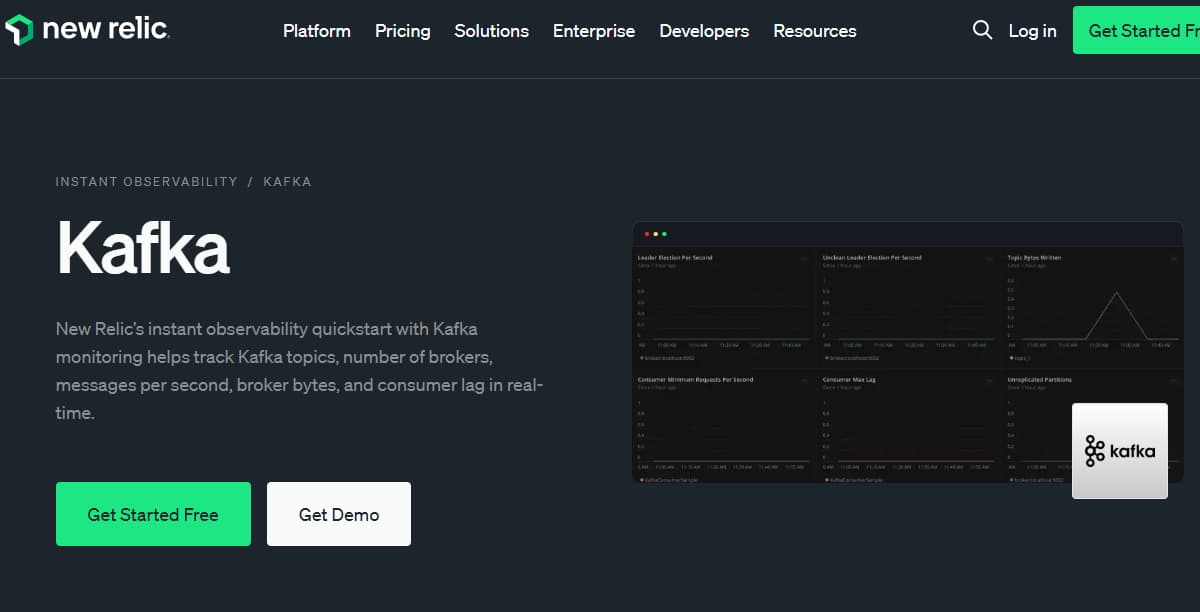
New Relic is known for its single-agent model and ingestion-based pricing, simplifying adoption across large estates. It brings Kafka metrics, consumer lag, and broker health into the same environment as distributed tracing and logs, allowing organizations to query everything with NRQL. For teams that value consolidation and AI-assisted insights, New Relic provides a unified path without juggling multiple agents.
Kafka Monitoring Features
- Per-partition/group lag, consumer offset tracking, rebalance indicators.
- Trace correlation across producer/consumer services; error analytics tied to topics.
- Quickstarts/dashboards for Kafka and JVM metrics.
Key Features
- Kafka integration, brokers, topics, producers/consumers, offsets.
- Distributed tracing with logs-in-context; NRQL for custom lag/SLO views.
- MSK onboarding via CloudWatch + on-host agent; Kubernetes support.
Pros
- “Single agent” story simplifies rollout.
- Strong tracing + logs correlation in one UI.
- Queryable telemetry (NRQL) for burn-down and SLO math.
- Solid ecosystem of quickstarts and golden signals.
Cons
- Expensive as usage grows.
- Retention limits — longer retention requires higher pricing tiers.
- Steep cost curve for logs, traces, and synthetics at Kubernetes scale.
Pricing
- Free Tier: 100GB/month ingested
- Pro plan: $0.40/GB ingested beyond the free 100GB limit
- Pro Plan: $349/user for full platform user
New Relic Kafka Monitoring Pricing At Scale
A mid-sized SaaS company ingesting 45TB (~45,000 GB) of telemetry data per month and with 10 full users, the cost would come around ~$25,990/month.
Tech Fit
New Relic fits teams running Kafka on MSK, Confluent, or self-managed clusters who want a lightweight rollout. It’s well-suited for environments already using its ingestion-based billing, and for developers who want to slice Kafka telemetry with custom NRQL queries. Its SaaS model and quickstarts make it practical for both mid-sized SaaS teams and large enterprises looking for quick wins.
4. Dynatrace
Known for
Dynatrace is recognized as an enterprise-grade observability platform built for automation and scale. With OneAgent, it automatically discovers Kafka services, brokers, and client applications, layering in AI-driven anomaly detection with the Davis engine. For organizations needing predictive baselines and topology-aware RCA, Dynatrace positions itself as the intelligent choice for Kafka monitoring in complex hybrid estates.
Kafka Monitoring Features
- Under-replicated/ISR/leadership health surfaced with anomaly detection.
- Code-level traces related to topics/consumers for faster RCA.
- K8s-native JMX extension deployment and baseline learning.
Key Features
- Automatic discovery and topology; JMX extension for Kafka.
- Deep distributed tracing across Kafka clients and services.
- Strong Kubernetes, infra, and app mapping out of the box.
Pros
- AI-assisted baselining reduces manual threshold work.
- Rich service maps to visualize producer/consumer dependencies.
- Cohesive security + infra + APM story for large estates.
- Good noise control once baselines settle.
Cons
- Expensive as data volumes grow.
- Complex platform, requiring training to use advanced features effectively.
- Overwhelming UI for new users.
Pricing
- Infrastructure Monitoring: $29 / mo per host
- Full-Stack Monitoring: $58 / mo per 8 GiB host
Dynatrace Kafka Monitoring Pricing At Scale
A midsized SaaS company operating 125 APM hosts, 200 infra hosts, 10TB(~10,000 GB) of ingested logs, 300,000 custom metrics, 1,500,000 container hours, and 45,000GB of observability data out(charged by cloud provider), the cost would come around ~$21,850/month.
Tech Fit
Dynatrace fits enterprises running large Kafka deployments across on-premises data centers, Kubernetes, and cloud providers. It is particularly valuable in regulated or global organizations that demand AI-assisted RCA, service maps, and automated anomaly detection. It works best where Kafka is one of many critical systems—databases, microservices, mainframes—that all need to be mapped and monitored under a single enterprise contract.
5. Grafana Cloud
Known for
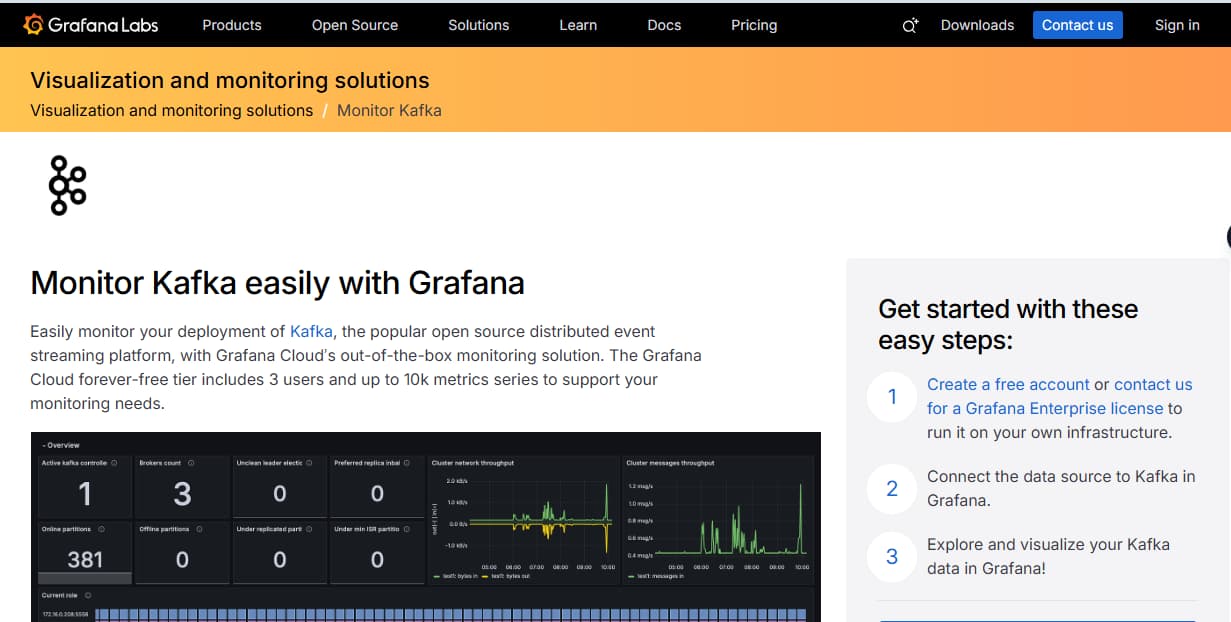
Grafana Cloud is known for being a managed observability platform built around Prometheus, Loki, and Tempo. For Kafka, it ships with opinionated dashboards and alert packs covering brokers, topics, partitions, and consumer lag.
Kafka Monitoring Features
- Broker, topic/partition, and consumer-lag coverage with curated alerts (ISR, offline partitions, lag trend).
- Add-ons for Kafka Connect, Schema Registry, and ksqlDB via exporters/JMX.
- KRaft/ZooKeeper views through JMX mixins and ready panels.
Key Features
- Prebuilt dashboards and alert packs for Kafka; copy-paste Alloy/Prometheus configs.
- Unified metrics, logs, traces; synthetic and incident features available.
- Strong Kubernetes patterns (agents, auto-discovery, rules-as-code).
Pros
- Fastest time-to-value for MSK/Strimzi with opinionated defaults.
- Rules and dashboards maintained by a large community.
- Works well as a central pane for mixed OSS agents (OTEL, Prometheus).
- Good guardrails for metric cardinality and costs.
Cons
- Configuration complexity—requires assembling Prometheus, Loki, and Tempo
- Steep learning curve
- Overwhelming UI making onboarding a challenge
Pricing
- Grafana OSS: Free
- Pro: $19/month
- Logs: $0.50/ GB ingested
- Traces: $0.50/ GB ingested
- Metrics: $6.50/ 1k series
Grafana Cloud Kafka Monitoring Pricing At Scale
For a mid-sized company operating 125 APM hosts, 200 infra hosts, 10TB(~10,000 GB) of ingested logs, and 45,000GB of observability data out(charged by cloud provider), the cost would come around ~$11,875/month.
Tech Fit
Grafana Cloud fits teams using AWS MSK, Confluent, or Strimzi/Kubernetes that prefer Prometheus-style exporters and configurations. It is particularly attractive for DevOps and platform engineers who already rely on Grafana dashboards for infrastructure and application monitoring. Its usage-based pricing can be optimized with metric filtering, making it a strong fit for mid-sized SaaS companies and enterprises with a bias toward open-source tooling.
6. Confluent Control Centre
Known for
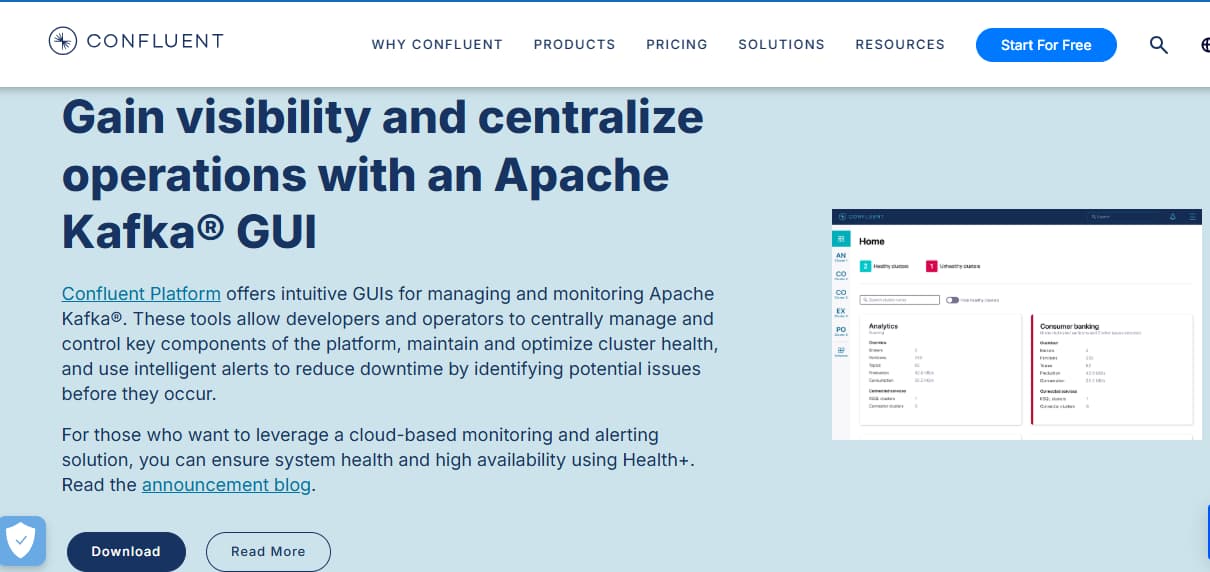
Confluent Control Centre is the native monitoring and management tool for the Confluent Platform. It provides deep visibility into Kafka pipelines, consumer lag, connectors, schemas, and ksqlDB queries.
Kafka Monitoring Features
- Accurate consumer-lag and latency views tied to groups/topics.
- Connector task health, error rates, and rebalance insights.
- Schema compatibility status and ksqlDB query health panels.
Key Features
- Native visibility into clusters, topics, connectors, schemas, and ksqlDB.
- End-to-end pipeline views and lag tracking are integrated with Confluent tooling.
- Governance and data-flow context alongside operational metrics.
Pros
- Deepest context for Confluent components out of the box.
- Minimal glue work; configuration aligns with Confluent best practices.
- Useful for audits/governance where schema and pipeline lineage matter.
Cons
- New users go through a steep learning curve.
- Overwhelming UI hinders usability.
Pricing
General Purpose Clusters
- Basic: $0/month (starter tier)
- Standard: ~$385/month (starting price)
- Enterprise: ~$895/month (starting price)
Managed Connectors (priced by task-hour + data transfer)
- Standard connectors: $0.017–$0.50/hour per task
- Premium connectors: $1.50–$3.00/hour per task
- Custom connectors: $0.10–$0.20/hour per task
- Connector data transfer: $0.025/GB
Confluent Control Centre Kafka Monitoring Pricing At Scale
A midsized SaaS runs one Standard cluster (~$385/mo) and five Standard managed connectors averaging $0.10/hour each. Over ~730 hours/month, connector tasks cost 5 × 0.10 × 730 = $365/mo. If those connectors move 10 TB/month (10,000 GB), connector data transfer at $0.025/GB adds $250/mo. Estimated total: $385 + $365 + $250 ≈ $1,000/month.
Tech Fit
Control Center is the natural fit for organizations heavily invested in Confluent Platform or Confluent Cloud. It’s designed for teams that want monitoring to sit side-by-side with governance, schema management, and pipeline operations. While it isn’t a general-purpose observability suite, it excels for data engineering teams who treat Confluent as their streaming backbone.
7. Sematext
Known for
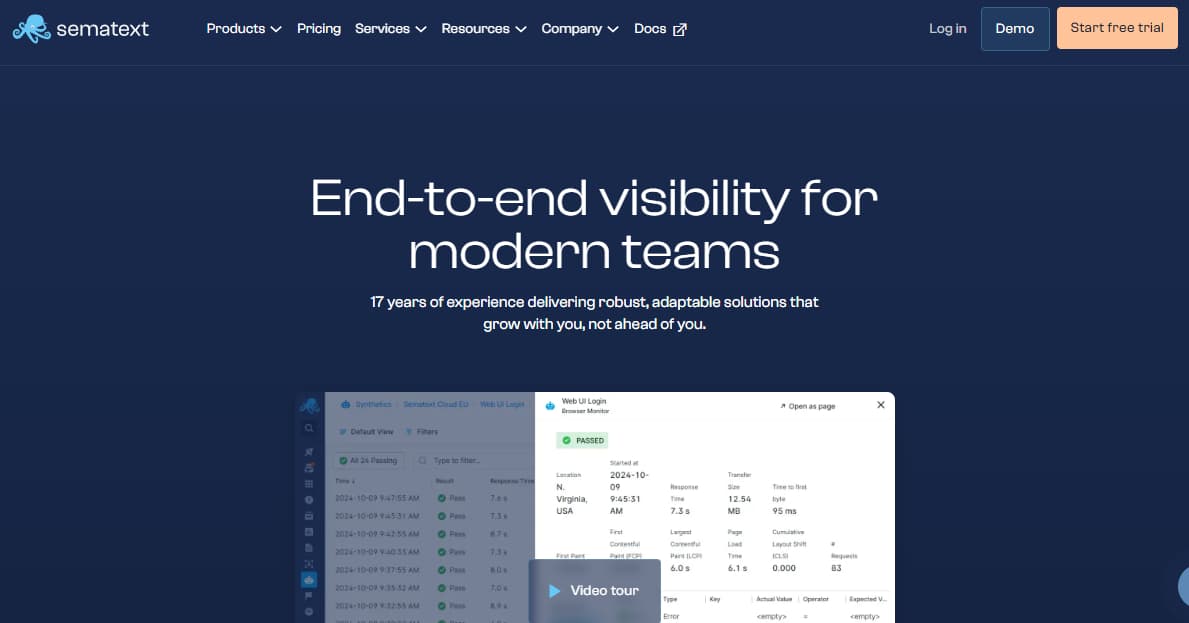
Sematext is known as a lightweight SaaS monitoring and logging platform with fast setup and anomaly detection. For Kafka, it offers more than 100 ready metrics with consumer lag trends, broker health, and alert templates. Its value lies in simplicity: teams can get Kafka observability running in minutes without having to manage exporters or a Prometheus/Grafana stack.
Kafka Monitoring Features
- Kafka metrics (brokers, topics, consumers) with lag trend alerts.
- Templates for ISR/URP/offline partitions and controller status.
- Integration notes for Connect/Schema via JMX and logs.
Key Features
- Turnkey Kafka integration; prebuilt dashboards and alerts.
- Metrics + logs with anomaly detection and flexible retention.
- Simple onboarding and clean UI for smaller teams.
Pros
- Very fast time-to-value; minimal tuning required to be useful.
- Anomaly detection reduces static threshold babysitting.
- Clear pricing and retention controls.
Cons
- Complex initial setup
- Cost can scale as usage grows
Pricing
- Basic: $5/mo base; Data Received: $0.10/GB; Data Stored: $0.15/GB; default 7-day retention.
- Standard: $50/mo base; Data Received: $0.10/GB; Data Stored: $1.57/GB; default 7-day retention.
- Pro: $60/mo base; Data Received: $0.10/GB; Data Stored: $1.90/GB; default 7-day retention.
Sematext Kafka Monitoring Pricing At Scale
For Sematext, combining Logs (Standard, 7-day retention) and Infrastructure (Standard) for a midsized SaaS with 50 hosts and 10 TB/month of logs: Infra = 50 × $3.60 = $180/mo; Logs ingest = 10,000 GB × $0.10 = $1,000/mo; average stored data ≈ (7/30) × 10,000 = 2,333 GB, billed at $1.57/GB ≈ $3,663/mo; plus the Logs plan base $50/mo → ~$4,893/month all-in (excluding synthetics and any extra retention).
Tech Fit
Sematext fits best for startups and mid-sized teams who need Kafka monitoring quickly but don’t want to manage an open-source pipeline. It integrates smoothly with Kubernetes and cloud-managed Kafka like MSK, making it a strong choice for teams with limited ops overhead. While it may lack the deep AI features of enterprise vendors, its clarity and predictable pricing make it practical for smaller Kafka estates.
8. Elastic Observability
Known for
Elastic Observability is built on the ELK Stack (Elasticsearch, Logstash, Kibana), extended with APM and traces. For Kafka, it ingests broker and client metrics via Jolokia or Metricbeat and correlates them with logs. Its power is in search and analytics—letting teams slice Kafka telemetry alongside application logs and infrastructure events in real time.
Kafka Monitoring Features
- Kafka module via JMX/Jolokia for broker/client metrics.
- Dashboards for broker health, topics, and consumer groups.
- Logs-in-context to correlate broker/client errors with metric anomalies.
Key Features
- Metricbeat/Filebeat/OTEL ingestion into Elasticsearch; Kibana dashboards and alerts.
- Unified logs + metrics + traces; rich query and visualization.
- Flexible lifecycle management and retention tiers.
Pros
- Leverages existing ELK investments; strong search and analytics.
- Flexible ingest pipelines and transforms.
- Works well for log-heavy Kafka estates with structured parsing.
Cons
- Expensive as usage grows.
- Retention costs increase rapidly with large volumes.
- Steep learning curve for setup and tuning.
Pricing
- Standard: $99/month
- Gold: $114/month
- Platinum: $131/month
- Enterprise: $184/month
Elastic Observability Kafka Monitoring Pricing At Scale
For a mid-sized SaaS company with 125 APM hosts, 20TB of event ingestion per month, and 45,000GB of observability data (charged by the cloud provider), the cost would be around $17,435.
Tech Fit
Elastic fits organizations that already run the ELK stack and want to expand into Kafka observability without adding another vendor. It’s best for log-heavy Kafka pipelines where detailed analysis and correlation are more important than canned dashboards. Elastic works well in self-managed environments where teams have the expertise to scale clusters and tune queries, or in Elastic Cloud for those preferring managed operations.
9. Lenses
Known for
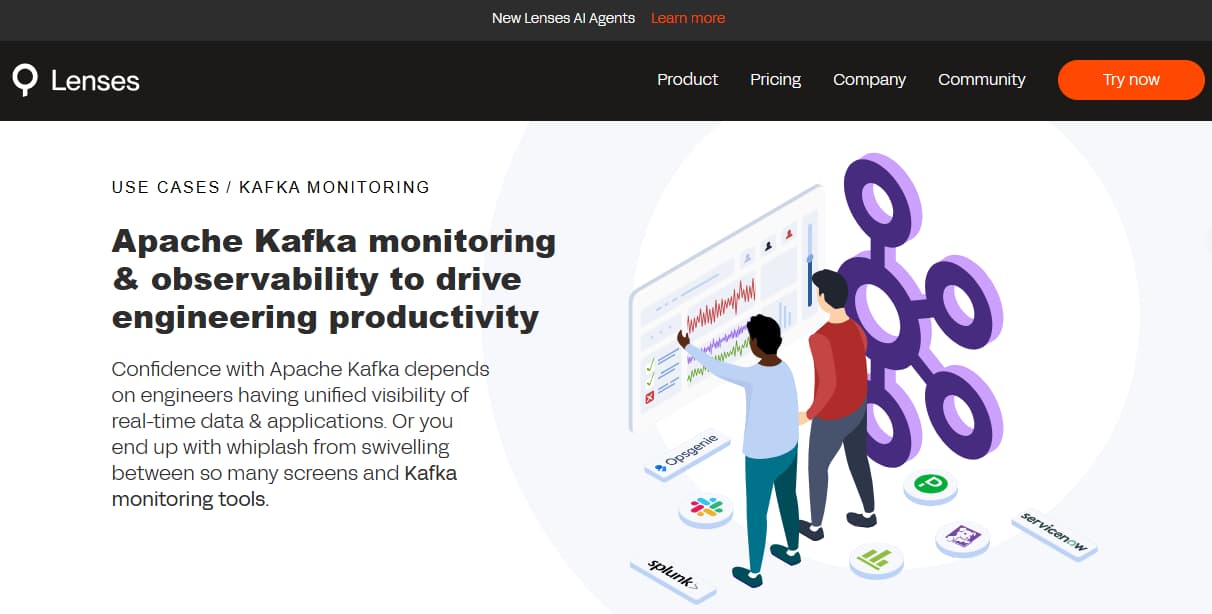
Lenses is known as a Kafka-native operational UI and governance platform. It gives developers and operators real-time insights into topics, consumer groups, and connectors, along with guardrails for safe operations. Beyond monitoring, Lenses emphasizes governance, SQL-like queries, and developer-friendly tooling for day-to-day Kafka work.
Kafka Monitoring Features
- Visual indicators for URPs, lag, and connector/task health.
- Safe ops workflows (e.g., topic management, reassignments) with guardrails.
- Context around schemas and data quality signals.
Key Features
- Real-time topic browsing, SQL-like queries, ACLs/governance.
- Health views for clusters and connectors.
- Integrations with Prometheus/Grafana for long-term metrics and alerting.
Pros
- Excellent day-2 ops UX for platform and app teams.
- Shortens diagnosis for data pipeline issues.
- Pairs well with Prometheus/Grafana to complete the picture.
Cons
- High licensing cost
- Complex initial setup
Pricing
Community Edition: Free — limited features, basic authentication, 2 user accounts, connect up to 2 Kafka clusters; supports all Kafka vendors.
Enterprise Edition: From $4,000/year per non-production cluster — full features, SSO, up to 15 users,
Lenses Kafka Monitoring Pricing At Scale
A midsized SaaS running one staging (non-prod) cluster and one prod cluster could use Lenses Enterprise for staging at $4,000/year ≈ $333/month, keep dev on Community (free), and request a quote for prod (not listed). If they add a separate performance-testing non-prod cluster, ≈ $667/month; total then becomes ~$667/month for the two non-prod clusters (plus whatever is quoted for prod).
Tech Fit
Lenses fits platform and data teams running Confluent or Apache Kafka clusters who want a Kafka-centric cockpit. It pairs well with Prometheus/Grafana or an observability suite, providing the operational workflows and governance that general-purpose monitoring tools don’t cover. It’s especially useful in regulated industries where audit trails, data policies, and controlled operations matter as much as performance.
Conclusion
Kafka monitoring is hard because the problems don’t live in one place. “Lag truth,” ISR/URP churn, leadership changes, and KRaft controller health all interact—then Connect, Schema Registry, and ksqlDB add more moving parts. Managed platforms like MSK and Confluent introduce their own quirks, and costs can spike if metrics, logs, and traces aren’t tamed.
If you want fast, reliable RCA, you need OTEL-based tracing across producer → Kafka → consumer, opinionated alert packs (ISR shrink, offline partitions, lag keeps increasing), and clean dashboards for brokers, topics, and consumer groups—plus Kubernetes-ready deploys.
CubeAPM wraps those pieces into one OTEL-native platform with predictable usage pricing (e.g., $0.15/GB), smart sampling, and a self-host option for regulated teams. Start with the quick shortlist, then trial CubeAPM to validate lag SLOs and cut MTTR on your busiest pipelines.
Disclaimer: The information in this article reflects the latest details available at the time of publication and may change as technologies and products evolve.
FAQs
1) What should I monitor first in Kafka?
Start with cluster health (offline partitions, ISR shrink/expand, controller status), topic/partition skew, and consumer lag trend with burn-down time. Tools like CubeAPM ship these as ready alerts so you don’t start from a blank slate.
2) Do I need both JMX and Kafka Exporter?
Use JMX for broker JVM and detailed Kafka metrics; pair with a Kafka exporter for consumer group and topic metrics. Platforms like CubeAPM can ingest either path and correlate them with traces and logs.
3) How do I get accurate consumer-lag SLOs?
Track per-group/per-partition lag and evaluate it over a time window (not just a static threshold). Add burn-down time (how fast lag clears). CubeAPM includes trend-aware “lag keeps increasing” alerts and SLO views out of the box.
4) What changes with KRaft vs. ZooKeeper for monitoring?
You’ll watch controller quorum health, election and commit latencies, and leader/epoch changes. CubeAPM surfaces KRaft controller metrics alongside traditional broker and partition views.
5) How do I trace messages end-to-end?
Adopt OpenTelemetry and propagate context via message headers in producers/consumers. With CubeAPM, those spans line up with Kafka metrics and logs so you can jump from a lag alert to the exact service and release.


