Sematext is a full-stack observability platform that brings logs, metrics, traces, RUM, and synthetics into a single, unified solution, making it a solid choice for teams seeking broad visibility across their stack. However, concerns remain around higher costs and an interface that can feel overwhelming during day-to-day monitoring and configuration.
CubeAPM is the best alternative to Sematext, addressing these challenges with full-stack observability, predictable usage-based pricing, and a cleaner, more streamlined interface that reduces operational friction as teams scale.
In this article, we’ll explore the top 7 Sematext alternatives that better meet modern observability demands. We’ll compare each based on cost, deployment, OTEL support, and MELT coverage.
Top 7 Sematext Alternatives
- CubeAPM
- Datadog
- New Relic
- Coralogx
- SigNoz
- Sentry
- Dynatrace
Why Look for Sematext Alternatives?
Here are some of the key reasons why organizations are actively exploring alternatives to Sematext in 2025:
1. Overwhelming UI
While Sematext offers many observability modules in one place, users frequently report that the interface becomes cramped and confusing when trying to correlate logs, events, and metrics — especially under load.
“The interface for the monitors has a few quirks from a UX point of view – it takes 1-2 clicks more than it needs to to edit configurations. I also use middle click on my browser a million times a day to open links in a new browser tab”–G2 Review
2. High Costs as Usage Grows
Some teams look for Sematext alternatives because costs can rise faster than expected as log volumes and feature usage increase. Users note that certain capabilities feel relatively expensive, particularly when moving beyond the free tier, making long-term cost predictability a concern for growing environments.
“The pricing structure is a little bit costly” (G2 Review)
Criteria for Suggesting Sematext Alternatives
1. OpenTelemetry & Modern Protocol Support
Alternatives must offer native OpenTelemetry (OTEL) support to ensure vendor neutrality, broader ecosystem compatibility, and standardized instrumentation across logs, metrics, traces, and events.
2. Pricing Transparency
Tools should have clear, predictable pricing models with no hidden per-feature fees. We prioritize platforms with either flat-rate or usage-based pricing that scale well as telemetry volume grows.
3. Full MELT Observability
We focus on platforms offering end-to-end MELT observability: Metrics, Events, Logs, and Traces, along with APM, RUM, synthetics, and infra monitoring — in a single tool.
4. Support Quality & Developer Experience
High-quality, fast support via chat, Slack, or direct access to engineers improves developer workflows and incident resolution. Tools with responsive teams and modern UX are favored.
Sematext Overview
Known For
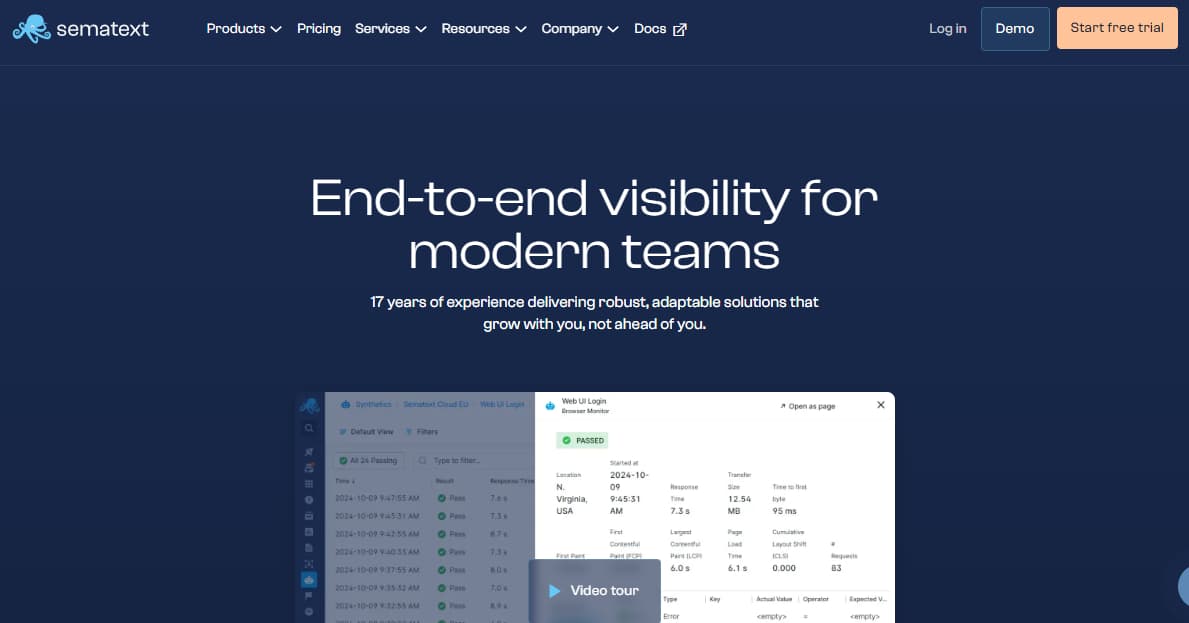
Sematext is known for offering a modular, all-in-one observability platform that includes log management, APM, real user monitoring (RUM), synthetics, and infrastructure monitoring. It is designed for small to mid-sized teams that want a unified dashboard without the steep learning curve or high cost of enterprise tools. Its strength lies in simplicity and modularity — users can pick the components they need, making it a lightweight choice for DevOps observability.
Standout Features
- Modular service structure — choose only what you need (APM, logs, infra, RUM)
- Real User Monitoring with Core Web Vitals support
- Unified alerting across logs, metrics, and traces
- Agent support for Docker, Kubernetes, AWS, and JVM environments
Key Features
- Log Management: Search and analyze logs in real time with filtering, alerting, and flexible dashboards.
- APM & Tracing: Monitor application latency, request traces, and service dependencies across microservices.
- Real User Monitoring (RUM): Frontend observability with UX metrics, performance KPIs, and error tracking.
- Infrastructure Monitoring: Host, container, and Kubernetes performance tracking with visual dashboards.
- Synthetic Monitoring: HTTP and browser tests for uptime and API monitoring.
- Alerting & Integrations: Alert routing to Slack, Opsgenie, PagerDuty, and webhooks.
Pros
- Affordable entry-level pricing and 14-day free trial
- Single-agent setup simplifies deployment
- Modular architecture lets teams avoid unnecessary features
- Strong integration coverage for modern DevOps stacks
Cons
- Overwhelming UI hinders usability
- High costs as usage grows
Best For
- Teams that need basic APM and logging with low setup overhead
- Startups and mid-sized engineering orgs that can work within short retention windows
- DevOps teams looking for a budget observability platform without deep customization needs
Pricing & Customer Reviews
- Basic: $5/month, 500 MB/day, 7-day retention
- Standard: $50/month, 1 GB/day, 7-day retention
- Pro: $60/month, 7-day retention
- Sematext is rated 4.5/5 on G2, with users appreciating its modular stack and ease of onboarding. However, common concerns include UI responsiveness and steep storage costs.
Top 7 Sematext Alternatives
1. CubeAPM

Known For
Cost-efficient, OpenTelemetry-native observability with full MELT coverage — CubeAPM is built for modern engineering teams that want powerful distributed tracing, full-stack visibility, and compliance-friendly deployment, all at a flat, low cost. It supports logs, metrics, traces, real user monitoring (RUM), synthetics, and error tracking with smart sampling and unlimited retention by default.
Key Features
- OpenTelemetry-First Tracing: Native OTEL support enables easy instrumentation and cross-platform compatibility across services, containers, and languages.
- Smart Sampling: Uses context-aware sampling (based on latency, errors, etc.) to retain critical traces while minimizing data volume — enabling 90%+ cost reduction compared to head-based sampling used by most vendors.
- Self-Hosted or Cloud Deployment: Fully supports on-premises and private cloud deployments, ensuring teams can meet data localization and compliance requirements (HIPAA, GDPR, etc.).
- Unlimited Retention: Ingest once, store forever — no extra fees or storage premiums for long-term telemetry.
- Full MELT Observability: Covers Metrics, Events, Logs, Traces (MELT), including browser RUM, synthetics, and serverless observability.
- Native Compatibility: Works with Prometheus, Datadog agents, New Relic instrumentation, and all major OTEL SDKs.
Standout Features
- Flat $0.15/GB pricing for data ingestion.
- Deployment inside your cloud — avoids egress costs and ensures data sovereignty.
- WhatsApp/Slack-based support with engineers — real-time troubleshooting
- Rapid onboarding — switch in under 1 hour
Pros
- Native OTEL support across all components
- True self-hosting with cloud/on-prem hybrid support
- Unlimited retention at no extra cost
- Smart sampling drastically reduces cost and noise
- Fast, responsive support via Slack or WhatsApp
Cons
- Not suited for teams looking for off-prem solutions
- Strictly an observability platform and does not support cloud security management
Best For
- Teams seeking modern observability without vendor lock-in
- Organizations needing on-prem/self-hosted APM with compliance needs
- Startups and enterprises looking to cut observability costs by 60–80%
Pricing & Customer Reviews
- Flat pricing: $0.15/GB — includes ingestion, retention, and storage
- Rating: 4.7/5(Based on Slack and end-user feedback)
CubeAPM vs Sematext
Both CubeAPM and Sematext offer full-stack observability across logs, metrics, and traces, but they differ in architecture and pricing approach. Sematext follows a SaaS-first model with usage-based tiers that can become less predictable as data volumes grow. CubeAPM is OpenTelemetry-native with a unified MELT stack and ingestion-based pricing, making it a strong Sematext alternative for teams seeking simpler cost control and data ownership.
2. Datadog
Known For
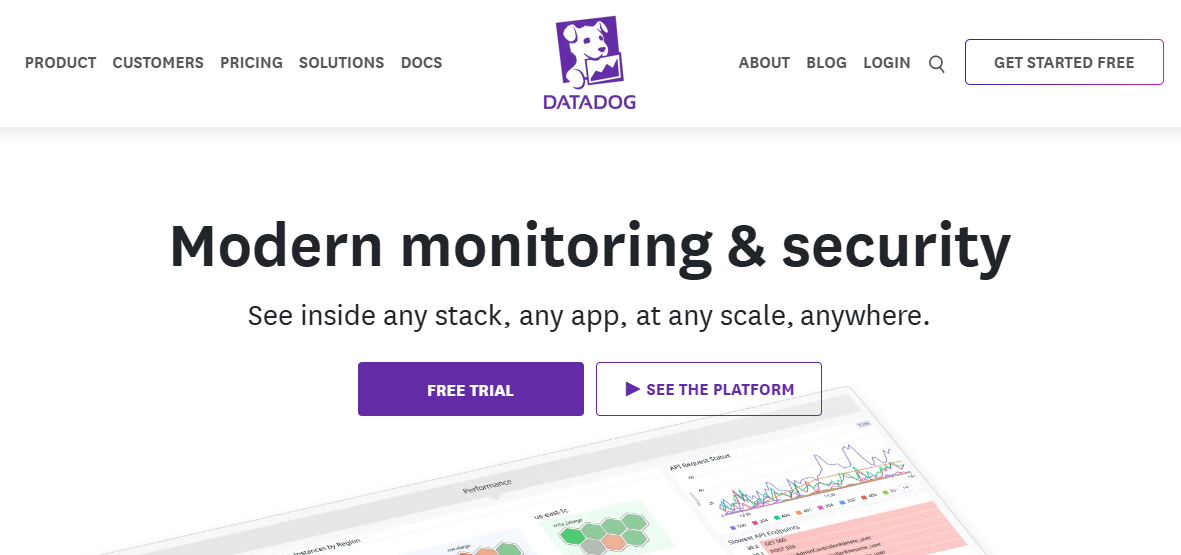
Datadog is widely known as a cloud-native monitoring and security platform used by enterprises to monitor applications, infrastructure, logs, and user experience. It is popular for its deep integrations, pre-built dashboards, and coverage across the full DevOps stack — including APM, logs, RUM, synthetics, CI/CD, and cloud security.
Key Features
- Application Performance Monitoring (APM): Visualize service-to-service latency, track bottlenecks, and debug with flame graphs, service maps, and request tracing.
- Log Management: Centralized log ingestion with filtering, indexing, live tailing, and dynamic rehydration of cold logs (at extra cost).
- Infrastructure Monitoring: Collect metrics from cloud services, containers, and hosts with over 600 integrations (AWS, Azure, Kubernetes, Docker, etc.).
- RUM & Synthetic Monitoring: Real User Monitoring for web and mobile apps, plus API checks, browser-based tests, and uptime probes.
- Security Monitoring & Cloud SIEM: Unified observability and threat detection in one platform.
- Dashboards & Collaboration: Customizable dashboards, notebooks, and integrated incident response workflows.
Standout Features
- Large ecosystem with 900+ integrations
- Unified observability + security in a single UI
- High-granularity dashboards and alerting
- Dynamic log indexing and rehydration
Pros
- Extensive feature set across observability and security
- High-scale infrastructure and APM visibility
- Enterprise-grade integrations and dashboards
- 15-month retention available (at higher pricing tiers)
Cons
- Expensive and unpredictable pricing as usage scales
- Interface and configuration overload — can be overwhelming
- Steep learning curve and complexity for newcomers
Best For
- Enterprises needing an all-in-one observability and security platform
- Teams with large cloud-native deployments and the budget to scale observability
Pricing & Customer Reviews
- APM (Pro Plan): $31/host/month
- Infra Monitoring(Pro Plan): $15/host/month
- Log ingestion: $0.1/GB ingested
- G2 Rating: 4.4/5
Datadog vs Sematext
Datadog and Sematext both support logs, metrics, and traces, but they target different scales. Datadog offers a broad, enterprise-grade observability platform with a large integration ecosystem, though costs and pricing complexity can increase quickly as usage grows. Sematext provides a more streamlined observability stack with simpler pricing and deployment options, making it easier to manage for smaller teams or lighter workloads.
3. New Relic

Known For
New Relic is best known for being one of the earliest players in APM and telemetry. It offers a full-stack observability platform that spans application performance, logs, infrastructure, browser and mobile monitoring, and synthetics — all integrated into a single user interface. New Relic is commonly used by mid to large enterprises looking for out-of-the-box dashboards and prebuilt instrumentation.
Key Features
- Application Monitoring: Distributed tracing, throughput analysis, and transaction breakdowns to identify slow services and bottlenecks.
- Log Management: Centralized log ingestion and live search, with custom parsing, filtering, and retention settings.
- Infrastructure & Kubernetes Monitoring: Host and container-level metrics with built-in visualization for cloud-native environments.
- Browser & Mobile Monitoring: End-user performance tracking for frontend and native apps, including JS errors and page load analysis.
- Dashboards & Alerts: Custom visualizations and alert conditions across metrics, logs, traces, and events.
Standout Features
- Unified platform for APM, logs, infra, and frontend
- Automatic instrumentation with supported agents
- Telemetry Data Platform for unified querying
- Visualization tools and curated dashboards
Pros
- Broad out-of-the-box instrumentation and SDKs
- Intuitive UI with guided onboarding for developers
- Strong RUM and mobile observability support
- Integrated logs and APM in one view
Cons
- Users find the initial setup complex, requiring significant knowledge
- High cost due to per-user licenses and data ingestion fees
- Challenges with limited features, including restricted access
- User Licenses Are Expensive: Full-access licenses start at $349/user/month
Best For
- Enterprises already invested in the New Relic ecosystem
- Teams needing strong APM and browser/mobile monitoring in one tool
- Engineering orgs looking for preconfigured dashboards and fast time-to-value
Pricing & Customer Reviews
- Free Tier: 100GB/month ingested
- Data Ingestion (Pro plan): $0.40/GB ingested beyond the free 100GB limit
- Usaged Pricing (Pro Plan): $349/user for full platform user
- G2 Rating: 4.4/5
New Relic vs Sematext
New Relic and Sematext both offer observability across logs, metrics, and traces, but differ in depth and pricing model. New Relic provides a comprehensive enterprise-focused platform with advanced analytics and a wide set of modules, which can bring complexity and higher costs as usage grows. Sematext delivers a more streamlined observability stack with simpler pricing and deployment options, often making it a more predictable choice for smaller teams.
4. Coralogix
Known For
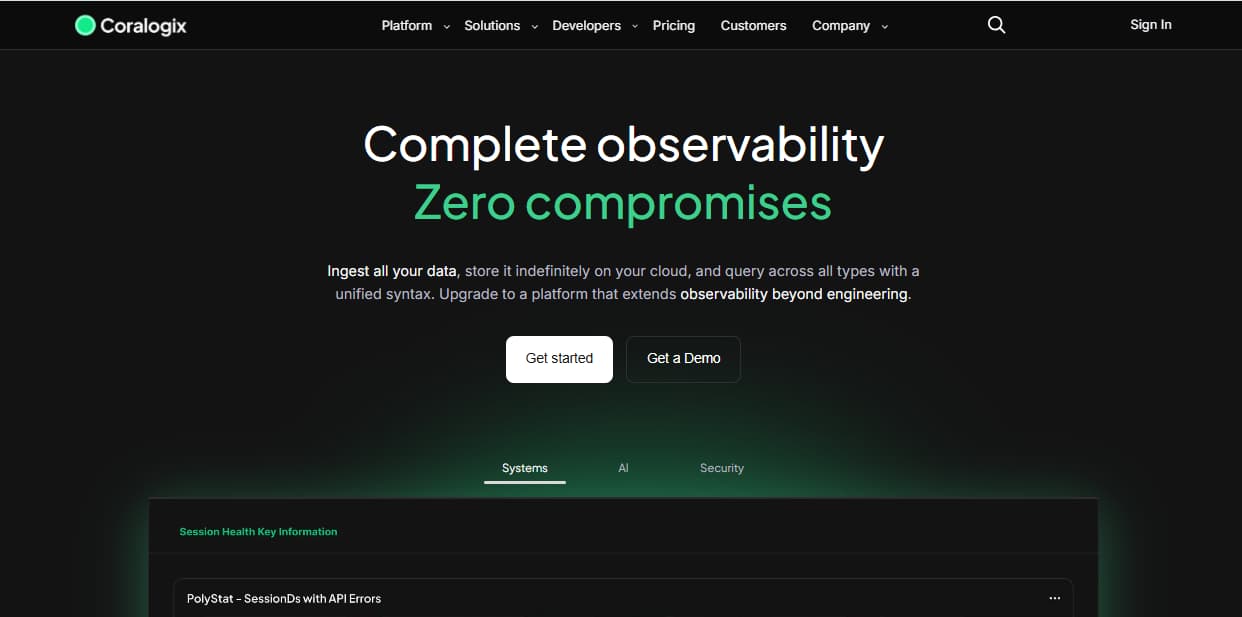
Coralogix is known for its log analytics and cost-optimization model, offering structured observability across logs, metrics, traces, and security. It is positioned as a log-first observability vendor that appeals to teams looking to optimize costs by routing data to different storage tiers based on usage and query frequency.
Key Features
- Log Pipeline Optimization: Coralogix routes logs into three streams — real-time, archive, and compliance — based on how data is used, helping reduce storage costs.
- Metrics & Traces: Integrates metrics and traces into the same platform, with support for distributed tracing and anomaly detection.
- TCO Reduction Features: Allows teams to store archived data in their own S3-compatible storage, reducing vendor-side storage costs.
- Security & Compliance: Offers threat detection, SIEM capabilities, and compliance-ready architecture for privacy-focused industries.
Standout Features
- Customizable log routing by use-case (streaming, hot storage, archive)
- Archived logs can be stored in the customer’s own cloud (e.g., AWS S3)
- Rich dashboarding and ML-powered alerting
- Native integration with security and compliance workflows
Pros
- Flexible cost-control via log stream classification
- Full observability with built-in metrics and traces
- Option to offload long-term storage to customer infrastructure
- Integrated security analytics for DevSecOps teams
Cons
- Steep learning curve for new users
- Complex and unintuitive UI
- Limited API capabilities
Best For
- Teams looking to optimize observability spend across storage tiers
- Companies that need to comply with GDPR or security policies but still want vendor tooling
- DevSecOps and platform teams looking to unify logging and threat detection
Pricing & Customer Reviews
- Logs: $0.42/GB
- Traces: $0.16/GB
- Metrics: $0.05/GB
- G2 Rating: 4.6/5
Coralogix vs Sematext
Coralogix and Sematext are both full-stack observability platforms supporting logs, metrics, and traces, making Coralogix a direct alternative to Sematext. Coralogix emphasizes analytics, automation, and cost control at scale, while Sematext focuses on a more lightweight, all-in-one experience with a simpler setup. Teams comparing Sematext alternatives often evaluate Coralogix when they need a broader observability platform that can scale across larger or more complex environments.
5. SigNoz

Known For
SigNoz is an open-source, OpenTelemetry-native observability platform built to give engineering teams full control over their telemetry stack. It is designed to replace proprietary APM solutions with a fully self-hosted alternative that supports logs, metrics, traces, dashboards, and alerts — without vendor lock-in.
Key Features
- OpenTelemetry Native Instrumentation: SigNoz uses OTEL across all telemetry types — making it easy to ingest data from any service or language that supports the OTEL standard.
- Self-Hosted with Docker or Helm: Teams can deploy SigNoz on their own infrastructure via Docker Compose or Helm charts — ensuring full control over data and performance.
- Logs, Metrics, Traces in One UI: SigNoz supports deep correlation across logs, traces, and metrics with shared context and dashboards.
- Dashboards & Alerts: Built-in dashboards and alerts, with support for PromQL and custom rule configurations.
Standout Features
- Full OpenTelemetry-native architecture
- Self-hostable with no paid licensing requirements
- Tail-based sampling and configurable trace policies
- Prometheus-compatible metrics engine and Grafana-style dashboards
Pros
- Open source and free to self-host
- Native support for OTEL, Prometheus, and Docker/Kubernetes
- Fine-grained control over sampling, retention, and storage
- Active developer community and GitHub support
Cons
- Managing ClickHouse memory usage is time-consuming
- Operational complexity, especially for managing the stacks
- The UI, while functional, might feel cluttered
Best For
- Engineering teams that want full data ownership and OTEL-native workflows
- Startups and DevOps teams avoiding SaaS lock-in
- Organizations with in-house infra who prefer to self-manage observability
Pricing & Customer Reviews
- Self-hosted: Free
- Logs: $0.3/GB ingested
- Traces: $0.3/GB ingested
- Metrics: $0.1/mil samples
- G2 Rating: 4.5 / 5
- Praised for: Simplicity, UI, open-source approach
- Criticized for: complexity, especially in backend management
SigNoz vs Sematext
SigNoz and Sematext are both full-stack observability platforms covering logs, metrics, and traces, making SigNoz a direct alternative to Sematext. SigNoz is open-source and OpenTelemetry-native, offering flexible deployment options (self-hosted or managed), while Sematext provides a more unified SaaS-first experience with simplified pricing and setup. Teams evaluating Sematext alternatives often consider SigNoz when they want open-source control and extensibility alongside core observability capabilities.
6. Sentry
Known For
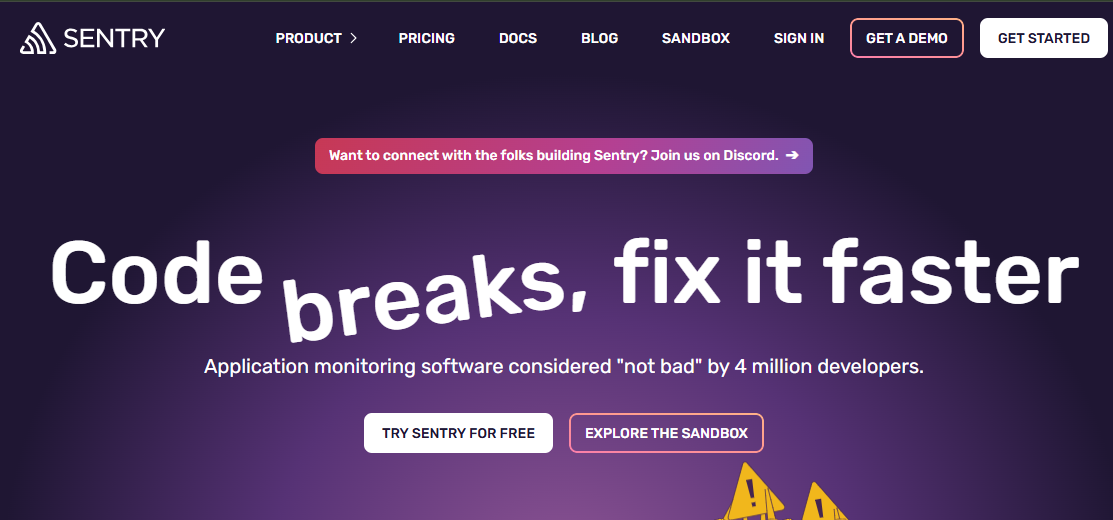
Sentry is known as a developer-first application monitoring and error tracking platform. It started as a tool for frontend and backend error visibility but has since expanded to offer distributed tracing, performance monitoring, and release health — with native SDKs across popular frameworks and languages.
Key Features
- Error Tracking: Automatically captures exceptions, stack traces, and contextual metadata (e.g., release version, browser, user actions).
- Performance Monitoring: Offers transaction traces, latency metrics, and span-based views to identify slow endpoints or N+1 queries.
- Release Health: Tracks crash rates, user impact, and failed sessions across app versions for CI/CD feedback loops.
- Session Replay (Paid Add-On): Visual replay of user sessions for debugging frontend issues with full context.
Standout Features
- Best-in-class error reporting and debugging tools
- Tight integration with GitHub, Jira, Slack, and CI/CD pipelines
- Native SDKs for JavaScript, Python, Node.js, Java, PHP, .NET, and mobile platforms
- Developer-focused workflow integration
Pros
- Highly detailed stack traces with user context
- Real-time alerts for errors and performance regressions
- Excellent integration with dev tools and issue trackers
- Lightweight setup with modern SDKs
Cons
- Complex configuration setup
- Expensive at scale
- Delays in error reporting, alerts, and display
Best For
- Developer teams focused on error tracking, debugging, and release quality
- Product engineering orgs needing visibility into frontend, mobile, or backend errors
- Teams that want error observability tightly tied to deployments and issues
Pricing & Customer Reviews
- Pricing: Usage-based pricing depending on error events, sessions, and features
- G2 Rating: 4.6/5
Sentry vs Sematext
Sentry and Sematext both support observability, but they differ in focus and scope. Sentry is primarily centered on application error and performance monitoring with deep error insights, while Sematext offers a broader full-stack observability stack covering logs, metrics, and traces. As a Sematext alternative, Sentry may appeal when error tracking and application performance are the primary priorities, whereas Sematext provides a more unified observability experience across infrastructure and application signals.
7. Dynatrace
Known For
Dynatrace is known for its AI-powered enterprise observability platform, combining infrastructure monitoring, APM, logs, security, and automation into a single solution. Its unique Davis AI engine and Smartscape topology make it ideal for large, complex environments that need automated root-cause analysis and dynamic dependency mapping.
Key Features
- Full-Stack Observability: Covers metrics, logs, traces, real user monitoring (RUM), synthetics, and infrastructure — all correlated with topology and dependencies.
- Davis AI Engine: AI-powered detection of anomalies, root-cause analysis, and event correlation across distributed systems.
- Smartscape Topology Mapping: Auto-discovers services, processes, containers, and dependencies in real time.
- Application Security & Runtime Insights: Built-in application vulnerability detection and continuous code-level visibility.
Standout Features
- Real-time service maps with automated root-cause analysis
- Unified observability + security
- Davis AI engine for anomaly detection
- Deep native support for cloud-native and hybrid infrastructure
Pros
- Enterprise-grade observability and automation
- Excellent for dynamic environments (Kubernetes, microservices)
- Automated dependency mapping and topology-aware alerts
- Combines performance monitoring with runtime security
Cons
- Steeper learning curve for new teams
- High pricing makes it less accessible to startups
- Overwhelming UI & data overload
Best For
- Enterprises with large, dynamic cloud environments
- Teams seeking AI-powered automation and smart diagnostics
- Organizations needing unified observability + security tooling
Pricing & Customer Reviews
- Full-Stack Monitoring: $58 /month/per 8 GiB host*
- Infrastructure Monitoring: $29 /month/per host*
- G2 Rating: 4.5/5
Dynatrace vs Sematext
Dynatrace and Sematext both provide observability across logs, metrics, and traces, but they serve different scales and needs. Dynatrace is an enterprise-grade platform with deep automation, AI-driven analytics, and broad ecosystem integrations, while Sematext offers a more streamlined observability stack with simpler setup and pricing. As a Sematext alternative, Dynatrace is often considered when teams need advanced automation and large-scale enterprise capabilities, whereas Sematext appeals where ease of use and predictable costs are priorities.
Conclusion
Sematext remains a practical observability solution for small to mid-sized teams — but its limitations around costs have pushed many organizations to explore better-suited alternatives.
If you need OpenTelemetry-native instrumentation, flat pricing, and unlimited retention, platforms like CubeAPM and SigNoz offer compelling value. For enterprise-scale operations, Dynatrace and Datadog deliver deeper automation and ecosystem integration — albeit at a much higher cost. Coralogix appeals to cost-conscious teams with tiered log pipelines, while New Relic offers broad APM and browser coverage. Sentry, meanwhile, is ideal for developer-side debugging and release health monitoring.
Choosing the right alternative depends on your needs for compliance, control, cost predictability, and depth of observability. For teams looking to modernize their observability stack without overspending, CubeAPM offers the most balanced combination of capability, affordability, and control.
Disclaimer: The information in this article reflects the latest details available at the time of publication and may change as technologies and products evolve.
FAQs
1. What are the main limitations of Sematext?
Sematext is limited by its 7-day default retention, lack of native OpenTelemetry support, and high storage pricing (up to $1.90/GB). It also lacks advanced sampling and true self-hosting flexibility.
2. Which is the best Sematext alternative for OpenTelemetry support?
CubeAPM and SigNoz are the best OTEL-native alternatives. CubeAPM offers smart sampling, unlimited retention, and flat pricing, while SigNoz is open-source and self-hosted.
3. Is Sematext good for large-scale or enterprise workloads?
Sematext may not be ideal for enterprises due to limited deployment flexibility, short retention, and basic support SLAs. Tools like Dynatrace and Datadog are more suitable at enterprise scale.
4. Which tool offers the best cost-to-feature ratio as a Sematext alternative?
CubeAPM offers the best pricing at $0.15/GB with unlimited retention, smart sampling, and full MELT observability — significantly undercutting tools like Datadog or New Relic.
5. Can I self-host an alternative to Sematext?
Yes. CubeAPM, SigNoz, and Coralogix offer self-hosting or hybrid deployment options — with CubeAPM supporting full on-prem and cloud-native setups.


