Hadoop monitoring tools are now essential as enterprises navigate a world expected to generate around 181 zettabytes of data, driven by IoT, AI, and real-time analytics.
Without visibility into distributed data workflows, critical jobs in your Apache Hadoop ecosystem can bottleneck, delay, or fail silently. However, choosing a Hadoop monitoring tool that doesn’t scale with petabyte workloads, lacks deep Hadoop-native instrumentation, or comes with escalating pricing can quickly hinder performance, cost control, and operational agility.
CubeAPM is the best Hadoop monitoring tool provider, offering native OpenTelemetry support, auto-discovery of Hadoop clusters, smart sampling to control storage costs, and self-hosting. Let’s explore the top Hadoop monitoring tools based on features, pricing, and more.
Top 8 Hadoop Monitoring Tools
- CubeAPM
- Datadog
- New Relic
- Dynatrace
- Apache Ambari
- ManageEngine Applications Manager
- Cloudera Manager
- Unravel Data
What is a Hadoop Monitoring Tool?
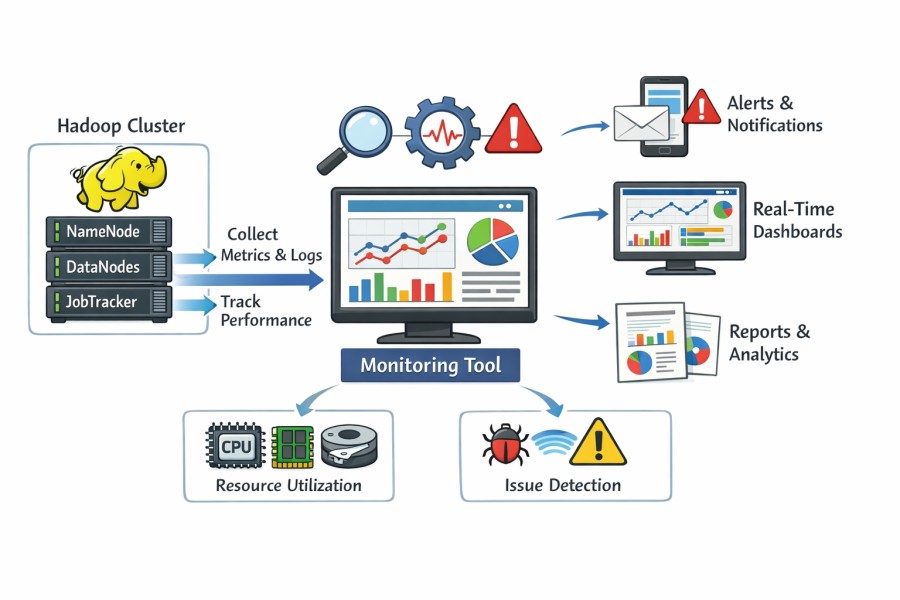
An Apache Hadoop monitoring tool is software that tracks the health, performance, and resource usage of components within a Hadoop ecosystem, including HDFS, YARN, MapReduce, Hive, Spark, and ZooKeeper. It continuously collects telemetry, such as CPU load, memory utilization, disk I/O, job execution time, and data transfer rates, then visualizes them in real-time dashboards. The goal is to help engineers detect bottlenecks, prevent job failures, and optimize resource allocation across distributed clusters.
For modern enterprises handling petabytes of unstructured data, Hadoop monitoring tools play a crucial role in maintaining high data throughput, minimal job latency, and cluster reliability. A unified observability approach reduces downtime and enables predictive scaling decisions. Key reasons businesses rely on Hadoop monitoring tools today include:
- Improved Cluster Health: Automatic detection of failing DataNodes, under-replicated blocks, or misconfigured YARN queues.
- Performance Optimization: Insights into slow-running jobs and inefficient MapReduce or Spark tasks help tune performance.
- Cost Efficiency: Intelligent sampling and storage reduction lower telemetry storage costs by up to 60%.
- Compliance & Security: Self-hosting options enable adherence to compliance and localization requirements.
- End-to-End Visibility: Unified dashboards correlate metrics, logs, and traces to provide a single source of truth for debugging.
Example: Detecting YARN Resource Bottlenecks with CubeAPM
Imagine a large retail company running Hadoop for daily inventory analysis. Several MapReduce jobs start lagging due to YARN queue saturation and I/O latency on a subset of DataNodes.
Using CubeAPM’s Hadoop monitoring suite, the team can instantly pinpoint the issue. The Infrastructure Monitoring module visualizes cluster-level metrics in real time, while Log Monitoring correlates YARN error logs with node utilization. Smart Sampling then highlights traces where latency spikes occur, enabling engineers to identify the problematic node and rebalance workload distribution.
Through its OpenTelemetry-native integration, multi-agent support (Prometheus, Datadog, New Relic, Elastic, etc.), and self-hosted BYOC model, CubeAPM delivers full-stack observability across Hadoop, Spark, and Kafka workloads, helping enterprises scale their data pipelines with confidence and compliance.
Why teams choose different Hadoop Monitoring tools
Cost predictability at Hadoop scale
When you’re managing hundreds or thousands of nodes in a Hadoop ecosystem, monitoring tool costs can become unpredictable. SaaS platforms that charge per-host or per-feature often incur significant bill increases as HDFS capacity grows, MapReduce jobs proliferate, and job failures increase telemetry volumes. Teams, therefore, favor tools with predictable, flat-rate, or ingestion-based pricing models designed for big-data operations.
OpenTelemetry-first & multi-agent collection
Hadoop clusters generate metrics via JMX, REST APIs, YARN, and NameNode-DataNode interfaces, and logs from Spark, Kafka, Hive all need unified ingestion. Teams transitioning to vendor-neutral telemetry pipelines prefer platforms that support OpenTelemetry and multiple agents, rather than those that are vendor-locked. This flexibility is particularly important when you need to monitor HDFS, YARN, Spark executors, and correlate data across them.
Cross-layer correlation across HDFS ↔ YARN ↔ Spark
A performance issue in Hadoop often spans multiple layers: e.g., HDFS I/O latency might throttle YARN queues, which in turn slows Spark jobs. Monitoring just one layer gives incomplete visibility. Teams seek tools that stitch together NameNode/DataNode health, YARN resource usage, MapReduce/Spark job metrics, and logs so root cause analysis is rapid and accurate.
Self-hosting & data-residency / hybrid cloud readiness
Many organizations running Hadoop for regulated workloads (finance, government, healthcare) need telemetry data to stay on-premises or within specific regions. Monitoring tools that support self-hosting, private cloud, or hybrid deployment are gaining preference. Tools that restrict SaaS deployment or limit flexibility can cause compliance headaches.
Hadoop-native ecosystem fit
Hadoop environments (HDFS + YARN + ZooKeeper + Spark) have unique metric names, components like NameNode replication, DataNode block status, YARN queue fairness, etc. Monitoring tools must understand these and present dashboards accordingly, generic host-monitoring tools often miss these component-specific cues. That makes ecosystem-fit a differentiator.
Top 8 Hadoop Monitoring Tools
1. CubeAPM
Overview
CubeAPM is an OpenTelemetry-native observability platform designed for high-volume data systems, such as Hadoop, Spark, and Kafka. It’s known for its predictable pricing and full-stack visibility, allowing engineering teams to monitor HDFS nodes, YARN queues, and Spark jobs within a single interface. With multi-agent support (Prometheus, Datadog, New Relic, Elastic) and a BYOC/self-hosted model, CubeAPM has become a top choice among enterprises that need real-time Hadoop observability without vendor lock-in or unpredictable costs.
Key Advantage
Unified Hadoop observability across metrics, logs, and traces with real-time correlation that drastically reduces MTTR for distributed data pipelines.
Key Features
- HDFS & YARN Monitoring: Tracks NameNode health, replication status, and YARN queue utilization in real time.
- Smart Sampling: Captures high-value traces (such as slow jobs and errors) while optimizing storage and ingestion efficiency.
- Log Correlation: Aggregates Hadoop service logs (HDFS, Spark, Hive) and links them to trace data for faster RCA.
- Infrastructure Monitoring: Visualizes node-level CPU, memory, and disk utilization for DataNodes and ResourceManagers.
- Synthetic & RUM Tests: Simulates Hadoop API and client endpoints to detect latency and downtime before users are impacted.
Pros
- Affordable and predictable pricing model
- OpenTelemetry-native and supports multiple agents
- Strong at correlating logs, metrics, and traces
- Excellent customer support with near-instant Slack/WhatsApp response
- Compliant with localization and on-prem data residency laws
Cons
- Less suited for teams needing SaaS-only deployment
- Focused solely on observability, not cloud security or governance
CubeAPM Pricing at Scale
CubeAPM charges $0.15 per GB of data ingested, with no additional costs for infrastructure, data transfer, or user seats. For a business ingesting 45 TB (~45,000 GB) of Hadoop telemetry each month, considering 10,000 GB of logs, 10,000 GB of infra, and 25,000 GB of APM data ingested, the cost would come down to ~$7,200.
*All pricing comparisons are calculated using standardized Small/Medium/Large team profiles defined in our internal benchmarking sheet, based on fixed log, metrics, trace, and retention assumptions. Actual pricing may vary by usage, region, and plan structure. Please confirm current pricing with each vendor.
Tech Fit
Best suited for Java, Scala, and Python-based Hadoop ecosystems. Integrates seamlessly with Spark, Hive, Kafka, Flink, and HBase environments, supporting both Linux-based on-prem and hybrid deployments via OpenTelemetry agents.
2. Datadog
Overview
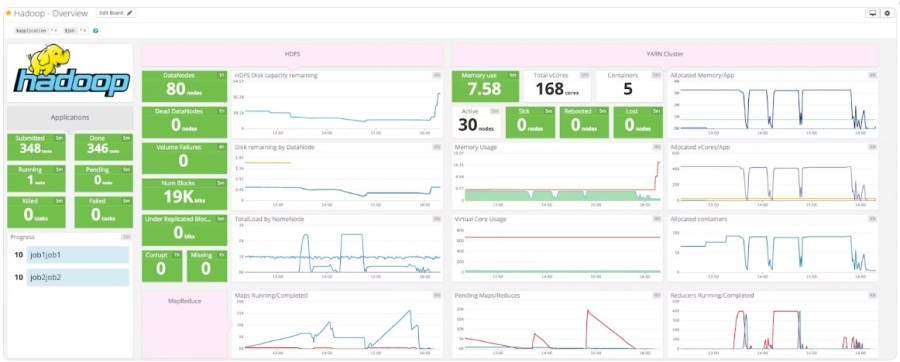
Datadog is a broad observability platform with native integrations for Hadoop components, HDFS (NameNode/DataNode), YARN/MapReduce, ZooKeeper, and Spark, plus an out-of-the-box Hadoop dashboard. You can deploy the Datadog Agent to Hadoop nodes and get prebuilt views for cluster health, capacity, queue saturation, and job behavior, which suits teams standardizing on a single SaaS for infra, APM, logs, and more.
Key Advantage
Rich, Hadoop-aware integrations and dashboards that light up quickly once the Agent is installed across NameNodes, DataNodes, and YARN nodes.
Key Features
- HDFS NameNode checks: Monitors corrupt/under-replicated blocks, dead DataNodes, capacity, and volume failures for early risk detection.
- YARN/MapReduce visibility: Tracks NodeManager/ResourceManager health, lost nodes, containers per host, and queue pressure to catch contention fast.
- Spark on Hadoop support: Out-of-the-box metrics and dashboards for Spark jobs running in Hadoop estates.
- Ambari integration: Correlates Ambari server health with Hadoop components to avoid cascading pipeline issues.
- Unified dashboarding: Prebuilt Hadoop board with HDFS, YARN, and MapReduce sections to accelerate onboarding and triage.
Pros
- Mature Hadoop integrations and quick OOTB dashboards
- Single SaaS covering infra, APM, logs, synthetics, RUM, security
- Large ecosystem of 1,000+ integrations for adjacent systems (Kafka, DBs, cloud)
- Good docs on collecting Hadoop metrics via JMX/REST and distro tools
Cons
- Could be costly for smaller teams
- SaaS-only; no self-hosting
Datadog Pricing at Scale
For a mid-sized company with 125 APM hosts, 200 infra hosts, and 10 TB/month logs, the cost will come down to ~$27,475*.
Tech Fit
Strong for Java/Scala/Python Hadoop stacks that want SaaS convenience and quick Hadoop dashboards; works well across cloud clusters where teams already run Datadog agents and want to correlate Hadoop with app/APM, infra, and logs in one place.
3. New Relic
Overview
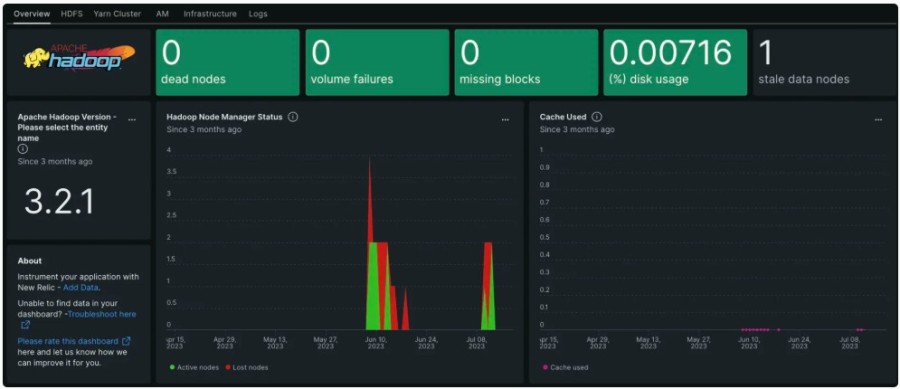
New Relic provides a Hadoop integration with prebuilt dashboards and host integrations for HDFS, YARN/MapReduce, and related JVM resources. Its Instant Observability quickstart lights up NameNode, DataNode, queue, node manager, cluster, and JVM telemetry, giving platform teams fast visibility into Hadoop health and job throughput without heavy custom setup.
Key Advantage
Quick, opinionated Hadoop dashboards and entities that accelerate time-to-value for operators standardizing on New Relic across infra, apps, and logs.
Key Features
- HDFS insight: Tracks blocks, DataNode status, capacity, and system load to anticipate replication and storage risks.
- YARN visibility: Monitors NodeManager/ResourceManager, queue metrics, and job health to spot contention early.
- JVM & cluster metrics: Out-of-the-box JVM, cluster, and node manager views tailored for Hadoop services.
- Quickstart dashboards: One-click Hadoop pack to bootstrap dashboards and alerts for common components.
- Data governance controls: Ingest optimization and drop rules to manage high-volume Hadoop telemetry.
Pros
- Mature Hadoop integration with curated quickstart dashboards
- Unified platform for infra, APM, logs, RUM, with broad ecosystem integrations
- Strong docs on setup and ingest optimization for noisy clusters
- Fits teams already standardized on New Relic across environments
Cons
- Costly at scale for smaller teams
- Advanced data features (Data Plus) cost more per GB for long-term or enriched retention
- SaaS-only; no self-hosting
New Relic Pricing at Scale
New Relic includes 100 GB/month free and then lists $0.40/GB for data ingest (Original Data option) or $0.60/GB for Data Plus. For a mid-size business ingesting 45 TB/month (~45,000 GB) data with 20% of full engineers, the cost comes down to ~$25,990*.
Tech Fit
Well-suited to Java/Scala/Python-based Hadoop stacks wanting SaaS convenience, prebuilt Hadoop dashboards, and platform consistency across infra/APM/logs; works across cloud clusters where teams prefer New Relic’s curated quickstarts and central governance for high-volume telemetry.
4. Dynatrace
Overview
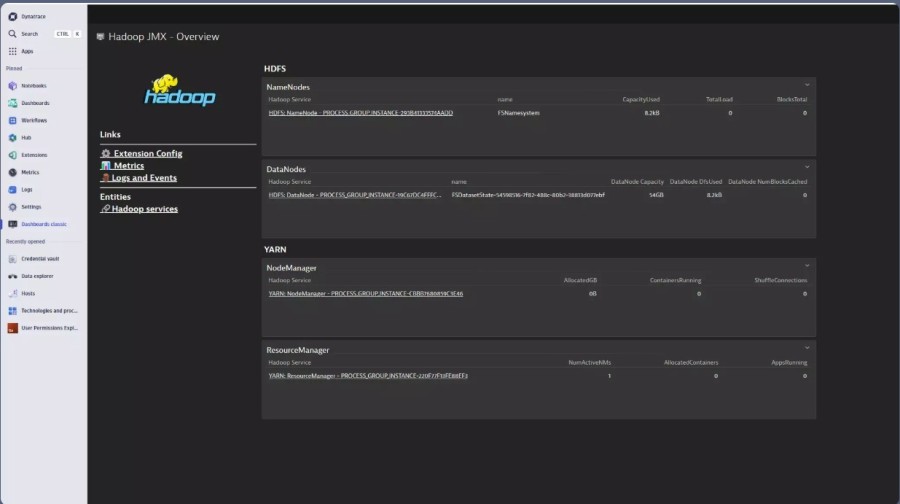
Dynatrace provides a Hadoop extension that surfaces HDFS and YARN health with OneAgent-based discovery, Hadoop-aware entities, and curated dashboards. Teams instrument NameNodes, DataNodes, ResourceManager/NodeManagers, and correlate cluster telemetry with infrastructure and application views, which is useful when Hadoop runs alongside large microservices estates, and you want one control plane for everything.
Key Advantage
AI-assisted root-cause across Hadoop components and infrastructure via Davis, reducing noise and accelerating triage in complex clusters.
Key Features
- HDFS & YARN visibility: Pulls key signals (replication risk, dead DataNodes, queue pressure) to expose early performance and resilience issues.
- OneAgent auto-discovery: Detects Hadoop processes and attaches the extension for consistent coverage across NameNodes, DataNodes, and YARN nodes.
- JMX/REST collection: Uses Hadoop-native endpoints to gather metrics with minimal custom work, keeping dashboards aligned to Hadoop semantics.
- Spark & ecosystem context: Follows Spark-on-YARN execution and surfaces resource contention patterns that affect job latency.
- Extensions framework: Add deeper metrics or vendor-distro specifics through Dynatrace Extensions when you need more than the out-of-the-box pack.
Pros
- AI-powered causal analysis reduces noisy Hadoop alerts
- Strong auto-discovery and consistent rollout via OneAgent
- Curated dashboards for HDFS/YARN with fast time to value
- Broad platform coverage for hybrid and multi-cloud estates
Cons
- Could be expensive for smaller teams
- Steep learning curve
Dynatrace Pricing at Scale
Dynatrace charges $58/month/8GiB host for Full-Stack Monitoring. There are also separate pricing for logs, custom metrics, infra, etc. For a mid-sized company, the cost can be around $21,850* (detailed in the sheet)
Tech Fit
A good match for enterprise Java/Scala Hadoop stacks running Spark-on-YARN in hybrid or multi-cloud environments, especially where you want AI-driven RCA and a single platform that unifies Hadoop with app/APM, infra, and user-experience data.
5. Apache Ambari
Overview
Apache Ambari is the native, open-source framework for provisioning, managing, and monitoring Hadoop clusters. Through its web UI and REST API, Ambari surfaces HDFS, YARN, MapReduce, HBase, and ZooKeeper health with role-aware dashboards, configuration versioning, and policy-based access, making it a strong fit for teams running on-prem Hadoop that want first-party, Hadoop-aware visibility.
Key Advantage
Built-in Ambari Metrics System (AMS) is purpose-built for Hadoop components, with curated HDFS/YARN dashboards and alerting out of the box.
Key Features
- Ambari Metrics System (AMS): Collects time-series from NameNode, DataNode, ResourceManager/NodeManager, and MapReduce counters, and stores them for analysis.
- Curated Hadoop Dashboards: Prebuilt views for HDFS replication, DataNode health, YARN queue saturation, and service availability.
- Alerting & Health Checks: Threshold and state-based alerts for critical services like NameNode, ResourceManager, and ZooKeeper.
- REST API & RBAC: Full management and monitoring via API with role-based access control for secure operations.
- Grafana Integration: Optional Grafana panels for richer visualization of AMS metrics across Hadoop services.
Pros
- Native to Hadoop with deep component awareness
- No license fees and works in air-gapped on-prem environments
- Centralized cluster config, versioning, and service control
- Extensible via REST API and Grafana for custom views
Cons
- Limited features
- Response time can be slower at times
Ambari Pricing at Scale
Ambari is open source, so there are no license charges. For 45 TB/month of Hadoop telemetry, your cost is the infrastructure to ingest, store, and serve AMS data (compute, storage, backups) plus engineering time to run and tune the stack and any add-ons (e.g., Grafana, log search).
Tech Fit
Best for on-prem or private-cloud Hadoop estates managed with Ambari, covering HDFS/YARN/MapReduce/HBase on Linux. Ideal for organizations that prefer open-source control and have platform teams comfortable operating their own monitoring stack, while integrating Grafana or external log systems as needed.
6. ManageEngine Applications Manager
Overview
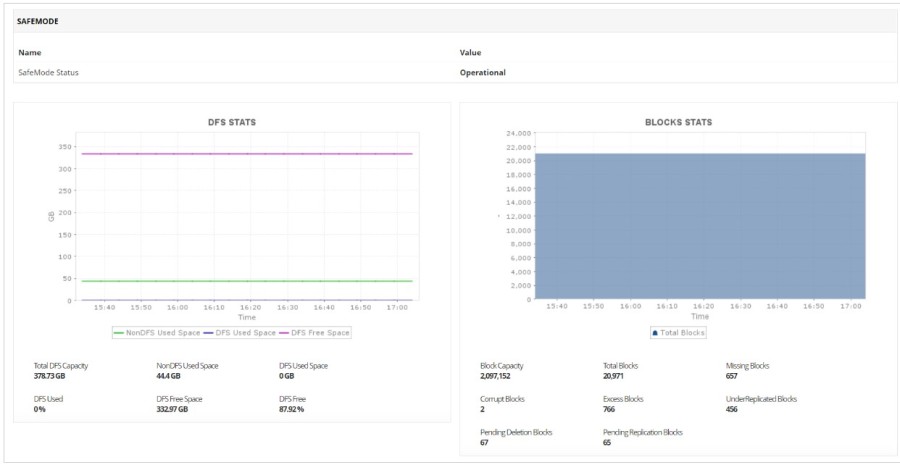
ManageEngine Applications Manager offers a Hadoop monitor with native awareness of HDFS and YARN, exposing NameNode/DataNode health, queue status, job/application states, and node counts via REST or JMX. It ships prebuilt Hadoop dashboards and reports, so ops teams can watch replication, capacity, and YARN contention without building everything from scratch.
Key Advantage
Hadoop-first monitors that connect directly to HDFS/YARN through REST or JMX, giving quick visibility into cluster health, queues, and failed jobs.
Key Features
- HDFS health & capacity: Tracks DataNode status, under-replication, storage trends, and service availability for early risk detection.
- YARN/MapReduce visibility: Monitors NodeManager/ResourceManager health, queue pressure, and container/job failures.
- Job & application tracking: Sorts jobs/apps by state and alerts on failures to speed up remediation.
- Prebuilt dashboards & reports: Real-time and historical views tailored for Hadoop clusters.
- Dual collection modes: Choose REST API or JMX per cluster for flexible setup.
Pros
- Native Hadoop monitors for HDFS and YARN
- REST/JMX setup with quick time to value
- Prebuilt dashboards and historical reports
- Works on-prem for regulated environments
Cons
- Limited features
- Complex UI
ManageEngine Pricing at Scale
Pricing is edition-based (perpetual or subscription) and depends on monitors/scale; public pages emphasize plan tiers and a quote-led flow rather than per-GB ingest. For a mid-sized company emitting 45 TB/month of Hadoop telemetry, there’s no per-GB ingest fee, but you’ll factor in the license tier plus the infrastructure to store and serve metrics.
Tech Fit
Best for on-prem or hybrid Hadoop estates that want a traditional APM/infra tool with HDFS/YARN awareness, using Java/Scala/Python data stacks and preferring REST/JMX collection with ready-made dashboards over building custom pipelines.
7. Cloudera Manager

Overview
Cloudera Manager is the enterprise admin and monitoring plane for Cloudera-based Hadoop estates, providing role-aware health, service dashboards, time-series charts, and diagnostics for HDFS, YARN/MapReduce, Hive, HBase, ZooKeeper, and hosts. It monitors services/roles against configurable health tests, exposes logs/events for triage, and offers reports (e.g., cluster utilization) tailored to Hadoop operations.
Key Advantage
Deep, Hadoop-native visibility with first-party health tests and metrics coverage across services and roles in Cloudera distributions.
Key Features
- Service & role health tests: Built-in checks for NameNode/DataNode, ResourceManager/NodeManager, and other roles to flag risks early.
- HDFS/YARN metrics browser: Rich time-series for HDFS (replication, capacity) and YARN (queue/utilization) with aggregate/“across” rollups.
- Logs & events console: Centralized log viewing by service/host and searchable events/alerts for incident analysis.
- Utilization reports & tsquery: Custom cluster utilization reports and queryable metrics for capacity planning.
- Multi-cluster monitoring: Supports viewing and managing multiple clusters through linked Cloudera Manager instances or Management Services.
Pros
- Native to Cloudera Hadoop with granular role/service awareness
- Strong built-in health tests, charts, and diagnostics for HDFS/YARN
- Centralized logs/events and utilization reporting for operators
- Suitable for regulated, on-prem, and private-cloud deployments common in Hadoop
Cons
- Expensive as compared to open-source Hadoop distributions
- Documentation can be improved
Cloudera Manager Pricing at Scale
Cloudera Manager is bundled with Cloudera Enterprise subscriptions, typically priced per node, per core, or per cluster, not per GB of telemetry. For a mid-sized estate emitting 45 TB/month of Hadoop telemetry, cost depends on your Cloudera licensing tier and infrastructure footprint, not data volume.
Tech Fit
Ideal for organizations running Cloudera-based Hadoop on-prem or private cloud that want first-party monitoring of HDFS, YARN/MapReduce, Hive/HBase, ZooKeeper, and hosts, with built-in health tests, logs/events, and utilization reporting for day-2 operations.
8. Unravel Data
Overview
Unravel Data is a workload-aware platform built to monitor, troubleshoot, and tune Hadoop/Spark applications. It complements distro tools by adding deep job analytics, automated recommendations, and cost/efficiency insights across HDFS, YARN, MapReduce, Hive, and Spark, useful when you need performance tuning and migration planning on top of day-to-day cluster monitoring.
Key Advantage
Workload-level intelligence that pinpoints slow or failing Hadoop/Spark jobs and prescribes concrete fixes to improve performance and reduce costs.
Key Features
- Workload RCA for YARN/Spark: Analyzes jobs, tasks, and containers to identify bottlenecks and misconfigurations, then suggests remediation steps.
- HDFS & YARN context: Correlates hot DataNodes, under-replication, and YARN queue contention with app behavior to surface true root causes.
- Cost & chargeback views: Breaks down compute/storage usage by job, user, queue, or workspace to drive FinOps and capacity planning.
- Migration assessment: Inventories Hadoop workloads and sizes target environments (e.g., EMR/Databricks) for smoother migrations.
- Cloudera integration: Works alongside Cloudera Manager/Workload XM to add AI-assisted tuning and estate-level visibility.
Pros
- Strong job-level analytics and actionable recommendations
- Complements native Hadoop tools with a deeper performance context
- Useful FinOps views for chargeback and optimization
- Helpful for migration planning from Hadoop to cloud engines
- Supports multi-cluster and mixed Hadoop/Spark estates
Cons
- Steeper learning curve for non-specialist ops teams
- Complex to set up
Unravel Data Pricing at Scale
Unravel’s pricing is not per-GB ingest; it’s offered in editions with pay-as-you-grow models that vary by platform (e.g., DBU-based for Databricks, options for EMR/Cloudera). For a mid-sized company emitting 45 TB/month of Hadoop telemetry, your spend depends on edition and monitored resources rather than data volume.
Tech Fit
Best for Hadoop/Spark-heavy teams on Java/Scala/Python that need advanced job tuning, FinOps/chargeback, and migration planning, especially in Cloudera environments or hybrid estates moving workloads to EMR/Databricks.
How to choose the right Hadoop Monitoring Tools
Integration with your Hadoop stack
Select a monitoring tool that seamlessly connects with HDFS, YARN, MapReduce, and Spark through JMX or REST APIs. Native integration ensures accurate visibility into NameNode health, job queues, and cluster utilization without manual instrumentation.
Scalability & cost predictability for big-data workloads
A strong Hadoop monitoring tool must handle millions of metrics per second across hundreds of nodes while keeping costs predictable. Opt for ingestion-based or fixed-rate pricing and verify the backend’s ability to scale horizontally as clusters grow.
End-to-end observability and Hadoop-specific insights
Effective monitoring requires correlating data across HDFS, YARN, and Spark. The right tool links metrics, logs, and traces to surface slow tasks, resource contention, and I/O bottlenecks, enabling faster root-cause analysis.
Deployment flexibility & hybrid readiness
Enterprises often operate Hadoop in private or hybrid clouds. Choose a platform that supports self-hosting, BYOC deployment, and strict data localization policies to meet security and compliance demands.
Conclusion
Choosing the right Hadoop monitoring tool can be daunting for data teams facing challenges like unpredictable pricing, fragmented visibility across HDFS and YARN, and a lack of unified alerting. Many solutions either cost too much at scale or fail to provide the deep Hadoop-native insights enterprises need.
That’s where CubeAPM stands out. With OpenTelemetry-native integration, multi-agent support, and ingestion-based pricing at just $0.15/GB, CubeAPM delivers full-stack Hadoop observability, covering HDFS, YARN, and Spark, with zero hidden costs. It ensures predictable budgets and faster incident resolution.
If you’re ready to simplify Hadoop observability and cut your monitoring costs, CubeAPM is the best option.
Schedule a FREE demo with CubeAPM today.
Disclaimer: The information in this article reflects the latest details available at the time of publication and may change as technologies and products evolve.
FAQs
1. What are Hadoop monitoring tools used for?
Hadoop monitoring tools help track the health and performance of Hadoop components like HDFS, YARN, MapReduce, and Spark. They collect metrics, logs, and alerts to prevent failures and optimize job efficiency.
2. How does CubeAPM simplify Hadoop monitoring?
CubeAPM provides unified observability for Hadoop clusters through metrics, logs, and traces, powered by OpenTelemetry. Its $0.15/GB ingestion-based pricing makes it cost-effective while offering deeper analytics than traditional monitoring suites.
3. Is Hadoop monitoring possible in hybrid or on-prem setups?
Yes. Tools like CubeAPM and Apache Ambari support on-prem and hybrid environments, enabling teams to maintain data residency and comply with localization policies.
4. What metrics should I monitor in Hadoop?
Key metrics include DataNode and NameNode health, YARN queue utilization, job failure rates, HDFS disk usage, and cluster memory consumption. CubeAPM automates correlation across these metrics for faster root cause detection.
5. Are there free or open-source Hadoop monitoring tools?
Yes. Apache Ambari is an open-source option providing baseline Hadoop monitoring. However, teams often pair it with a scalable observability platform like CubeAPM for advanced analytics and long-term cost efficiency.


