Java still powers critical backends from Spring Boot microservices to banking systems—but monitoring it is hard: JVM memory leaks, GC pauses, and cross-service tracing bite. Teams using top APM tools for Java with full-stack observability see 79% less downtime and 48% lower outage costs. Yet, many APM vendors make Java monitoring expensive and complex, relying on host-based billing, rigid sampling, and limited JVM insights.
CubeAPM is purpose-built for Java teams. It provides out-of-the-box JVM and Spring Boot auto-instrumentation, context-aware smart sampling that preserves slow queries and error traces, and deep GC and thread analysis. With flat pricing at $0.15/GB ingestion and no per-user fees.
In this article, we’ll compare the top 8 APM tools for Java—covering features, Java-specific strengths, pricing at scale, and why CubeAPM is the best value for Java teams.
Best APM Tools for Java Application Monitoring
- CubeAPM
- Datadog
- New Relic
- Dynatrace
- Sematext
- SigNoz
- Sentry
- Glowroot
What is a Java Application Monitoring Tool?
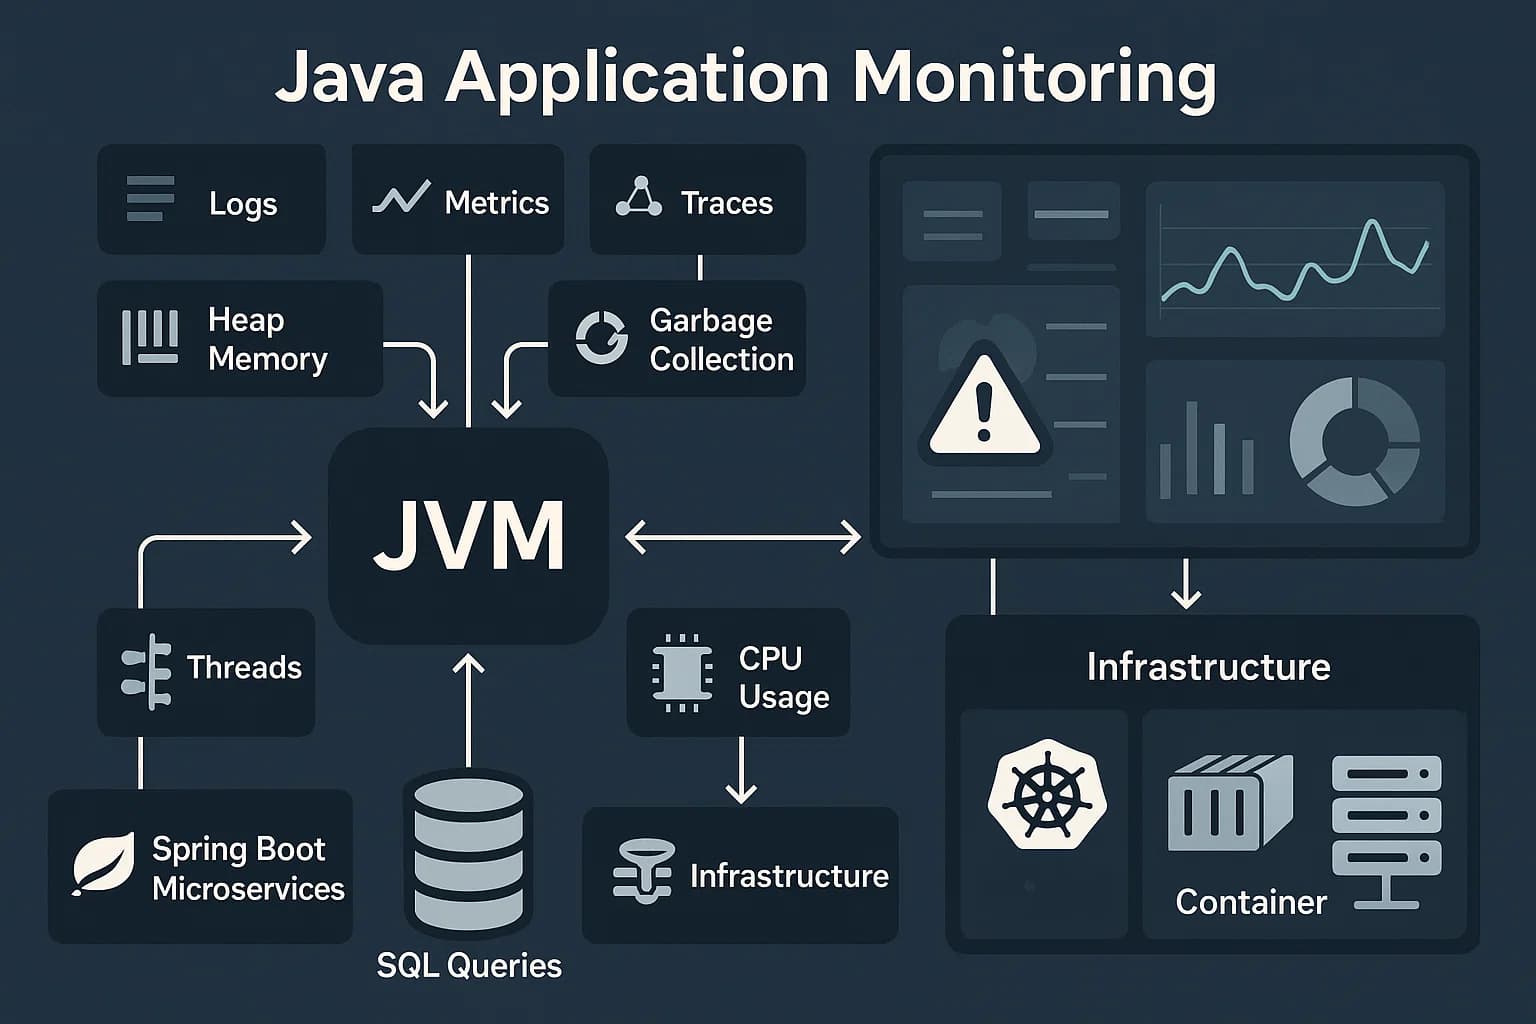
Java application monitoring tool measures, traces, and diagnoses the behavior of JVM-based services (e.g., Spring Boot, Jakarta EE, Quarkus) in production. A solid setup captures:
- Metrics (latency, error rate, throughput, JVM heap/GC/threads)
- Traces that follow requests across services and databases, and
- Logs with context.
Modern teams instrument Java with OpenTelemetry (OTel) so telemetry can be sent to any compatible backend, correlating slow endpoints to specific SQL calls, threads, or GC pauses—without vendor lock-in. For Spring Boot apps, Micrometer + OTel bridge observability directly into the framework, including sampling controls and low/high-cardinality tagging to keep data useful and affordable.
In practice, you’ll use auto-instrumentation (an agent that attaches to the JVM) or in-code instrumentation (Micrometer/OTel libraries). The OTel Java agent injects bytecode to capture traces/metrics from common Java frameworks (Servlets, Spring, JDBC) with zero code changes. Spring Boot 3’s observability layer (Micrometer + Micrometer Tracing) adds first-class support for exporting to OTel/OTLP with simple application.yml properties.
Example: How CubeAPM Monitors Java Applications
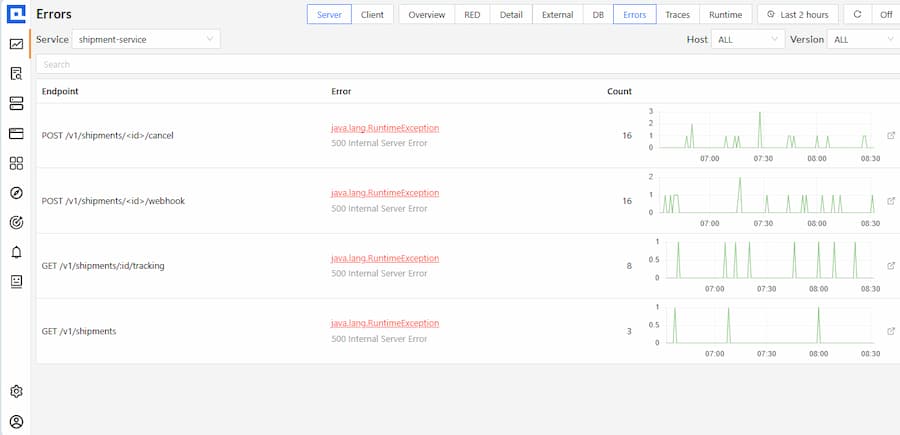
CubeAPM Error Inbox detecting recurring java.lang.RuntimeException errors across shipment APIs, with frequency trends to help teams prioritize and resolve critical Java service failures.
CubeAPM observes Java applications by leveraging the OpenTelemetry Java agent, which auto-instruments frameworks like Spring Boot or Tomcat without code changes. It unifies signals across APM, infrastructure, logs, RUM, and synthetics—so teams can follow a slow Java transaction from JVM metrics to container health, application logs, and even user impact. To achieve this, CubeAPM provides several key capabilities for Java monitoring:
- JVM Deep Insights: CubeAPM continuously tracks JVM internals such as heap memory, garbage collection pauses, and thread activity. This helps teams pinpoint memory leaks, long GC cycles, or thread contention that typically degrade Java performance.
- Framework Auto-Instrumentation: With native support for Spring Boot, Hibernate, Tomcat, and Kafka, CubeAPM auto-instruments Java frameworks out of the box. This means developers get request tracing and SQL query visibility without writing custom instrumentation code.
- Smart Trace Sampling: Instead of discarding random requests, CubeAPM applies context-aware smart sampling—capturing slow, error-prone, or unusual transactions. This preserves critical debugging data while cutting down ingestion volume by up to 80%.
- Full MELT Correlation: Metrics, events, logs, and traces are tied together in real time. For example, an elevated error rate in a Java microservice can immediately be linked to a specific SQL query or GC pause, reducing mean time to resolution.
- Scalable & Compliant Deployment: CubeAPM runs as SaaS or self-hosted, keeping telemetry inside your infrastructure if required. This is ideal for finance, healthcare, and government Java workloads where data residency and compliance (GDPR, HIPAA, DPDP) matter
Why Teams Look for Different APM Tools for Java Applications
1. JVM Memory Management & Garbage Collection
Java’s automatic memory management can cause unpredictable GC pauses and memory leaks. APM tools help visualize heap usage, GC cycles, and object allocation trends, making it easier to optimize performance before issues escalate.
2. Thread & Concurrency Issues
Deadlocks, thread starvation, and high CPU usage from poorly tuned thread pools are common in Java apps. APM tools capture thread states and execution bottlenecks, giving developers visibility into concurrency problems.
3. Slow SQL & Database Bottlenecks
Most enterprise Java apps rely heavily on JDBC or JPA/Hibernate. APM platforms trace slow SQL queries, connection pool saturation, and ORM inefficiencies—helping teams fix database latency faster.
4. Distributed Microservices Tracing
Modern Java workloads often run on Spring Boot, Micronaut, or Quarkus in Kubernetes. Distributed tracing links requests across services, exposing hidden latency in APIs, message queues, or external dependencies.
5. Cloud & Container Monitoring
With Java apps deployed on Kubernetes, Docker, or serverless platforms, visibility into pods, nodes, and resource consumption is critical. APM tools provide metrics that correlate infrastructure health with JVM performance.
Top 8 APM Tools for Java
1. CubeAPM

Known for
CubeAPM is known as a modern, OpenTelemetry-native observability platform designed for Java and cloud-native environments. It unifies logs, metrics, traces, and events into a single workflow while offering smart sampling, compliance-ready self-hosting, and flat $0.15/GB pricing. With rapid onboarding and real-time support, it stands out as a cost-efficient and developer-friendly choice for Java teams.
Java Application Monitoring Features
- JVM and GC monitoring with detailed heap, thread, and classloader metrics.
- Auto-instrumentation for Spring Boot, Hibernate, Tomcat, Kafka, Micronaut, Quarkus.
- Trace correlation across distributed Java microservices.
Key Features
- Smart Sampling: Reduces ingestion volume by up to 80% while retaining critical traces.
- Full MELT: Metrics, Events, Logs, Traces in one platform.
- Integrations: Compatible with Prometheus, Datadog, New Relic, Elastic, OTEL.
- Real-time support: Via Slack/WhatsApp with core developers.
Pros
- Transparent pricing, no per-user licensing.
- Strong compliance options (data stays inside your cloud).
- Developer-friendly with rapid onboarding (<1 hour migration).
- 60–80% cost savings vs incumbents.
Cons
- Smaller community ecosystem compared to legacy APMs.
- Newer product, less brand recognition globally.
Pricing
- Flat pricing of $0.15/GB ingesti
CubeAPM Java Application Monitoring Pricing At Scale
*All pricing comparisons are calculated using standardized Small/Medium/Large team profiles defined in our internal benchmarking sheet, based on fixed log, metrics, trace, and retention assumptions. Actual pricing may vary by usage, region, and plan structure. Please confirm current pricing with each vendor.
For a mid-sized SaaS company ingesting 45TB(~45,000) total monthly data ingestion and 45,000GB of observability data outcharged by the cloud provider, the total cost will be about ~$7200/month.
Tech Fit
CubeAPM is built for JVM-heavy workloads, offering deep insights into heap usage, GC pauses, and thread activity. With auto-instrumentation for Spring Boot, Hibernate, and Tomcat, it traces Java requests end-to-end while smart sampling preserves slow queries and error traces at scale. Flat $0.15/GB pricing and compliance-ready self-hosting make CubeAPM a cost-efficient, enterprise-grade fit for modern Java applications
2. Datadog
Known for
Datadog is known for being a cloud-native observability platform with one of the broadest ecosystems of integrations. It provides full-stack monitoring across infrastructure, applications, and security, making it popular with enterprises running complex, distributed systems. For Java workloads, it’s recognized for its strong dashboards, distributed tracing, and ability to unify data from hundreds of third-party services into a single platform.
Java Application Monitoring Features
- Auto-instrumentation for JVM, Spring Boot, Hibernate, Tomcat, Jetty, Kafka.
- Advanced JVM profiling with heap, garbage collection, and thread metrics.
- Tracing across microservices with distributed context propagation.
Key Features
- 900+ out-of-the-box integrations for infrastructure, databases, and CI/CD tools.
- AI-driven anomaly detection and alerting.
- Unified dashboarding for logs, metrics, and traces.
- RUM & synthetics for frontend + backend correlation.
Pros
- Mature ecosystem with wide community adoption.
- Strong visualizations and customizable dashboards.
- Enterprise-ready with SOC2, HIPAA, GDPR certifications.
Cons
- Expensive at scale.
- Initial setup is complex, requiring expertise.
- Smaller teams often feel overwhelmed by its breadth.
Pricing
- APM (Pro Plan): $35/host/month
- Infra (Pro Plan): $15/host/month
- Ingested Logs: $0.10 per ingested or scanned GB per month
Datadog Java Application Monitoring Pricing At Scale
For a mid-sized SaaS company operating 125 APM hosts, 40 profiled hosts, 100 profiled container hosts, 500,000,000 indexed spans, 200 infra hosts, 1,500,000 container hours, 300,000 custom metrics, and ingesting around 10TB(~10,000 GB) of logs per month with 3500 indexed logs, the monthly cost would be around ~$27,475/month.
Tech Fit
Datadog integrates smoothly with JVM-based applications, providing auto-instrumentation for Spring Boot, Hibernate, Tomcat, and Kafka. It delivers detailed JVM metrics such as heap usage, garbage collection, and thread activity, while distributed tracing links requests across microservices to help teams diagnose latency and performance issues in Java workloads.
3. New Relic
Known for
New Relic is known as one of the pioneers of application performance monitoring, trusted by enterprises for its detailed transaction tracing and mature feature set. It delivers full-stack observability with logs, metrics, traces, and synthetics, while offering strong legacy support for Java applications. Many engineering teams recognize it for its robust Java agent and ability to provide deep visibility into both modern microservices and older monolithic systems.
Java Application Monitoring Features
- Mature Java agent with deep JVM visibility.
- Auto-instrumentation for Spring, Struts, Hibernate, Tomcat, Jetty, and JDBC.
- Thread profiling, GC metrics, and transaction-level breakdowns.
Key Features
- Full-stack observability with logs, APM, infra, synthetics, and RUM.
- Custom dashboards for JVM heap, threads, and garbage collection.
- AI-based anomaly detection.
- Integrations with CI/CD and DevOps pipelines.
Pros
- Strong Java monitoring legacy with proven agent stability.
- Rich dashboards for JVM troubleshooting.
- Enterprise adoption across finance, e-commerce, and SaaS.
Cons
- High costs due to per-user and data retention pricing.
- Complex initial setup
- Overwhelming UI, especially for beginners
Pricing
- Free Tier: 100GB/month ingested
- Pro plan: $0.40/GB ingested beyond the free 100GB limit
- Pro Plan: $349/user for full platform user
New Relic Java Application Monitoring Pricing At Scale
A mid-sized SaaS company ingesting 45TB (~45,000 GB) of telemetry data per month and with 10 full users, the cost would come around ~$25,990/month.
Tech Fit
New Relic has long been known for its strong Java support, offering a stable agent that auto-instruments popular frameworks like Spring, Struts, Hibernate, Tomcat, and Jetty. It provides detailed JVM visibility into heap allocation, GC cycles, and thread states, while transaction tracing connects slow endpoints to the exact SQL queries or external calls causing delays. With its mature ecosystem and deep Java profiling features, New Relic remains a solid choice for monitoring both legacy enterprise Java systems and modern Spring Boot microservices.
4. Dynatrace
Known for
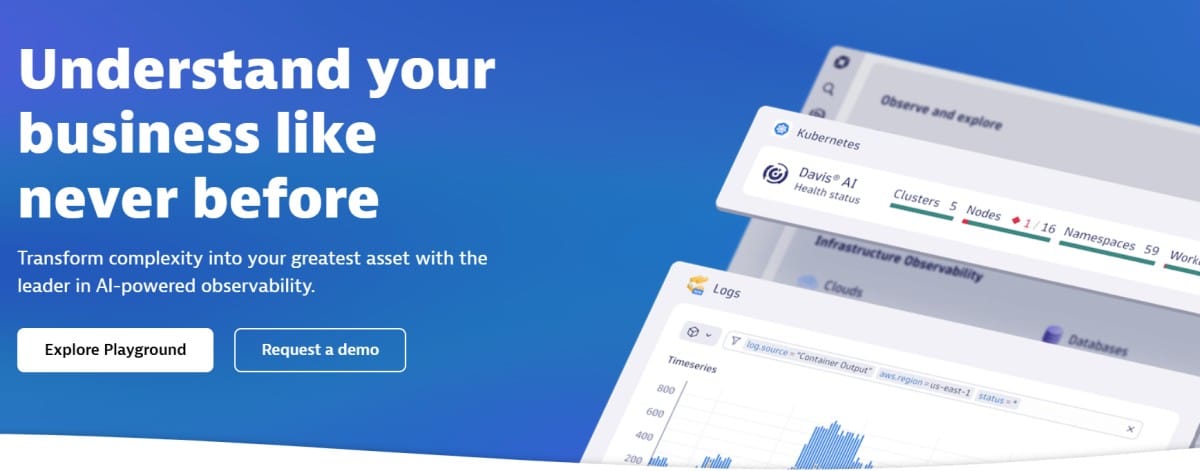
Dynatrace is known as an AI-powered observability and automation platform built for enterprises running large-scale, hybrid, and multi-cloud environments. It combines infrastructure monitoring, application performance, security, and business analytics into a single solution. For Java workloads, Dynatrace is recognized for its OneAgent auto-instrumentation and AI-driven root cause analysis, making it a trusted choice for organizations with complex, distributed systems.
Java Application Monitoring Features
- OneAgent auto-instrumentation for JVM, Spring Boot, Tomcat, WebSphere, JBoss, and more.
- Advanced JVM health metrics including heap usage, GC activity, and thread diagnostics.
- Code-level insights for Java exceptions and transaction traces.
- Automatic dependency mapping across distributed Java microservices.
Key Features
- Davis AI engine for anomaly detection and root cause analysis.
- End-to-end MELT (Metrics, Events, Logs, Traces) support.
- Strong Kubernetes and container observability.
- Real User Monitoring (RUM) and synthetics.
Pros
- Scales well for large, complex Java deployments.
- Excellent anomaly detection and automated problem detection.
- Rich dashboards tailored for enterprise needs.
Cons
- High enterprise licensing costs, with per-host and feature add-ons.
- Steep learning curve for new users.
- Complex UI for smaller teams.
Pricing
- Infrastructure Monitoring: $29/mo/host
- Full-Stack Monitoring: $58/mo/8 GiB host
Dynatrace Java Application Monitoring Pricing At Scale
A midsized SaaS company operating 125 APM hosts, 200 infra hosts, 10TB(~10,000 GB) of ingested logs, 300,000 custom metrics, 1,500,000 container hours, and 45,000GB of observability data out(charged by cloud provider), the cost would come around ~$21,850/month.
Tech Fit
Dynatrace delivers strong Java monitoring with its OneAgent auto-instrumentation, supporting JVM runtimes and frameworks such as Spring Boot, Tomcat, WebSphere, JBoss, and Hibernate. It provides deep insights into heap usage, garbage collection activity, and thread health, while automatic service discovery maps dependencies across distributed Java microservices. With AI-driven anomaly detection layered on top of detailed JVM metrics, Dynatrace helps teams quickly identify performance bottlenecks and stability issues in large-scale Java environments.
5. Sematext
Known for
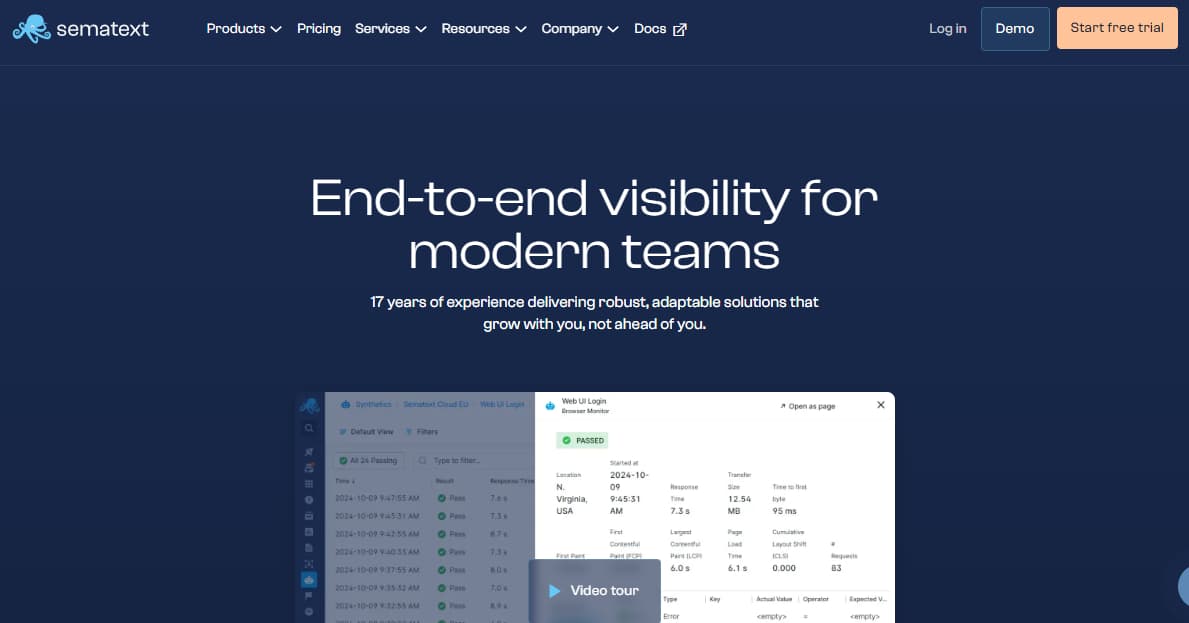
Sematext is known as a flexible observability platform that brings together logs, metrics, traces, and synthetics in a simple and affordable package. It’s valued by engineering teams for its transparent pricing and ease of setup, making it appealing to smaller and mid-sized organizations. For Java monitoring, Sematext is recognized for providing solid JVM insights and container integrations without the overhead of more complex enterprise APMs.
Java Application Monitoring Features
- Out-of-the-box support for JVM monitoring (heap, GC, threads).
- Auto-instrumentation for Spring Boot, Tomcat, Jetty, and other Java web frameworks.
- Java log parsing and correlation with application traces.
Key Features
- Unified observability, logs, metrics, traces, synthetics.
- Full integration with container platforms like Kubernetes and Docker.
- Real-time anomaly detection and alerting.
- Cloud or self-hosted deployment.
Pros
- Straightforward setup, easy for smaller Java teams.
- Transparent pricing with pay-as-you-go options.
- Flexible deployment: SaaS or on-premises.
Cons
- Overwhelming UI hinders usability
- High costs as usage grows
Pricing
Infrastructure Monitoring (per host, monthly):
- Basic: $2.80/host
- Standard: $3.60/host
- Pro: $5.76/host
Logs (per month):
- Basic: $5/month
- Standard: $50/month (1 GB/day included, 7 days retention)
- Pro: $60/month
- Extra log ingestion: $0.10/GB received, storage: $0.13/GB stored
Sematext Java Application Monitoring Pricing At Scale
For a midsized SaaS company ingesting 10 TB of logs per month with 50 hosts, Sematext’s fees add up across services. Infrastructure monitoring at the Standard tier is $180/month (50 × $3.60). Log ingestion costs $1,000 (10,000 GB × $0.10), with storage adding $1,300 (10,000 GB × $0.13). Realistic synthetic monitoring for 100 HTTP and 10 browser checks comes to $270/month. Together, the monthly bill reaches ~$2,750, nearly double CubeAPM’s flat $1,500/month, though still lower than Datadog or Dynatrace.
Tech Fit
Sematext provides Java teams with essential observability through JVM monitoring, capturing heap usage, GC activity, and thread performance. Its auto-instrumentation supports common frameworks like Spring Boot, Tomcat, and Jetty, while log correlation ties application errors directly to performance metrics. With container and Kubernetes integrations, Sematext gives Java workloads clear visibility across both runtime behavior and infrastructure layers.
6. SigNoz

Known for
SigNoz is known as an open-source, OpenTelemetry-native APM built to give developers full-stack visibility without vendor lock-in. It combines logs, metrics, and traces in one platform while offering both self-hosted and managed cloud options. For Java workloads, SigNoz is recognized for its native OTEL support and cost transparency, making it a popular choice among engineering teams looking for affordable and flexible observability.
Java Application Monitoring Features
- Java agent with auto-instrumentation for Spring Boot, Hibernate, Tomcat, Kafka.
- JVM metrics including heap, GC, and thread profiling.
- Distributed tracing with span-level visibility across microservices.
Key Features
- Full-stack observability: logs, metrics, and traces in one platform.
- Native OpenTelemetry support, avoiding vendor lock-in.
- Custom dashboards for JVM and application performance.
- Self-hosted or managed SaaS options.
Pros
- Free open-source version, making it highly accessible.
- Strong OTEL-native support.
- Transparent pricing for managed plans.
Cons
- Requires operational effort to manage at scale.
- Steep learning curve for new users
- Requires expertise to manage high-volume workloads.
Pricing
- Free for self-hosted OSS.
- Free tier + base fee of $49/month. Charges beyond the base fee are based on data ingested:
- Traces: $0.30/GB.
- Logs: $0.30/GB.
- Metrics: $0.10/million samples.
SigNoz Java Application Monitoring Pricing At Scale
For a mid-sized SaaS company that ingests 25,000GB of data by APM hosts, 10,000GB of data by infra hosts, 10,000GB of data by log hosts, and 45,000GB of observability data out(charged by cloud provider), the cost would be around ~$16,000.
Tech Fit
SigNoz is built with Java workloads in mind, offering OpenTelemetry-native instrumentation for frameworks like Spring Boot, Hibernate, Tomcat, and Kafka. Its agent captures JVM metrics such as heap usage, GC cycles, and thread activity, while distributed tracing provides span-level visibility across Java microservices. With built-in dashboards and query support, teams can quickly connect slow endpoints or errors to the underlying database queries or JVM events affecting performance.
7. Sentry
Known for
Sentry is known primarily for its error monitoring and crash reporting, widely adopted by developer teams for catching exceptions in real time. Over the years, it has expanded into lightweight APM, adding transaction tracing and performance monitoring. For Java applications, Sentry is recognized for its developer-friendly SDKs and ability to connect stack traces, errors, and slow transactions directly to the code causing them.
Java Application Monitoring Features
- Java SDK for Spring Boot, Hibernate, and Android apps.
- Captures Java exceptions, stack traces, and error details in real time.
- Transaction tracing for distributed Java microservices.
Key Features
- Strong error tracking with context-rich debugging.
- Performance monitoring: transaction latency, throughput, and slow queries.
- Integration with popular DevOps tools (GitHub, Jira, Slack).
- Lightweight agent, easy to set up for Java apps.
Pros
- Excellent for error monitoring and debugging.
- Easy setup for Java applications.
- Affordable for smaller engineering teams.
Cons
- No native support for infrastructure metrics, logs
- Complex configuration setup
- Expensive at scale
- Delays in error reporting, alerts, and display
Pricing
- Developer – Free: 1 user, Error monitoring and tracing, Alerts/notifications via email
- Team – $26/month: Everything in Developer + Unlimited users, Third-party integrations
- Business – $80/month: Everything in Team + Insights (90-day lookback), Unlimited custom dashboards
- Enterprise – Custom Pricing Everything in Business + Technical account manager
Sentry Java Application Monitoring Pricing At Scale
For a mid-sized SaaS company ingesting 10,000 TB (~10,000GB) of logs, 500,000,000 indexed spans, and 45,000GB of observability data (charged by the cloud provider), the cost would come around $12,100/month.
Tech Fit
Sentry extends beyond error tracking to provide lightweight APM capabilities for Java applications, with SDK support for Spring Boot, Hibernate, and Android. It captures unhandled exceptions, stack traces, and performance data like response times and throughput, giving developers visibility into runtime errors and latency issues. With real-time error correlation and transaction-level tracing, Sentry helps Java teams connect application crashes and slowdowns directly to the code paths causing them.
8. Glowroot
Known for
Glowroot is known as a lightweight, open-source APM designed specifically for Java applications. It runs as an agent inside the JVM with minimal overhead, making it easy to deploy and maintain. Glowroot is recognized for providing straightforward transaction tracing, SQL query analysis, and JVM monitoring, making it a practical choice for small teams, educational use, or lightweight Java monitoring needs.
Java Application Monitoring Features
- Deep JVM monitoring: heap, GC activity, thread profiling.
- Auto-instrumentation for Spring, JDBC, Hibernate, and Servlet containers.
- Transaction traces with SQL query performance visibility.
Key Features
- Simple, web-based dashboard for JVM and app metrics.
- Low-overhead agent that runs inside the JVM.
- Distributed tracing across Java microservices (basic).
- Historical data retention for performance trends.
Pros
- 100% free and open-source.
- Easy setup, minimal configuration needed.
- Very lightweight, low resource overhead.
Cons
- Limited ecosystem and no enterprise support.
- Feature set is narrower than commercial APMs.
- Not suitable for large-scale, high-volume production workloads.
Pricing
- Completely free (open-source).
- Only infrastructure costs apply for hosting.
Glowroot Java Application Monitoring Pricing At Scale
For a midsized SaaS company ingesting 10 TB of telemetry data per month across 50 hosts, Glowroot itself remains free since it’s open source. However, operating costs fall on the team — such as provisioning servers, databases, and storage to handle 10 TB of metrics and traces per month. Depending on infrastructure choice, this can add $500–$1,000/month in hidden costs for storage and management. While Glowroot is cost-effective for smaller teams, it lacks the scalability, enterprise features, and compliance controls of platforms like CubeAPM.
Tech Fit
Glowroot is purpose-built for Java, offering lightweight monitoring that runs directly inside the JVM with minimal overhead. It provides detailed transaction traces, slow SQL query analysis, heap usage, GC activity, and thread profiling, making it effective for diagnosing common Java performance issues. With its simple web UI and easy setup, Glowroot gives Java teams straightforward visibility into application behavior without the complexity of enterprise-grade APM platforms.
Conclusion
Java applications are powerful but notoriously complex to monitor—teams struggle with JVM memory leaks, garbage collection pauses, thread contention, and slow SQL queries. While APM tools like Datadog, New Relic, and Dynatrace offer visibility, they often come with hidden costs, rigid licensing, and steep learning curves that make scaling painful.
CubeAPM solves these gaps by delivering deep JVM and Spring Boot observability, OpenTelemetry-native instrumentation, and smart sampling that cuts ingestion by up to 80%. At just $0.15/GB with no per-user fees, CubeAPM provides the most affordable, developer-first APM for Java workloads, saving teams 60–80% compared to legacy tools.
If your Java team is looking for scalable, compliant, and cost-efficient monitoring, CubeAPM is the clear choice. Book a free demo today and see how you can monitor better while spending less.
Disclaimer: The information in this article reflects the latest details available at the time of publication and may change as technologies and products evolve.
FAQs
1. What is the best APM tool for Java?
CubeAPM is the best choice for Java teams thanks to its OpenTelemetry-native design, JVM/GC monitoring, Spring Boot auto-instrumentation, and smart sampling that reduces costs.
2. How do APM tools help with Java application performance?
APM tools monitor JVM health, garbage collection, memory usage, thread activity, SQL queries, and distributed transactions. This helps Java teams quickly detect bottlenecks, optimize performance, and prevent downtime.
3. Which APM tool is most cost-effective for Java applications?
CubeAPM is the most cost-effective, with flat pricing at $0.15/GB ingestion and no per-user fees. At scale, Java workloads cost 60–80% less on CubeAPM compared to Datadog, New Relic, or Dynatrace.
4. Do APM tools support Java microservices running in Kubernetes?
Yes. Modern APM tools like CubeAPM, Datadog, and Dynatrace offer distributed tracing and container monitoring for Java microservices deployed on Kubernetes, Docker, or hybrid cloud environments.
5. Can APM tools monitor frameworks like Spring Boot and Hibernate?
Absolutely. Most leading APM platforms provide auto-instrumentation for Spring Boot, Hibernate, Tomcat, Kafka, and JDBC. CubeAPM, in particular, offers seamless integration for these frameworks with minimal configuration


