










Prometheus and InfluxDB represent two fundamentally different approaches to time series data storage and monitoring. Prometheus uses a pull model where it scrapes metrics from instrumented services at regular intervals. InfluxDB uses a push model where applications actively send data points to the database. That architectural difference drives every downstream decision: how you query data, how you scale, what you pay, and where your telemetry lives.
This comparison covers data model design, query language syntax, scaling strategies, pricing structures, and deployment models. Each tool is evaluated on what it does well, where it falls short, and which workloads fit each design best. If you are evaluating both tools for infrastructure monitoring or Kubernetes observability, the infrastructure monitoring guide covers the broader context of what metrics-based monitoring must accomplish in production.
Quick Comparison: Prometheus vs InfluxDB at a Glance
| Prometheus | InfluxDB | |
|---|---|---|
| Primary use case | Metrics monitoring, alerting, service discovery | Time series storage, IoT, analytics, monitoring |
| Data collection | Pull (scrapes targets) | Push (apps send data) |
| Query language | PromQL | InfluxQL (SQL-like), Flux |
| Data model | Metric name + labels (key-value pairs) | Measurement + tags + fields + timestamp |
| Built-in alerting | Yes (Alertmanager) | No (requires Kapacitor or external tool) |
| Storage engine | Custom TSDB (time series database) | TSM (Time Structured Merge Tree) |
| Horizontal scaling | Federation, remote storage | InfluxDB Enterprise (commercial), InfluxDB Cloud |
| Deployment | Self-hosted, cloud via managed services | Self-hosted, InfluxDB Cloud (SaaS) |
| Retention policies | Manual configuration, no native downsampling | Native retention policies, continuous queries |
| Best for | Kubernetes monitoring, service health, Prometheus ecosystem | IoT sensor data, long-term analytics, high write throughput |
Prometheus Overview
Prometheus is an open-source monitoring system and time series database originally built at SoundCloud in 2012. It joined the Cloud Native Computing Foundation (CNCF) in 2016 and graduated as a top-level project in 2018, joining Kubernetes as one of only a handful of graduated CNCF projects.
Prometheus was designed specifically for monitoring dynamic cloud native environments where services scale up and down, IP addresses change, and traditional host-based monitoring falls apart. Its pull-based scraping model discovers services automatically via Kubernetes service discovery, DNS, or static configuration files, then pulls metrics from each target every 15 seconds by default.
Core components:
- Prometheus server scrapes and stores time series data
- Alertmanager handles alerts, deduplication, grouping, and routing to Slack, PagerDuty, and email
- Pushgateway allows ephemeral jobs (batch jobs, cron tasks) to push metrics
- Client libraries instrument applications in Go, Java, Python, Ruby, Node.js
- Exporters expose metrics from third-party systems (databases, hardware, HTTP endpoints)
Prometheus stores data locally on disk using a custom time series database optimized for high cardinality label sets. It does not support horizontal scaling natively. Teams that hit storage or query limits use federation (hierarchical Prometheus servers) or remote storage integrations with systems like Thanos, Cortex, or M3DB.
InfluxDB Overview
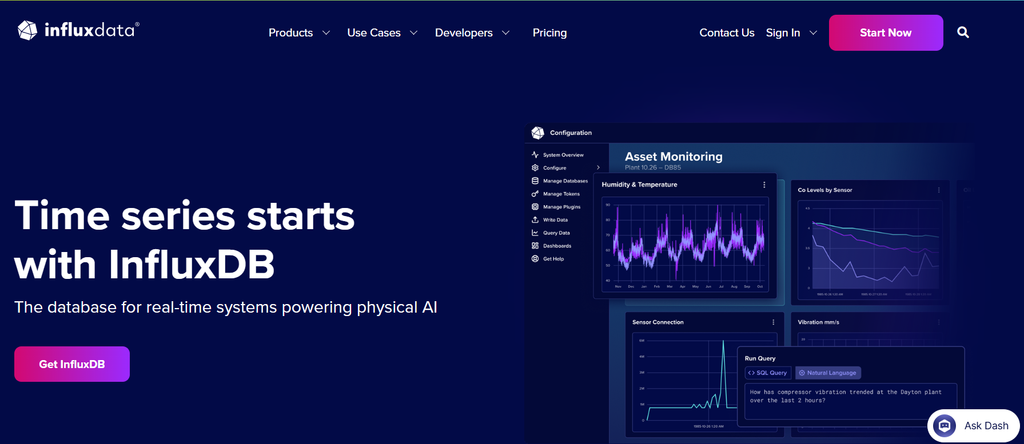
InfluxDB is an open-source time series database created by InfluxData in 2013. It was designed to handle high write and query throughput for time series data across monitoring, IoT sensor networks, real-time analytics, and financial trading systems.
Unlike Prometheus, InfluxDB is not a monitoring system. It is a database. You pair it with separate tools for data collection (Telegraf), visualization (Grafana, Chronograf), and alerting (Kapacitor). This modular approach gives flexibility but adds operational complexity compared to Prometheus, which bundles scraping, storage, alerting, and basic visualization in one binary.
Core components (TICK stack):
- Telegraf collects metrics from systems, services, and sensors
- InfluxDB stores time series data
- Chronograf visualizes data and manages InfluxDB
- Kapacitor processes, monitors, and alerts on time series data
InfluxDB 2.0 (released 2020) unified these components into a single platform with a new Flux query language, native visualization, and task scheduling. InfluxDB 3.0 (2024–2025 general availability) rewrote the storage engine in Rust using Apache Arrow and DataFusion, moving away from the older TSM engine.
InfluxDB supports both self-hosted deployments and InfluxDB Cloud, a fully managed SaaS offering. The open-source version runs on a single node. Horizontal scaling requires InfluxDB Enterprise (commercial) or InfluxDB Cloud.
Data Collection Model: Pull vs Push
The biggest architectural difference between Prometheus and InfluxDB is how data gets into the database.
Prometheus uses a pull model. The Prometheus server scrapes metrics from instrumented applications at regular intervals. Each application exposes an HTTP endpoint (typically /metrics) that returns current metric values in Prometheus text format. Prometheus discovers targets via service discovery (Kubernetes, Consul, EC2, DNS) or static configuration, then pulls metrics every 15 seconds by default.
Pull advantages:
- Prometheus knows immediately if a target is down (failed scrape = alert)
- Centralized scrape configuration makes it easier to control what gets monitored
- Applications do not need to know where to send metrics
- Easier to debug (just
curlthe metrics endpoint)
Pull disadvantages:
- Does not work well for short-lived jobs (batch jobs, cron tasks, Lambda functions) that finish before Prometheus scrapes them. This is solved with Pushgateway, but it is not ideal.
- Firewall and network topology constraints can make scraping difficult across network boundaries
InfluxDB uses a push model. Applications, agents, or Telegraf send data points to InfluxDB over HTTP, UDP, or TCP. There is no scraping. Each data source is responsible for pushing metrics to InfluxDB.
Push advantages:
- Works naturally with ephemeral workloads (Lambda, batch jobs, cron tasks)
- Easier to instrument applications that cannot expose an HTTP endpoint
- Simpler network topology (outbound only, no inbound scraping required)
Push disadvantages:
- Applications must know where to send data (InfluxDB endpoint)
- If InfluxDB is down, applications may lose data unless they buffer locally
- Harder to detect if a data source stops sending metrics (requires out-of-band monitoring)
Which model is better? Pull fits monitoring systems where you want centralized control and immediate failure detection. Push fits data pipelines where sources are ephemeral, distributed, or behind firewalls. Prometheus solves push workloads with Pushgateway. InfluxDB solves pull workloads with Telegraf configured as a scraper, but this is not native.
Data Model and Structure
Both Prometheus and InfluxDB store time series data, but the way they model that data differs significantly.
Prometheus data model:
A time series in Prometheus is identified by:
- Metric name (e.g.,
http_requests_total) - Labels (key-value pairs like
method="GET",status="200",endpoint="/api/users")
Each unique combination of metric name and label set is a distinct time series. Prometheus stores samples (timestamp + value pairs) for each time series.
Example metric in Prometheus text format:
http_requests_total{method="POST", endpoint="/api/users", status="201"} 1027This model is optimized for high cardinality dimensions. You can filter, aggregate, and group by any label combination using PromQL.
InfluxDB data model:
A data point in InfluxDB consists of:
- Measurement (like a table name, e.g.,
cpu) - Tags (indexed key-value pairs like
host=server01,region=us-west) - Fields (unindexed key-value pairs like
usage_idle=92.6,usage_user=7.4) - Timestamp
Example data point in InfluxDB line protocol:
cpu,host=server01,region=us-west usage_idle=92.6,usage_user=7.4 1617911873000000000Tags are indexed and used for filtering. Fields are not indexed and used for values you want to query or aggregate. This separation gives control over what gets indexed (and query performance), but it also means you must decide upfront which dimensions are tags (indexed) vs fields (not indexed). In Prometheus, all labels are indexed automatically.
Key difference: Prometheus treats every label as indexed and queryable. InfluxDB forces you to choose which dimensions to index (tags) vs. which to store as fields (not indexed). This makes InfluxDB more efficient for very high cardinality workloads if you choose tags carefully, but it also means incorrect tag/field choices can cripple query performance.
Query Languages: PromQL vs InfluxQL and Flux
PromQL (Prometheus Query Language):
PromQL is a functional query language designed for time series data. It operates on metrics and labels, supports aggregation, filtering, mathematical operations, and range queries.
Example: Calculate the 99th percentile of HTTP request durations over the last 5 minutes:
histogram_quantile(0.99, rate(http_request_duration_seconds_bucket[5m]))Example: Show CPU usage by host, averaged over 1 minute:
avg(rate(node_cpu_seconds_total[1m])) by (instance)PromQL is powerful but has a steep learning curve. Queries are concise once you understand the syntax, but debugging errors is difficult because PromQL does not return error messages that explain what went wrong.
InfluxQL:
InfluxQL is SQL-like and familiar to anyone who has written SQL queries. It uses SELECT, FROM, WHERE, GROUP BY, and aggregate functions.
Example: Calculate the mean CPU usage over the last hour, grouped by 5-minute intervals:
SELECT mean("usage_idle") FROM "cpu" WHERE time >= now() - 1h GROUP BY time(5m)InfluxQL is easier to learn than PromQL, but it is less expressive for certain time series operations like joins, complex aggregations, or handling multiple measurements.
Flux:
Flux is InfluxDB’s newer query language introduced in InfluxDB 2.0. It is more powerful than InfluxQL and supports joins, pivots, custom functions, and data transformations.
Example: Calculate the mean CPU usage over the last hour:
from(bucket:"telegraf")
  |> range(start: -1h)
  |> filter(fn: (r) => r._measurement == "cpu")
|> mean()Flux is powerful but verbose compared to PromQL or InfluxQL. It also has a learning curve because it uses a functional programming style with pipes.
Which query language is better? PromQL is purpose-built for metrics monitoring and time series aggregation. InfluxQL is easier for SQL users but less expressive. Flux is the most powerful but also the most verbose. Teams already familiar with SQL often prefer InfluxQL. Teams coming from Prometheus prefer PromQL. Flux is best for complex analytics or data transformations that go beyond basic metrics monitoring.
Scaling and High Availability
Prometheus scaling:
Prometheus was designed to run on a single server. It does not support horizontal scaling natively. Teams that outgrow a single Prometheus server use one of three strategies:
- Federation: Run multiple Prometheus servers, each scraping a subset of targets. A top-level Prometheus server scrapes aggregated metrics from lower-level servers. This works but adds operational complexity.
- Remote storage: Configure Prometheus to send data to a remote time series database like Thanos, Cortex, M3DB, or VictoriaMetrics. Prometheus continues to scrape and serve queries locally, but long-term storage and querying happen in the remote system.
- Sharding: Manually split targets across multiple Prometheus servers using relabeling rules. This is complex and error-prone.
Prometheus does not have built-in high availability. To achieve HA, run two identical Prometheus servers scraping the same targets, then configure Alertmanager to deduplicate alerts. This doubles your infrastructure cost.
InfluxDB scaling:
InfluxDB open source runs on a single node. Horizontal scaling requires InfluxDB Enterprise (commercial license) or InfluxDB Cloud (SaaS).
InfluxDB Enterprise supports:
- Clustering: Distribute writes and queries across multiple nodes
- Replication: Store multiple copies of data for high availability
- Sharding: Partition data across nodes by time or tag values
InfluxDB Cloud is fully managed and scales automatically based on usage. Pricing is based on data written, queried, and stored, measured in Data In (write volume), Data Out (query volume), and storage.
Cost of scaling:
- Prometheus: Free to scale if you self-host and operate your own remote storage (Thanos, Cortex). Expensive if you use a managed Prometheus service like Grafana Cloud, which charges per active series and query volume.
- InfluxDB: Free to scale horizontally if you self-host InfluxDB Enterprise (but you pay for the license). InfluxDB Cloud pricing scales with usage – verify current rates at the InfluxDB Cloud pricing page.
Which scales better? InfluxDB Enterprise and InfluxDB Cloud offer built-in clustering and replication, which is simpler than Prometheus federation. But Prometheus has a massive ecosystem of remote storage options (Thanos, Cortex, VictoriaMetrics, Mimir), many of which are open source and free. If you are willing to operate your own storage layer, Prometheus gives more control at lower cost.
Retention and Downsampling
Prometheus retention:
Prometheus stores data locally on disk. Retention is controlled by two flags:
--storage.tsdb.retention.time(default: 15 days)--storage.tsdb.retention.size(default: unlimited)
Prometheus deletes data older than the retention period or when disk usage exceeds the size limit. There is no built-in downsampling. If you want to retain downsampled data for longer periods, you must use a remote storage system like Thanos or Cortex, which support downsampling via compaction.
InfluxDB retention:
InfluxDB has native retention policies and continuous queries for automatic downsampling.
Example: Create a retention policy that keeps data for one year:
CREATE RETENTION POLICY "one_year" ON "mydb" DURATION 52w REPLICATION 1Example: Create a continuous query that downsamples CPU metrics to 30-minute averages and stores them in a separate retention policy:
CREATE CONTINUOUS QUERY "cq_30m" ON "mydb"
BEGIN
  SELECT mean("usage_idle") INTO "mydb"."one_year"."downsampled_cpu"
  FROM "cpu"
  GROUP BY time(30m)
ENDThis makes InfluxDB better suited for long term data retention compared to Prometheus, which requires external tools to achieve the same result.
Alerting
Prometheus alerting:
Prometheus has built-in alerting via Alertmanager. You define alert rules in Prometheus configuration files using PromQL expressions. When an alert fires, Prometheus sends it to Alertmanager, which handles deduplication, grouping, silencing, and routing to notification channels (Slack, PagerDuty, email, webhooks).
Example alert rule: Fire an alert if API error rate exceeds 5% for 5 minutes:
groups:
  - name: example
    rules:
      - alert: HighErrorRate
        expr: rate(http_requests_total{status=~"5.."}[5m]) > 0.05
        for: 5m
        labels:
          severity: critical
        annotations:
summary: "High error rate on {{ $labels.instance }}"Alertmanager is powerful but complex to configure. It supports grouping, inhibition, silencing, and routing trees, but the YAML configuration can become unreadable for large teams.
InfluxDB alerting:
InfluxDB does not have built-in alerting. You must use Kapacitor (part of the TICK stack) or an external tool like Grafana.
Kapacitor is a stream processing engine that runs queries against InfluxDB and triggers alerts based on conditions. It uses TICKscript, a custom scripting language.
Example Kapacitor alert: Fire an alert if CPU usage exceeds 90% for 5 minutes:
stream
  |from()
    .measurement('cpu')
  |alert()
    .crit(lambda: "usage_idle" < 10)
    .stateChangesOnly()
    .message('CPU usage critical on {{ index .Tags "host" }}')
.slack()Kapacitor is powerful but adds another component to operate. Most teams use Grafana for alerting instead because it integrates with both Prometheus and InfluxDB, supports visual alert rule creation, and handles notification routing.
Which has better alerting? Prometheus has better native alerting. Alertmanager is built for Prometheus and handles deduplication, grouping, and routing out of the box. InfluxDB requires Kapacitor or Grafana, both of which add operational overhead.
Ecosystem and Integrations
Prometheus ecosystem:
Prometheus has the largest ecosystem of any open-source monitoring tool. It is the de facto standard for Kubernetes monitoring and is deeply integrated with the cloud native ecosystem.
Key integrations:
- Kubernetes: Native service discovery, pod annotations, kube-state-metrics for cluster-level metrics
- Exporters: 200+ official and community exporters for databases (MySQL, PostgreSQL, Redis), message queues (Kafka, RabbitMQ), web servers (Nginx, Apache), hardware (node exporter), and more
- Remote storage: Thanos, Cortex, M3DB, VictoriaMetrics, Mimir, Grafana Mimir
- Visualization: Grafana is the most popular choice. Prometheus has a built-in expression browser, but it is basic.
- OpenTelemetry: Prometheus supports OpenTelemetry metrics via the Prometheus receiver in the OpenTelemetry Collector
InfluxDB ecosystem:
InfluxDB has strong integrations, especially with Telegraf, which supports 300+ input plugins for collecting data from systems, services, sensors, and APIs.
Key integrations:
- Telegraf: Collects metrics from systems, databases, message queues, APIs, and IoT devices
- Grafana: InfluxDB is a supported data source with a native query builder
- Kapacitor: Stream processing, alerting, anomaly detection
- Chronograf: Built-in visualization and InfluxDB management UI
- OpenTelemetry: InfluxDB supports OpenTelemetry metrics and traces via the InfluxDB exporter in the OpenTelemetry Collector
Which has a better ecosystem? Prometheus has a larger ecosystem, especially for Kubernetes and cloud native monitoring. InfluxDB has a strong ecosystem for IoT, sensor data, and general time series analytics.
Deployment Models and Data Residency
Prometheus deployment:
Prometheus is self-hosted by default. You run it on your own servers, VMs, or Kubernetes clusters. Data stays on your infrastructure. There is no official Prometheus SaaS offering from the Prometheus project itself.
Managed Prometheus services include:
- Grafana Cloud Prometheus: Fully managed Prometheus with long-term storage, horizontal scaling, and Grafana dashboards
- Amazon Managed Service for Prometheus: AWS-managed Prometheus compatible with existing Prometheus queries and dashboards
- Google Cloud Managed Service for Prometheus: GCP-managed Prometheus with horizontal scaling and built-in Grafana integration
Self-hosted advantages: Full control over data, no egress fees, compliance-friendly.
Self-hosted disadvantages: You operate the infrastructure, handle upgrades, manage retention, configure backups.
InfluxDB deployment:
InfluxDB supports both self-hosted and SaaS deployments.
- InfluxDB open source: Self-hosted, single node, free
- InfluxDB Enterprise: Self-hosted, clustered, commercial license
- InfluxDB Cloud: Fully managed SaaS, scales automatically, pricing based on usage
Self-hosted advantages: Data stays on your infrastructure, no egress fees, full control.
InfluxDB Cloud advantages: No infrastructure to operate, automatic scaling, managed backups, built-in visualization and alerting.
Which deployment model is better? Prometheus is self-hosted by default. InfluxDB offers both self-hosted and SaaS options. If data residency is a hard requirement (HIPAA, GDPR, data sovereignty), self-hosted Prometheus or InfluxDB are both viable. If you want a managed service, InfluxDB Cloud is simpler than setting up a managed Prometheus remote storage system.
Cost Comparison: Prometheus vs InfluxDB
Prometheus cost:
Prometheus is free and open source. There are no licensing fees. Your costs are infrastructure (compute, storage, network) and operational overhead (engineering time to operate, upgrade, troubleshoot).
Infrastructure cost example for a mid-sized deployment (100 hosts, 500K active series, 15-day retention, self-hosted):
- Compute: 8 vCPU, 32 GB RAM → ~$200/month (AWS m5.2xlarge reserved instance)
- Storage: 500 GB SSD → ~$50/month (AWS EBS gp3)
- Network: Negligible (scraping happens within your VPC)
Total: ~$250/month
If you use a managed Prometheus service like Grafana Cloud, pricing is based on active series and query volume. Example: 500K active series with 15-day retention costs approximately $800/month on Grafana Cloud – verify current rates at the Grafana Cloud pricing page.
InfluxDB cost:
InfluxDB open source is free. InfluxDB Enterprise requires a commercial license. InfluxDB Cloud pricing is usage-based.
InfluxDB Cloud pricing model:
- Data In: $0.002 per MB written
- Data Out: $0.01 per MB queried
- Storage: $0.002 per GB-hour
Example cost for a mid-sized deployment (100 hosts, 10 GB/day write volume, 30-day retention):
- Data In: 10 GB/day × 30 days × $0.002/MB = 10,000 MB/day × 30 × $0.002 = $600/month
- Storage: 300 GB × 720 hours × $0.002/GB-hour = $432/month
- Data Out (assuming 10% query volume): 30 GB/month × $0.01/MB = 30,000 MB × $0.01 = $300/month
Total: ~$1,332/month
This estimate models a specific workload profile. Your actual costs will vary based on data volume, retention period, and query frequency.
Which is cheaper?
Self-hosted Prometheus is cheaper than InfluxDB Cloud for equivalent workloads. Managed Prometheus (Grafana Cloud) is cheaper than InfluxDB Cloud for metrics-only workloads. InfluxDB Cloud becomes cost-competitive if you need long-term storage with downsampling, which Prometheus cannot do natively without remote storage.
Use Cases: When to Choose Prometheus vs InfluxDB
Choose Prometheus if:
- You are monitoring Kubernetes or cloud native infrastructure
- You need built-in alerting with Alertmanager
- You want automatic service discovery (Kubernetes, Consul, EC2, DNS)
- You need high cardinality labels without upfront indexing decisions
- You prefer a pull-based scraping model
- You want to integrate with the Prometheus ecosystem (exporters, Grafana, Thanos, Cortex)
Example use case: A SaaS company running 200 microservices on Kubernetes needs real time monitoring of API latency, error rates, pod restarts, and resource usage. They want automatic service discovery, built-in alerting, and Grafana dashboards. Prometheus fits this use case perfectly.
Choose InfluxDB if:
- You are collecting IoT sensor data or high-frequency time series data
- You need long-term storage with native downsampling and retention policies
- You prefer a push-based data model where applications send metrics
- You want SQL-like queries (InfluxQL) or advanced data transformations (Flux)
- You need horizontal scaling via InfluxDB Enterprise or InfluxDB Cloud
- You are building custom analytics dashboards or real-time data pipelines
Example use case: A manufacturing company collects sensor data from 10,000 devices every second, writes it to a central database, and runs analytics queries to detect anomalies. They need long-term storage with automatic downsampling to reduce storage costs. InfluxDB fits this use case better than Prometheus.
CubeAPM: Unified Observability with Prometheus and InfluxDB Compatibility

CubeAPM offers full-stack observability that combines APM, logs, infrastructure monitoring, and Kubernetes monitoring in a single self-hosted platform. It supports both Prometheus-compatible scraping and InfluxDB-compatible data ingestion via OpenTelemetry, making it a unified alternative to running separate Prometheus and InfluxDB stacks.
How CubeAPM fits:
- Prometheus compatibility: CubeAPM ingests Prometheus metrics via remote write or OpenTelemetry Collector. You keep your existing Prometheus exporters, service discovery, and scrape configurations while CubeAPM handles storage, retention, and querying.
- InfluxDB compatibility: CubeAPM ingests InfluxDB line protocol via Telegraf or OpenTelemetry Collector, allowing you to send sensor data, IoT metrics, or custom time series data alongside APM traces and logs.
- Unified query interface: CubeAPM provides a single query UI for metrics, traces, and logs, eliminating the need to switch between Prometheus, InfluxDB, and separate log management tools.
- Self-hosted deployment: CubeAPM runs inside your VPC or on-premises, keeping all telemetry data within your infrastructure. No data egress fees, no compliance concerns, no external dependencies during incidents.
- Predictable pricing: $0.20/GB for all ingested data (metrics, traces, logs). No per-host fees, no per-user seats, no separate storage charges. Unlimited retention included.
When CubeAPM makes sense:
- You want unified observability without operating separate Prometheus, InfluxDB, and log management stacks
- You need data residency for compliance (ISO 27001, SOC 2)
- You want Prometheus and InfluxDB compatibility without vendor lock-in
- You prefer predictable pricing over complex usage-based billing
CubeAPM is best suited for engineering teams that want full control over their observability stack without the operational burden of self-hosting and managing Prometheus, InfluxDB, Grafana, and separate log collectors.
Verdict: Prometheus vs InfluxDB
Choose Prometheus if:
You are monitoring Kubernetes, cloud native services, or dynamic infrastructure where service discovery and automatic scraping matter. You need built-in alerting, high cardinality labels, and deep integration with the Prometheus ecosystem. You prefer self-hosting and are comfortable operating Prometheus alongside a remote storage layer (Thanos, Cortex) if you need long-term retention.
Choose InfluxDB if:
You are collecting IoT sensor data, financial trading data, or high-frequency time series data where push-based ingestion, long-term storage, and native downsampling matter. You need SQL-like queries (InfluxQL) or advanced data transformations (Flux). You prefer a managed SaaS offering (InfluxDB Cloud) over self-hosting.
Choose both if:
You run hybrid workloads where Prometheus monitors your Kubernetes infrastructure, and InfluxDB handles IoT sensor data or custom analytics pipelines. Many teams use Prometheus for operational monitoring and InfluxDB for long term analytics and business intelligence.
Choose CubeAPM if:
You want unified observability that combines Prometheus and InfluxDB compatibility with APM, logs, and infrastructure monitoring in a single self-hosted platform. You need data residency, predictable pricing, and a single query interface for all telemetry data.
Disclaimer: The information in this article reflects the latest details available at the time of publication and may change as technologies and products evolve. Features, pricing, and plan limits can change over time. Always verify the latest information directly with the vendor before making purchasing or deployment decisions.
Frequently Asked Questions
What is the main difference between Prometheus and InfluxDB?
Prometheus is a monitoring system with built-in scraping, storage, alerting, and service discovery. InfluxDB is a time series database that requires separate tools for data collection, visualization, and alerting. Prometheus uses a pull model (scrapes metrics from targets), while InfluxDB uses a push model (applications send metrics to InfluxDB).
Which is better for Kubernetes monitoring, Prometheus or InfluxDB?
Prometheus is better for Kubernetes monitoring because it has native service discovery, integrates deeply with Kubernetes APIs, and includes kube-state-metrics for cluster-level visibility. InfluxDB can be used for Kubernetes monitoring via Telegraf, but it requires more manual configuration.
Can I use Prometheus and InfluxDB together?
Yes. Many teams use Prometheus for operational monitoring and alerting, then send long-term metrics to InfluxDB for analytics and downsampling. You can configure Prometheus to write to InfluxDB via remote write or use Telegraf to scrape Prometheus metrics and write them to InfluxDB.
Which has better long-term data retention, Prometheus or InfluxDB?
InfluxDB has better native long-term retention because it supports retention policies and continuous queries for automatic downsampling. Prometheus requires external remote storage (Thanos, Cortex, VictoriaMetrics) to achieve the same result.
Is Prometheus free to use?
Yes, Prometheus is free and open source. There are no licensing fees. Your costs are infrastructure (compute, storage, network) and operational overhead. Managed Prometheus services like Grafana Cloud charge based on active series and query volume.
Is InfluxDB free to use?
InfluxDB open source is free. InfluxDB Enterprise requires a commercial license. InfluxDB Cloud is a SaaS offering with usage-based pricing based on data written, queried, and stored.
Which query language is easier to learn, PromQL or InfluxQL?
InfluxQL is easier to learn because it is SQL-like. PromQL is more powerful for time series operations but has a steeper learning curve. Flux (InfluxDB 2.0+) is more powerful than InfluxQL but more verbose than PromQL.